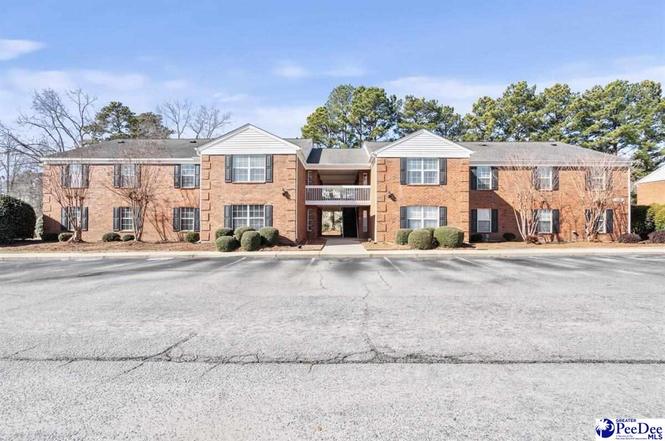
1126 Third Loop Rd E · Florence, SC
Flood risk 1/10 · Minimal
- FEMA flood zone
- X (unshaded)
- Chance of flooding over 30 yrs
- 0.0%
- Est. flood insurance / yr
- $507 – $1,088
Fire risk 5/10 · Moderate
- Est. fire insurance / yr
- $783 – $1,453
Heat risk 7/10 · Major
- Hot days now (above 108°F)
- 7 days/yr
- Hot days in 30 yrs
- 16 days/yr
Wind risk 8/10 · Major
- Chance of severe wind over 30 yrs
- 80.0%
Air-quality risk 1/10 · Minimal
- Unhealthy air days now
- 0 days/yr
- Unhealthy air days in 30 yrs
- 0 days/yr
Risk factors via First Street. Map © Google.
Why this score? — see what drove the C grade
The composite is a weighted blend of 9 inputs, each scored 0–100. Each bar is that input's sub-score; the figure is the points it added to the 100-point composite (weight × sub-score).
- Cash flow +22.1/30.0
- 1% rule +7.5/10.0
- DSCR +7.1/10.0
- ARV discount +6.3/15.0
- Rent growth +4.2/5.0
- Schools +3.2/10.0
- Livability +3.1/5.0
- Condition / age +2.5/5.0
- Appreciation +0.0/10.0
$139,995
🖨 Deal sheet 📄 Offer letter ✓ Due diligence
Listing remarks
Welcome to 1126 Third Loop Road E – a beautiful second floor condo consisting of 3 bedrooms and 2 bathrooms, located in the highly sought-after Bonnie Doon neighborhood of Florence, SC. This well-maintained community offers a prime location, convenience, and comfort all in one. Step inside to discover+/- 1,299 square feet of thoughtfully designed living space. The seller has taken excellent care of this unit! The condo features a full kitchen with appliances included and a bright, inviting layout filled with natural light. Enjoy peaceful mornings or relaxing evenings in the side room that boasts ample natural light, a perfect bonus space to unwind. This low maintenance footprint, allo
Key facts
- Ample natural light
- Move in ready
- $199 HOA
Tags
Property features AI
Finance
- Other: Subdivision: Bonnie Doon
- HOA & community: Homeowners association with a monthly fee of $199.97
Exterior
- Utilities: Public water; Public sewer
- Home design: Residential condominium
- Construction: Brick veneer construction; 1,299 above-grade finished area
- Exterior features: Shingle roof
Interior
- Kitchen: Dishwasher; Microwave; Oven; Range; Refrigerator
- Flooring: Carpet; Laminate; Vinyl
- Bathrooms: 2 full bathrooms
- Heating & cooling: Central heating; Heat pump; Central air conditioning; Ceiling fan(s)
- Interior features: Insulated windows; Dishwasher, Microwave, Oven, Range, Refrigerator
Neighborhood map
What this means for you Summary
Snapshot
- This is a 3-bed/2.0-bath townhouse listed at $140k.
Deal economics
- At list price, monthly cash flow is $225 ($3k/yr) — positive.
- The deal already cash-flows at list — no discount required.
- Meets the 1% rule at list price ($2k rent vs $140k).
- Recommended offer: $127k (9.0% below list) — sets the bar for market timing.
- Cap rate 8.2% vs local median 3.5% in Florence — top-decile yield for the area; either an underpriced asset or a hidden risk that comps aren't pricing in. Stress-test before assuming the spread holds.
Location & tenants
- Location reads 62/100 on livability (#196 in SC) — a middle-class / working-renter tenant base. Strengths: cost of living A+, housing A+, health & safety B+; Watch: employment C-, crime F, amenities F.
- Florence 01 (urban): math 29% / reading 47% proficiency, ranked #34 of 80 in SC (top 42%) — families likely to look elsewhere, expect single-tenant / working-renter base with shorter leases.
- Zoned schools: Mclaurin Elementary (math 27% / reading 43%, grade F, #339 of 597 statewide, top 57%, 957 students, 100% FRL); Southside Middle (math 18% / reading 38%, grade F, #146 of 229 statewide, top 64%, 1,100 students, 100% FRL); South Florence High (math 58% / reading 86%, grade B+, #48 of 196 statewide, top 26%, 1,643 students, 77% FRL) — zoned schools average 92% FRL vs 57% district-wide (35 pts higher); higher-poverty schools than district average — tighter screening recommended.
- Market conditions: Rents rising fast (+7.0%/yr); 183 active listings in the ZIP; 657 units permitted in Florence County in 2024 (40 in 5+ unit buildings).
- This rent runs 31% of the median local income ($67k/yr) — at the standard rent-burdened threshold; future hikes will face affordability resistance.
Forward outlook
- Local home prices are declining (-3.0%/yr); year-one equity from $968 of loan paydown is wiped out by about $4k of value loss. Plan a longer hold.
- At projected returns (-3.0% appreciation + 7.0% rent growth), your $39k cash investment doubles in ~9 years — after that, you're playing with house money.
Negotiation context
- It's been on market 98 days — a 9% lower offer ($127k) is reasonable based on typical stale-listing flexibility.
- 2 sale attempts with the ask held roughly flat each time — persistent listings suggest the price (not the market) is what's stuck; bring a comps-based counter.
- Current owner paid $74k; list at $140k implies a 88% gain — meaningful room to come down on a strong offer.
Risks & watch-outs
- Climate carrying-cost: severe wind risk, 80% chance of damaging wind over 30y; moderate wildfire risk; extreme-heat days projected 7→16/yr by 2055 (HVAC capex compounding) — expect insurance premiums to compound above CPI over the hold.
Questions for the listing agent
- It's been on market 98 days. Have you received any prior offers? Is the seller open to a 9% concession, seller financing, or rate buy-down credit?
- What does the HOA fee cover, when was the last increase, and are there any pending special assessments or reserve-fund shortfalls?
- Why hasn't it sold? Are there any deal-killer items the seller is aware of (foundation, flood, title, zoning, code violations)?
- Is there a deadline driving the sale (1031 exchange, divorce, estate, relocation)? That informs how much negotiation room exists.
- Crime grade is F in this area — have there been break-ins, vandalism, or insurance claims at this property in the last 3 years? What carrier currently insures it and at what premium?
- What's the average days-on-market for RENTAL listings here right now (not sales)? A rising rental-DOM trend means longer vacancies and softer asking-rent achievability than the comps imply.
- What's the recent tenant-quality profile in this submarket — average credit score on applications, eviction rate, late-payment / NSF rate, and stable-employment percentage? A property-management company in the area should have these aggregated.
- How much new for-sale + rental construction is in the pipeline within 1–3 miles? Heavy new supply typically softens prices + rents 12–24 months out; constrained supply supports both.
Investment metrics
- 1% rule
- 1.25% ✓
- Cap rate
- 8.22%
- Cash-on-cash
- 6.88%
- DSCR
- 1.31
- GRM
- 6.7
CMA / ARV
- ARV (on-the-fly)
- $136,395
- Comps found
- 7
Show comp detail 7 sales within ~0.75 mi
| Address | Dist | Beds/Ba | Sqft | Sold | Price | $/sf | Match |
|---|---|---|---|---|---|---|---|
| 1114 Third Loop D | 0.03mi | 3/2.0 | 1,299 (0%) | 11mo | $142,500 | $110 | 90 |
| 1189 Waxwing Dr Unit B Dr | 0.12mi | 3/2.0 | 1,450 (+12%) | 1mo | $155,000 | $107 | 74 |
| 1189 Waxwing Drive Apt A Dr | 0.12mi | 2/2.0 (-1) | 1,450 (+12%) | 4mo | $155,000 | $107 | 67 |
| 1197 Waxwing Drive Apt C Dr | 0.16mi | 2/2.0 (-1) | 1,402 (+8%) | 11mo | $147,500 | $105 | 66 |
| 1189 Waxwing Dr Apt G Dr | 0.12mi | 2/2.0 (-1) | 1,480 (+14%) | 14mo | $144,000 | $97 | 55 |
| 1193 Waxwing Drive Unit C Dr | 0.14mi | 3/2.0 | 1,450 (+12%) | 24mo | $149,900 | $103 | 54 |
| 533 3rd Loop Road Apt. A | 0.73mi | 3/2.0 | 1,304 (+0%) | 21mo | $130,000 | $100 | 48 |
Match score weights: distance 35% · size 25% · config 20% · recency 20%. Top-matched comps best support the ARV.
Projected returns pro-forma
-3.0% appreciation · 6.97% rent growth · sell at horizon
- IRR
- -0.6%
- Equity multiple
- 0.97×
- Total profit
- $-985
- Equity at exit
- $20,874
- IRR
- 13.3%
- Equity multiple
- 2.29×
- Total profit
- $50,420
- Equity at exit
- $12,104
Cash invested: $39,199 (down + closing). Projections, not guarantees.
Landlord ↔ Tenant lean methodology
- Overall (STATE)
- 90 Strongly Landlord-Friendly
- State South Carolina
- 90 Strongly Landlord-Friendly · R+6
- County
- — inherits STATE
- City
- — inherits STATE
ZIP-level market 29505
- Rents YoY
- 7.0%
- Active inventory
- 183
- Price-to-rent
- 6.7×
Monthly cashflow live
- Estimated rent
- $1,745 medium interval (Pro) →
- Mortgage (P&I)
- −$734
- Tax from tax record
- −$162 /mo · $1,946/yr
- Insurance
- −$58
- HOA
- −$199
- Vacancy / Maint / Mgmt
- −$366
- Net cashflow
- $225
Break-even live
UW: 25.0% down · 7.5% · 30yr · 1.5% tax · 5.0% vac · 8.0% maint · 8.0% mgmt
Financing live
Cash to close
- Down payment
- $34,999
- Closing costs
- $4,200
- Reserves months
- —
- Total cash needed
- —
Loan-product check · same deal, 3 products live
Conventional
25% down · 7.5% · 30yr
- Down + closing
- —
- Monthly P&I
- —
- Monthly cashflow
- —
- DSCR
- —
- Eligible?
- —
Personal DTI + credit; lowest rate.
DSCR
20% down · 8.5% · 30yr
- Down + closing
- —
- Monthly P&I
- —
- Monthly cashflow
- —
- DSCR
- —
- Eligible?
- —
No personal income docs; deal must DSCR.
Hard money
10% down · 12.0% · 12mo
- Down + closing
- —
- Monthly P&I
- —
- Monthly cashflow
- —
- DSCR
- —
- Eligible?
- —
Short-term bridge; refi at stabilization.
HOA detail
- Monthly dues
- $199 · $2,388/yr
Listing history 24 events
-
2026-06-19days on market $139,995 Active 98 DOM
-
2026-06-18days on market $139,995 Active 97 DOM
-
2026-06-17days on market $139,995 Active 96 DOM
-
2026-06-16days on market $139,995 Active 95 DOM
-
2026-06-15days on market $139,995 Active 94 DOM
-
2026-06-14days on market $139,995 Active 92 DOM
-
2026-06-13days on market $139,995 Active 91 DOM
-
2026-06-10days on market $139,995 Active 89 DOM
-
2026-06-09days on market $139,995 Active 88 DOM
-
2026-06-08days on market $139,995 Active 87 DOM
-
2026-06-07days on market $139,995 Active 86 DOM
-
2026-06-05days on market $139,995 Active 83 DOM
-
2026-06-02days on market $139,995 Active 81 DOM
-
2026-06-01days on market $139,995 Active 80 DOM
-
2026-05-31days on market $139,995 Active 79 DOM
-
2026-05-30days on market $139,995 Active 78 DOM
-
2026-05-11price $139,995
-
2026-05-07status Active
-
2026-03-31historical
-
2026-02-16historical Active Under Contract
-
2026-02-04$145,000 Active
-
2017-03-27soldstatus $74,500
-
2008-01-29soldstatus $85,000
-
1998-10-31soldstatus $64,400
ⓘ Source: listings_history table (triggers on properties + properties_extension) + one-shot
backfill from property_details.listing_events for pre-trigger history.
Tax reassessment forecast SC · Resets to sale price
- Current annual tax
- $1,946 · $162/mo
- Projected year-2 tax
- $1,946 · $162/mo
- Expected delta
- $0/yr ($0/mo · 0.0%)
ⓘ Screening estimate from a state-policy table — verify with the county assessor before closing.
Climate risk First Street
- Flood 1/10 Low FEMA zone X (unshaded) · 0% chance over 30 yrs
- Wildfire 5/10 Major
- Heat 7/10 Severe 7 d/yr ≥108°F today · 16 d/yr by 30 yrs out
- Wind 8/10 Severe 80% chance of damaging wind over 30 yrs
- Air quality 1/10 Low 0 unhealthy d/yr today · 0 by 30 yrs out
Nearby sold comps map
Loading sold comps map…
Walkable amenities ~0.75 mi
Loading nearby amenities…
Taxation est. · year 1
- Rental income
- $20,937
- − Mortgage interest
- −$7,842
- − Property taxes
- −$1,946
- − Insurance
- −$700
- − Repairs & maintenance
- −$1,675
- − Management
- −$1,675
- − HOA
- −$2,388
- − Depreciation
- −$4,073
- Taxable income
- $639
- Est. tax owed @ 24.0%
- −$153
- After-tax cash flow
- $2,543/yr
For passive investors: Depreciation is non-cash, so a rental often shows a tax loss while cash-flowing — sheltering income. Rental losses are passive: they offset passive income freely, and up to $25,000/yr can offset ordinary (W-2) income if you actively participate and your MAGI is under $100k (phasing out to $0 by $150k); unused losses carry forward. On sale, claimed depreciation is recaptured at up to 25%, and gains may owe capital-gains tax (a 1031 exchange can defer both). Figures are a year-1 estimate at your 24.0% rate — not tax advice; consult a CPA.
Schools (NCES district)
- District
- Florence 01
- NCES district ID
- 4502130
- Math proficiency
- 29% ▼ -10.00%
- Reading proficiency
- 47% ▬ 0.00%
- Median HH income
- $45,782
- Composite
- 32.36/100
- National rank
- #5737
- State rank
- #34 of 80 in SC
Livability — Florence
- Score
- 62/100
- State rank
- #196
- US rank
- #17076
Category grades
Schools grade is shown separately in the Schools card above.
Census & demographics
- Census place
- Florence, SC
- County
- Florence County · 93,345 people
- City population
- 93,345
- Metro
- Florence, SC
- Population (ZIP)
- 23,895
- Household income
- $67,343
- Rent vs Own
- Severe rent burden
- 559.0
Population outlook (Florence County) Hauer SSP2
- Today (2025)
- 141,714 people
- By 2030
- 142,121 · +0.3%
- By 2040
- 141,344 · -0.3%
- By 2050
- 139,478 · -1.6%
- By 2075
- 132,275 · -6.7%
- By 2100
- 118,374 · -16.5%
Race, ethnicity, and origin ACS 2023
- Neighborhood character
- Diverse neighborhood (Simpson 0.57)
- Race & ethnicity
- White 53% Black 38% Hispanic / Latino 5% Two or more races 3% Asian 1%
- Common ancestry
- Slovak 2% Lithuanian 1% Serbian 1%
- Foreign-born
- 3% · Canada, China
- Languages at home
- 96% English-only · Spanish 2% Other Indo-European 1%
Political lean MEDSL · Florence
- 2024 margin
- Lean R (+8.0) · D 45.3% · R 53.3% · Other 1.3%
- 2008→2024 swing
- -4.8pp toward R · 2008: -3.2pp · 2024: -8.0pp
- All cycles
- 2024: R+8.0 2020: R+2.3 2016: R+5.0 2012: R+0.5 2008: R+3.2
Not yet ingested
- Civics
- —
Market trends
- HPI YoY
- ▼ -138.13%
- Current HPI
- 177.9352
- Rent YoY
- ▲ 6.97%
- Metro
- Florence, SC
- State GDP YoY
- ▲ 4.51%
- F500 in state
- 2
Industry mix (Fortune 500 HQ in SC)
| Industry | F500 HQs | Revenue |
|---|---|---|
| Packaging | 1 | $7B |
|
||
Price history
+117.4% since first listed8 events — show timeline
- 2026-05-11 Price Changed $139,995 RAGPD
- 2026-05-07 Relisted — RAGPD
- 2026-03-31 Delisted — RAGPD
- 2026-02-16 Contingent — RAGPD
- 2026-02-04 Listed $145,000 RAGPD
- 2017-03-27 Sold (Public Records) $74,500 Public Records
- 2008-01-29 Sold (Public Records) $85,000 Public Records
- 1998-10-31 Sold (Public Records) $64,400 Public Records
Property tax history
+26.2%/yrLatest (2025): $1,946 · +6.6% YoY. Source: county tax records.
Cash-flow waterfall
monthlySold comps — $/sqft
last 12 mo · ≤1 miLoading sold comps…