 🏗️ New Construction
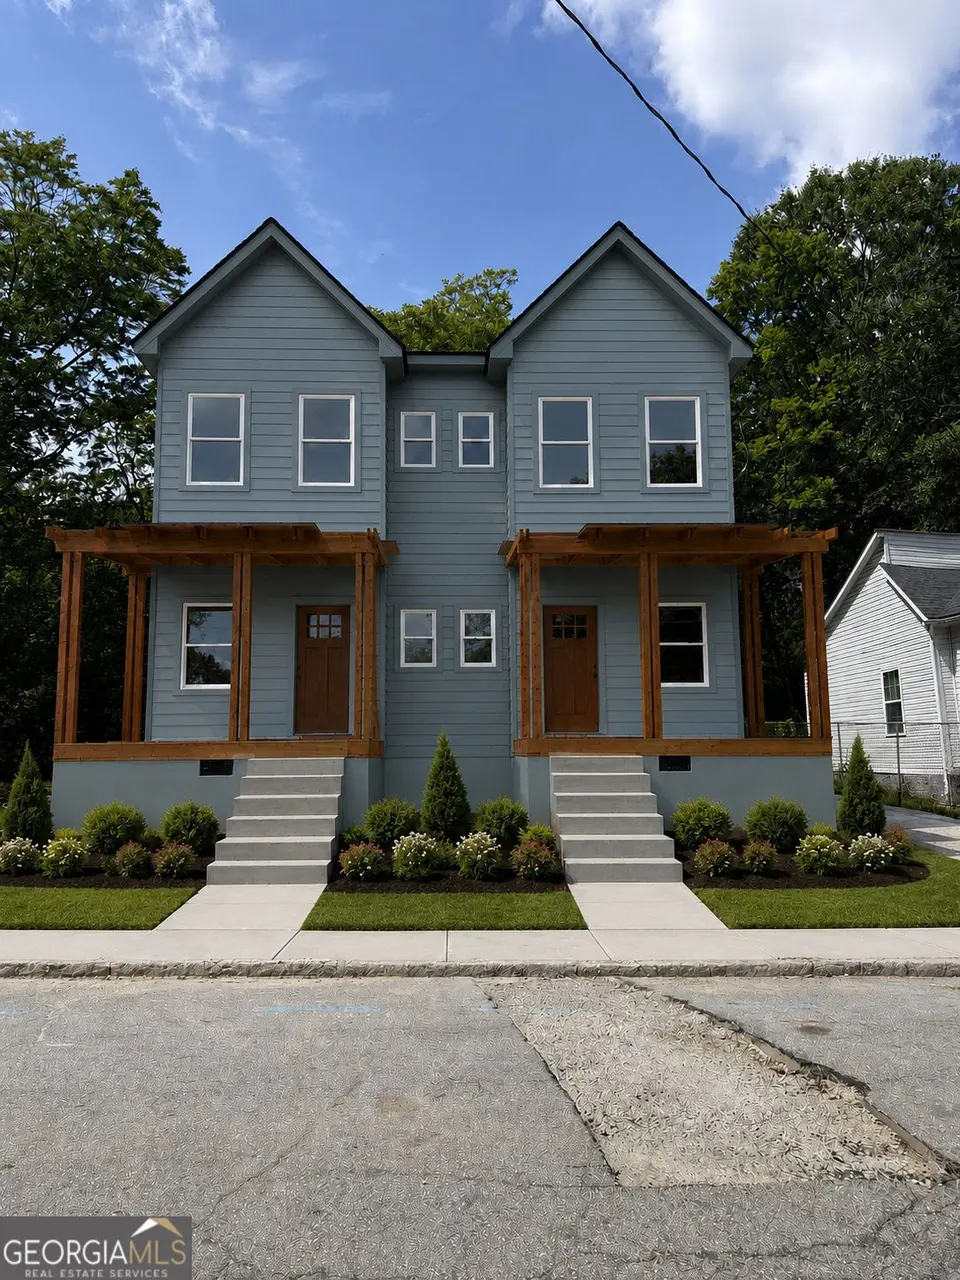
815 Cameron M Alexander Blvd NW · Atlanta, GA
Flood risk 1/10 · Minimal
- FEMA flood zone
- X (unshaded)
- Chance of flooding over 30 yrs
- 0.0%
- Est. flood insurance / yr
- $473 – $860
Fire risk 1/10 · Minimal
- Est. fire insurance / yr
- $963 – $1,789
Heat risk 5/10 · Moderate
- Hot days now (above 103°F)
- 6 days/yr
- Hot days in 30 yrs
- 16 days/yr
Wind risk 5/10 · Moderate
- Chance of severe wind over 30 yrs
- 25.0%
Air-quality risk 4/10 · Minor
- Unhealthy air days now
- 5 days/yr
- Unhealthy air days in 30 yrs
- 7 days/yr
Risk factors via First Street. Map © Google.
Why this score? — see what drove the F grade
The composite is a weighted blend of 9 inputs, each scored 0–100. Each bar is that input's sub-score; the figure is the points it added to the 100-point composite (weight × sub-score).
- ARV discount +7.5/15.0
- Cash flow +6.9/30.0
- Livability +4.2/5.0
- Rent growth +3.3/5.0
- Schools +2.7/10.0
- Condition / age +2.5/5.0
- DSCR +1.1/10.0
- 1% rule +0.9/10.0
- Appreciation +0.0/10.0
$254,900
🖨 Deal sheet (PDF) 📄 Offer letter ✓ Due diligence
Listing remarks MLS
**Eligible buyers may purchase for $202,400 with rates as low as 5.75% and over $50,000 in down payment assistance available (qualifications apply). Call NOW for details and availability.** **Home actively under construction; DO NOT walk site. Drive by, only. This home is part of the Atlanta Land Trust.** Experience stylish intown living in this beautiful new-construction townhome located in Atlanta's rapidly growing English Ave neighborhood. Thoughtfully designed for modern lifestyles, this home offers the perfect combination of comfort, convenience, and value. The open-concept floor plan features spacious living and dining areas that flow seamlessly into a designer kitchen complete with solid-surface countertops, recessed lighting, abundant cabinetry, and an oversized island perfect for entertaining family and friends. Enjoy your own private outdoor space, ideal for relaxing, bird-watching, or enjoying your morning coffee. With 2 or 3 bedrooms options available, and 2.5 bathrooms, there's plenty of room for guests, a home office, or flexible living arrangements. The main-level owner's suite features a walk-in closet and a spa-inspired tiled shower. Conveniently located just minutes from I-75/85, Hartsfield-Jackson Atlanta International Airport, and the booming Westside BeltLine corridor. Enjoy easy access to Lee + White, Ponce City Market, Atlantic Station, Westside Park and some of Atlanta's best dining, shopping, breweries, and entertainment destinations. All kitchen appliances are included, and a 10-Year Home Warranty provides added peace of mind. Schedule your tour today and discover why English Ave is one of Atlanta's most exciting places to call home.
Key facts
- Designer kitchen
- Walk in closet
- Parking
Tags
Property features AI
Finance
- Financial info: Property is one of two units in the community; one unit to be built
- HOA & community: Association fee includes water
Exterior
- Parking: Assigned, deeded parking (1 total space)
- Utilities: Public water; Public sewer; 220-volt electric service; Cable, electricity, natural gas, sewer, and water available
- Home design: Two levels; New construction; Fee simple ownership; Wind energy generation available
- Construction: Cement siding and wood siding; Composition roof; Block foundation; Built as new construction
- Exterior features: Fenced yard; Front porch; Near shopping, schools, park, and Beltline; City street frontage on asphalt road
Interior
- Kitchen: Solid surface counters; Pantry; Breakfast bar; Dishwasher; Disposal; Microwave; Refrigerator; Electric oven
- Bedrooms: Two upper-level bedrooms; Split bedroom plan with roommate floor plan
- Flooring: Laminate
- Bathrooms: Two full bathrooms; One half bathroom (main level); Master bath with double vanity
- Heating & cooling: Electric heating; Electric cooling
- Interior features: One fireplace located in the family room; Walk-in closet(s); Insulated windows; 1 common wall (attached)
- Laundry & utility: Laundry closet
Neighborhood map
What this means for you Summary
Snapshot
- This is a 3-bed/1.0-bath townhouse listed at $255k.
Deal economics
- At list price, monthly cash flow is $-532 ($-6k/yr) — negative.
- The deal already cash-flows at list — no discount required.
- To meet the 1% rule (rent ≥ 1% of price), the offer needs to be $207k (18.9% below list).
- Recommended offer: $207k (18.9% below list) — sets the bar for 1% rule.
- Cap rate 4.5% vs local median 3.1% in Atlanta — top-decile yield for the area; either an underpriced asset or a hidden risk that comps aren't pricing in. Stress-test before assuming the spread holds.
Location & tenants
- Location reads 83/100 on livability (#6 in GA, #919 nationally) — a professional / high-income tenant draw. Strengths: amenities A+, commute A+, housing A+; Watch: cost of living C-.
- Atlanta Public Schools (urban): math 28% / reading 35% proficiency, ranked #80 of 174 in GA (top 46%) — families likely to look elsewhere, expect single-tenant / working-renter base with shorter leases; 71% free/reduced lunch — lower-income household profile, screen leases tightly.
- Zoned schools: Michael R. Hollis Innovation Academy (math 2% / reading 8%, grade F, #1,160 of 1,228 statewide, top 98%, 653 students, 100% FRL); Herman J. Russell West End Academy (math 12% / reading 12%, grade F, #417 of 470 statewide, top 90%, 399 students, 100% FRL); Booker T. Washington High School (math 24% / reading 24%, grade F, #184 of 424 statewide, top 48%, 831 students, 100% FRL) — zoned schools average 100% FRL vs 71% district-wide (29 pts higher); higher-poverty schools than district average — tighter screening recommended.
- Zoned-school proficiency averages 14% at this address vs 32% district-wide (-18 pts) — the specific schools serving this property underperform the Atlanta Public Schools average; the district grade overstates school quality for this exact location.
- Market conditions: Rents rising (+3.3%/yr); 732 active listings in the ZIP; 40 comparable units currently listed for rent nearby; rentals at typical pace (median 27d on market — plan ~3-4 weeks tenant-placement turnaround); solid renter incomes; 11,565 units permitted in Fulton County in 2024 (8,159 in 5+ unit buildings).
Forward outlook
- Local home prices are declining (-3.0%/yr); year-one equity from $2k of loan paydown is wiped out by about $10k of value loss. Plan a longer hold.
- Fulton County population projected at +38% by 2050 — long-run rental-demand tailwind backs the buy-and-hold thesis.
Negotiation context
- It's been on market 15 days — a 2% lower offer ($251k) is reasonable based on typical stale-listing flexibility.
- 4 sale attempts since 4y ago with the ask held roughly flat each time — persistent listings suggest the price (not the market) is what's stuck; bring a comps-based counter.
- Current owner paid $75k; list at $255k implies a 240% gain — meaningful room to come down on a strong offer.
Risks & watch-outs
- Climate carrying-cost: moderate wind risk, 25% chance of damaging wind over 30y; extreme-heat days projected 6→16/yr by 2055 (HVAC capex compounding) — expect insurance premiums to compound above CPI over the hold.
Questions for the listing agent
- What do current leases actually rent for vs. the listed asking? Can we see a recent rent roll and the last 12 months of T-12 income?
- Is there a deadline driving the sale (1031 exchange, divorce, estate, relocation)? That informs how much negotiation room exists.
- The area grade is low — what's the realistic commute time and amenity access for the typical tenant pool here? Any planned neighborhood developments (good or bad) we should know about?
- What's the average days-on-market for RENTAL listings here right now (not sales)? A rising rental-DOM trend means longer vacancies and softer asking-rent achievability than the comps imply.
- What's the recent tenant-quality profile in this submarket — average credit score on applications, eviction rate, late-payment / NSF rate, and stable-employment percentage? A property-management company in the area should have these aggregated.
- How much new for-sale + rental construction is in the pipeline within 1–3 miles? Heavy new supply typically softens prices + rents 12–24 months out; constrained supply supports both.
Investment metrics
- 1% rule
- 0.59% ✗
- Cap rate
- 4.47%
- Cash-on-cash
- -6.53%
- DSCR
- 0.71
- GRM
- 14.1
CMA / ARV
- ARV (on-the-fly)
- $349,320
- Comps found
- 3
Show comp detail 3 sales within ~0.75 mi
| Address | Dist | Beds/Ba | Sqft | Sold | Price | $/sf | Match |
|---|---|---|---|---|---|---|---|
| 2819 Georgia Aster Way NW | 0.28mi | 3/2.5 | 1,418 (-0%) | 1mo | $336,990 | $238 | 80 |
| 2823 Georgia Aster Way NW | 0.28mi | 3/2.5 | 1,418 (-0%) | 1mo | $349,990 | $247 | 80 |
| 2817 Georgia Aster Way NW #48 | 0.28mi | 3/2.5 | 1,418 (-0%) | 2mo | $348,990 | $246 | 79 |
Match score weights: distance 35% · size 25% · config 20% · recency 20%. Top-matched comps best support the ARV.
Projected returns pro-forma
-3.0% appreciation · 3.26% rent growth · sell at horizon
- IRR
- -27.4%
- Equity multiple
- 0.08×
- Total profit
- $-90,075
- Equity at exit
- $52,085
- IRR
- -24.9%
- Equity multiple
- -0.23×
- Total profit
- $-120,335
- Equity at exit
- $30,203
Cash invested: $97,810 (down + closing). Projections, not guarantees.
Landlord ↔ Tenant lean methodology
- Overall (STATE)
- 90 Strongly Landlord-Friendly
- State Georgia
- 90 Strongly Landlord-Friendly · R+3
- County
- — inherits STATE
- City
- — inherits STATE
ZIP-level market 30318
- Rents YoY
- 3.3%
- Active inventory
- 732
- Price-to-rent
- 10.3×
Monthly cashflow live
- Estimated rent
- $2,067 high interval (Pro) →
- Mortgage (P&I)
- −$1,832
- Tax from tax record
- −$187 /mo · $2,247/yr
- Insurance
- −$146
- HOA
- −$0
- Vacancy / Maint / Mgmt
- −$434
- Net cashflow
- $-532
Break-even live
Sensitivity live
| Price | -10% $-334 | -5% $-433 | +0% $-532 | +5% $-631 | +10% $-730 |
|---|---|---|---|---|---|
| Rent | -10% $-695 | -5% $-614 | +0% $-532 | +5% $-450 | +10% $-369 |
| Rate | -1.0pp $-356 | -0.5pp $-443 | base $-532 | +0.5pp $-623 | +1.0pp $-715 |
UW: 25.0% down · 7.5% · 30yr · 1.5% tax · 5.0% vac · 8.0% maint · 8.0% mgmt
Financing live
Cash to close
- Down payment
- $87,330
- Closing costs
- $10,480
- Reserves months
- —
- Total cash needed
- —
Loan-product check · same deal, 3 products live
Conventional
25% down · 7.5% · 30yr
- Down + closing
- —
- Monthly P&I
- —
- Monthly cashflow
- —
- DSCR
- —
- Eligible?
- —
Personal DTI + credit; lowest rate.
DSCR
20% down · 8.5% · 30yr
- Down + closing
- —
- Monthly P&I
- —
- Monthly cashflow
- —
- DSCR
- —
- Eligible?
- —
No personal income docs; deal must DSCR.
Hard money
10% down · 12.0% · 12mo
- Down + closing
- —
- Monthly P&I
- —
- Monthly cashflow
- —
- DSCR
- —
- Eligible?
- —
Short-term bridge; refi at stabilization.
Rent comps 40 comps
| Address | Beds | Baths | Sqft | Rent | $/sqft | DOM | Units | Dist |
|---|---|---|---|---|---|---|---|---|
| 530 James P Brawley Dr NW Atlanta, GA | 2.0 | 2.0 | 1600 | $1,375 | $0.86 | 26d | 1 | 0.11mi |
| 481 Griffin St NW Atlanta, GA | 2.0 | 2.0 | 1080 | $2,000 | $1.85 | 19d | 1 | 0.17mi |
| 564 Joseph E Lowery Blvd NW Atlanta, GA | 2.0 | 1.0 | 980 | $1,100 | $1.12 | 26d | 1 | 0.27mi |
| 564 Joseph E. Lowery Blvd NW Unit 3 Atlanta, GA | 2.0 | 1.0 | 980 | $1,100 | $1.12 | 26d | 1 | 0.27mi |
| 590 Joseph E Lowery Blvd NW Atlanta, GA | 2.0 | 1.0 | 980 | $1,100 | $1.12 | 26d | 1 | 0.29mi |
| 882 Fox St NW Atlanta, GA | 2.0 | 1.0 | 980 | $1,350 | $1.38 | 26d | 1 | 0.29mi |
| 865 Fox St NW Atlanta, GA | 2.0 | 1.0 | 980 | $1,200 | $1.22 | 26d | 1 | 0.32mi |
| 435 Elm St NW Unit Elm B Atlanta, GA | 2.0 | 2.0 | 1200 | $2,350 | $1.96 | 5d | 1 | 0.33mi |
| 396 Elm St NW Atlanta, GA | 3.0 | 2.0 | 1792 | $2,100 | $1.17 | 26d | 1 | 0.34mi |
| 935 Pelham St NW Atlanta, GA | 4.0 | 3.0 | 1540 | $3,500 | $2.27 | 20d | 1 | 0.34mi |
| 679 Jones Ave NW Atlanta, GA | 3.0 | 2.0 | 1350 | $2,195 | $1.63 | 26d | 1 | 0.35mi |
| 891 Rock St NW Atlanta, GA | 2.0–3.0 | 2.0 | 1104 | $1,491 | $1.35 | 26d | 4 | 0.40mi |
| 272 Joseph E Lowery Blvd NW Atlanta, GA | 3.0 | 1.0 | 1230 | $1,800 | $1.46 | 26d | 1 | 0.45mi |
| 750 Echo St NW Atlanta, GA | 2.0 | 1.0–2.0 | 1054 | $3,310 | $3.14 | 0d | 19 | 0.47mi |
| 576 Northside Dr NW Atlanta, GA | 3.0 | 1.0–2.0 | 933 | $3,700 | $3.97 | 0d | 156 | 0.51mi |
| 370 Northside Dr NW Atlanta, GA | 1.0–3.0 | 1.0–2.0 | 981 | $2,025 | $2.06 | 1d | 25 | 0.55mi |
| 527 Herndon Square Ave Atlanta, GA | 1.0–3.0 | 1.0–2.0 | 883 | $3,050 | $3.45 | 24d | 1 | 0.59mi |
| 527 Herndon Square Ave Atlanta, GA | 1.0–3.0 | 1.0–2.0 | 855 | $1,633 | $1.91 | 4d | 1 | 0.59mi |
| 962 Bibb St NW #7 Atlanta, GA | 2.0 | 2.0 | 921 | $2,600 | $2.82 | 26d | 1 | 0.59mi |
| 200 Nerem St NW Atlanta, GA | 2.0 | 1.0–2.0 | 932 | $3,228 | $3.46 | 1d | 31 | 0.68mi |
| 1005 Westmoor Dr NW Unit A Atlanta, GA | 4.0 | 2.0 | 1348 | $1,695 | $1.26 | 26d | 1 | 0.68mi |
| 936 Mayson Turner Rd NW Atlanta, GA | 3.0 | 1.0–2.0 | 648 | $1,374 | $2.12 | 0d | 13 | 0.71mi |
| 935 Marietta St NW Atlanta, GA | 2.0 | 1.0–2.0 | 910 | $2,070 | $2.27 | 0d | 27 | 0.74mi |
| 800 W Marietta St NW Atlanta, GA | 2.0–4.0 | 2.0–4.0 | 1180 | $959 | $0.81 | 17d | 21 | 0.75mi |
| 60 Paschal Blvd NW Atlanta, GA | 1.0–3.0 | 1.0–2.5 | 945 | $1,625 | $1.72 | 26d | 25 | 0.78mi |
| 1064 Westmoor Dr NW Atlanta, GA | 3.0 | 3.0 | 1770 | $2,300 | $1.30 | 26d | 1 | 0.78mi |
| 75 Griffin St NW Atlanta, GA | 2.0 | 1.0 | 1000 | $1,600 | $1.60 | 26d | 1 | 0.79mi |
| 871 3rd St NW Atlanta, GA | 1.0–2.0 | 1.0–2.0 | 990 | $2,652 | $2.68 | 1d | 21 | 0.82mi |
| 1004 Desoto St NW Atlanta, GA | 3.0 | 2.0 | 1550 | $1,995 | $1.29 | 26d | 1 | 0.83mi |
| 870 Mayson Turner Rd NW #1442 Atlanta, GA | 2.0 | 2.0 | 1094 | $2,100 | $1.92 | 26d | 1 | 0.84mi |
| 900 Joseph E Lowery Blvd NW Atlanta, GA | 2.0 | 1.0–2.0 | 911 | $2,276 | $2.50 | 1d | 21 | 0.85mi |
| 930 Howell Mill Rd NW Atlanta, GA | 2.0 | 1.0–2.0 | 885 | $3,548 | $4.01 | 23d | 6 | 0.86mi |
| 820 W Marietta St NW Atlanta, GA | 1.0–2.0 | 1.0–2.0 | 900 | $2,460 | $2.73 | 1d | 27 | 0.88mi |
| 980 Howell Mill Rd NW Atlanta, GA | 2.0 | 1.0–2.0 | 944 | $2,385 | $2.53 | 0d | 27 | 0.92mi |
| 15 Ollie St NW Atlanta, GA | 3.0 | 2.5 | 1594 | $3,150 | $1.98 | 26d | 1 | 0.97mi |
| 1016 Howell Mill Rd Unit 1108 Atlanta, GA | 2.0 | 2.0 | 1367 | $1,925 | $1.41 | 26d | 1 | 0.97mi |
| 884 T P Burruss SR Dr SW Atlanta, GA | 3.0 | 2.0 | 1366 | $2,299 | $1.68 | 26d | 1 | 0.98mi |
| 1000 Northside Dr NW Atlanta, GA | 1.0–3.0 | 1.0–2.0 | 1081 | $2,844 | $2.63 | 0d | 61 | 1.00mi |
| 55 Maple St NW Atlanta, GA | 1.0–3.0 | 1.0–2.0 | 862 | $2,170 | $2.52 | 6d | 35 | 1.03mi |
| 660 11th St NW Atlanta, GA | 2.0 | 1.0–2.0 | 1001 | $6,286 | $6.28 | 1d | 96 | 1.05mi |
Listing history 11 events
-
2026-06-21days on market $254,900 Active 15 DOM
-
2026-06-18days on market $254,900 Active 12 DOM
-
2026-06-17days on market $254,900 Active 11 DOM
-
2026-06-16days on market $254,900 Active 10 DOM
-
2026-06-15days on market $254,900 Active 9 DOM
-
2026-06-13days on market $254,900 Active 7 DOM
-
2026-06-13days on market $254,900 Active 6 DOM
-
2026-06-09days on market $254,900 Active 3 DOM
-
2026-06-08days on market $254,900 Active 2 DOM
-
2026-06-07remarks 699-char remark
-
2026-06-07$254,900 Active 1 DOM
ⓘ Source: listings_history table (triggers on properties + properties_extension) + one-shot
backfill from property_details.listing_events for pre-trigger history.
Tax reassessment forecast GA · Resets to sale price
- Current annual tax
- $2,247 · $187/mo
- Projected year-2 tax
- $2,345 · $195/mo
- Expected delta
- +$98/yr (+$8/mo · 4.4%)
ⓘ Screening estimate from a state-policy table — verify with the county assessor before closing.
Climate risk First Street
- Flood 1/10 Low FEMA zone X (unshaded) · 0% chance over 30 yrs
- Wildfire 1/10 Low
- Heat 5/10 Major 6 d/yr ≥103°F today · 16 d/yr by 30 yrs out
- Wind 5/10 Major 25% chance of damaging wind over 30 yrs
- Air quality 4/10 Moderate 5 unhealthy d/yr today · 7 by 30 yrs out
Nearby sold comps map
Loading sold comps map…
Walkable amenities ~0.75 mi
Loading nearby amenities…
Taxation est. · year 1
- Rental income
- $24,798
- − Mortgage interest
- −$19,567
- − Property taxes
- −$2,247
- − Insurance
- −$1,747
- − Repairs & maintenance
- −$1,984
- − Management
- −$1,984
- − Depreciation
- −$10,162
- Taxable loss
- −$12,892
- Est. tax savings @ 24.0%
- +$3,094
- After-tax cash flow
- $-3,291/yr
For passive investors: Depreciation is non-cash, so a rental often shows a tax loss while cash-flowing — sheltering income. Rental losses are passive: they offset passive income freely, and up to $25,000/yr can offset ordinary (W-2) income if you actively participate and your MAGI is under $100k (phasing out to $0 by $150k); unused losses carry forward. On sale, claimed depreciation is recaptured at up to 25%, and gains may owe capital-gains tax (a 1031 exchange can defer both). Figures are a year-1 estimate at your 24.0% rate — not tax advice; consult a CPA.
Schools (NCES district)
- District
- Atlanta Public Schools
- NCES district ID
- 1300120
- Math proficiency
- 28% ▼ -6.00%
- Reading proficiency
- 35% ▼ -2.00%
- Median HH income
- $48,306
- Composite
- 27.27/100
- National rank
- #7006
- State rank
- #80 of 174 in GA
Livability — Atlanta
- Score
- 83/100
- State rank
- #6
- US rank
- #919
Category grades
Schools grade is shown separately in the Schools card above.
Census & demographics
- Census place
- Atlanta, GA
- County
- Fulton County · 1,094,430 people
- City population
- 629,525
- Metro
- Atlanta-Sandy Springs-Alpharetta, GA
- Population (ZIP)
- 59,609
- Household income
- $83,116
- Rent vs Own
- Severe rent burden
- 4182.0
Population outlook (Fulton County) Hauer SSP2
- Today (2025)
- 1,203,707 people
- By 2030
- 1,299,706 · +8.0%
- By 2040
- 1,488,256 · +23.6%
- By 2050
- 1,664,580 · +38.3%
- By 2075
- 2,036,072 · +69.2%
- By 2100
- 2,222,402 · +84.6%
Race, ethnicity, and origin ACS 2023
- Neighborhood character
- Diverse neighborhood (Simpson 0.63)
- Race & ethnicity
- Black 49% White 35% Hispanic / Latino 7% Two or more races 6% Asian 5%
- Hispanic origin (detail)
- Mexican 2% Puerto Rican 1%
- Common ancestry
- Lithuanian 2% Slovak 2% Romanian 1%
- Foreign-born
- 8% · Canada, China, South Korea
- Languages at home
- 88% English-only · Spanish 4% Other Indo-European 2% Other Asian/Pacific 1%
Political lean MEDSL · Fulton
- 2024 margin
- Solid D (+44.9) · D 71.9% · R 27.0% · Other 1.1%
- 2008→2024 swing
- +9.8pp toward D · 2008: 35.0pp · 2024: 44.9pp
- All cycles
- 2024: D+44.9 2020: D+46.4 2016: D+42.1 2012: D+29.6 2008: D+35.0
Not yet ingested
- Civics
- —
Market trends
- HPI YoY
- ▼ -470.82%
- Current HPI
- 224.1493
- Rent YoY
- ▲ 3.26%
- Metro
- Atlanta-Sandy Springs-Alpharetta, GA
- State GDP YoY
- ▲ 2.66%
- F500 in state
- 28
Industry mix (Fortune 500 HQ in GA)
| Industry | F500 HQs | Revenue |
|---|---|---|
| Paper / Packaging | 2 | $29B |
|
||
| Retail | 1 | $160B |
|
||
| Transportation / Logistics | 1 | $91B |
|
||
| Airlines | 1 | $62B |
|
||
| Consumer Goods | 1 | $47B |
|
||
| Utilities | 1 | $25B |
|
||
Price history
+8.5% since first listed10 events — show timeline
- 2026-06-06 Listed $254,900 GAMLS
- 2026-06-06 Listed $254,900 FMLS
- 2025-03-14 Sold (Public Records) $75,000 Public Records
- 2024-07-31 Listing Removed — GAMLS
- 2024-07-22 Contingent — GAMLS
- 2024-04-07 Price Changed $87,900 GAMLS
- 2023-07-06 Price Changed $185,900 GAMLS
- 2023-06-02 Relisted — GAMLS
- 2023-04-21 Pending — GAMLS
- 2022-08-02 Listed $235,000 GAMLS
Property tax history
+7.6%/yrLatest (2025): $2,247 · +5.3% YoY. Source: county tax records.
Cash-flow waterfall
monthlySold comps — $/sqft
last 12 mo · ≤1 miLoading sold comps…