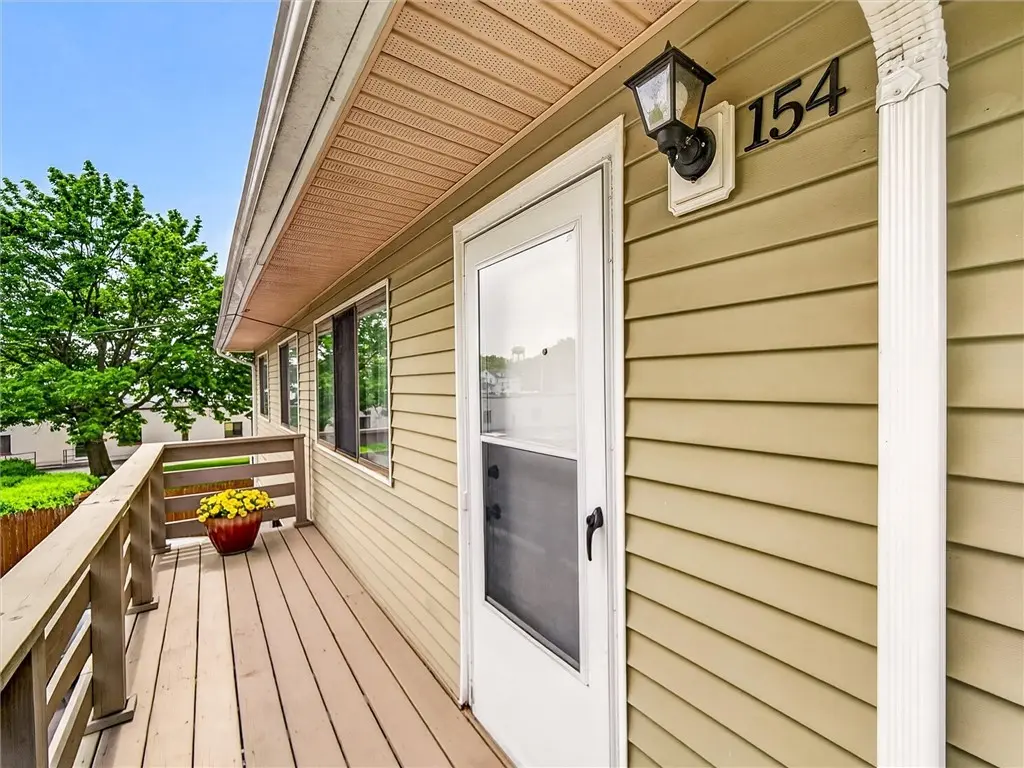
154 Milrace Dr · East Rochester, NY
Flood risk 1/10 · Minimal
- FEMA flood zone
- X (unshaded)
- Chance of flooding over 30 yrs
- 0.0%
- Est. flood insurance / yr
- $507 – $1,088
Fire risk 3/10 · Minor
- Est. fire insurance / yr
- $691 – $1,283
Heat risk 2/10 · Minimal
- Hot days now (above 95°F)
- 7 days/yr
- Hot days in 30 yrs
- 16 days/yr
Wind risk 1/10 · Minimal
- Chance of severe wind over 30 yrs
- —
Air-quality risk 2/10 · Minimal
- Unhealthy air days now
- 1 days/yr
- Unhealthy air days in 30 yrs
- 2 days/yr
Risk factors via First Street. Map © Google.
Why this score? — see what drove the D grade
The composite is a weighted blend of 9 inputs, each scored 0–100. Each bar is that input's sub-score; the figure is the points it added to the 100-point composite (weight × sub-score).
- Cash flow +11.3/30.0
- ARV discount +11.2/15.0
- 1% rule +5.0/10.0
- Schools +4.3/10.0
- Livability +3.9/5.0
- DSCR +3.3/10.0
- Rent growth +2.5/5.0
- Condition / age +2.5/5.0
- Appreciation +0.0/10.0
$159,900
🖨 Deal sheet (PDF) 📄 Offer letter ✓ Due diligence
Listing remarks
Welcome to this STUNNING, FULLY RENOVATED 2-bedroom, 1-bath condo/townhome in the charming Linden East community. LOW-MAINTENANCE LIVING IN WALKABLE EAST ROCHESTER VILLAGE! This move-in-ready home, filled with NATURAL LIGHT features a BRAND NEW KITCHEN (2026) with plenty of cabinets, breakfast bar & new refrigerator, a beautifully UPDATED BATHROOM, all new hardwood-laminate flooring, STACKABLE WASHER & DRYER and NEW LIGHTING throughout. The OPEN-CONCEPT LAYOUT connects the kitchen, dining, and family room areas. 1-STORY (2nd floor) END-UNIT with a private deck, DESIGNATED GARAGE SPACE (shared) and private storage unit! Linden East Community provides easy access to shops, restaur
Key facts
- Fully renovated
- New kitchen
- Updated bathroom
Tags
Property features AI
Finance
- Financial info: Pets allowed: cats and dogs (limits may apply)
- HOA & community: Kenrick association with a monthly fee of $270 covering common area maintenance, common area insurance, insurance, structure maintenance, reserve fund, sewer, snow removal, trash, and water
Exterior
- Parking: Attached garage with one assigned underground parking space and garage door opener
- Utilities: Public water connected; Sewer connected; Electricity available with circuit breakers; Cable available; High-speed internet available
- Home design: Single-story property; Existing/resale condition
- Construction: Vinyl siding; Copper plumbing; Asphalt shingle roof
- Exterior features: Deck; Near public transit; Rectangular residential lot; City street frontage
Interior
- Kitchen: Electric oven; Electric range; Microwave; Garbage disposal; Refrigerator; Eat-in kitchen and breakfast bar
- Bedrooms: Total rooms: 4 (includes living room)
- Flooring: Hardwood; Laminate; Luxury vinyl; Varied flooring
- Bathrooms: 1 full bathroom
- Heating & cooling: Gas forced-air heating; Central air conditioning
- Interior features: Breakfast bar; Separate/formal dining room; Eat-in kitchen; Separate/formal living room; Open living/dining area; Window treatments; Drapes; Thermal windows
- Laundry & utility: In-unit washer and dryer; Electric water heater
Neighborhood map
What this means for you Summary
Snapshot
- This is a 2-bed/1.0-bath single-family listed at $160k.
Deal economics
- At list price, monthly cash flow is $-57 ($-685/yr) — negative.
- To cash-flow at today's rent, offer at most $150k (6.3% below list).
- Meets the 1% rule at list price ($2k rent vs $160k).
- Recommended offer: $150k (6.3% below list) — sets the bar for cash-flow.
- Cap rate 5.9% vs local median 4.5% in East Rochester — top-decile yield for the area; either an underpriced asset or a hidden risk that comps aren't pricing in. Stress-test before assuming the spread holds.
Location & tenants
- Location reads 78/100 on livability (#155 in NY, #2,400 nationally) — a middle-class / working-renter tenant base. Strengths: amenities A+, cost of living A+, housing A+; Watch: employment D+, crime D.
- East Rochester Union Free School District (suburban): math 50% / reading 51% proficiency, ranked #371 of 590 in NY (top 63%) — acceptable for families but not a draw, mixed tenant base, ~2y average lease.
- Market conditions: 34 active listings in the ZIP; 6 comparable units currently listed for rent nearby; rentals at typical pace (median 20d on market — plan ~3-4 weeks tenant-placement turnaround); 1,169 units permitted in Monroe County in 2024 (591 in 5+ unit buildings).
Forward outlook
- Local home prices are declining (-3.0%/yr); year-one equity from $1k of loan paydown is wiped out by about $5k of value loss. Plan a longer hold.
- Monroe County population projected to shrink 6% by 2050 — rents likely to lag national; underwrite the cash flow, not the appreciation.
Negotiation context
- Only 10 days on market — expect competitive offers; lowballing is unlikely to land.
Questions for the listing agent
- What do current leases actually rent for vs. the listed asking? Can we see a recent rent roll and the last 12 months of T-12 income?
- Built in 1972 — when were the roof, HVAC, electrical panel, plumbing, and water heater last replaced?
- What does the HOA fee cover, when was the last increase, and are there any pending special assessments or reserve-fund shortfalls?
- Is there a deadline driving the sale (1031 exchange, divorce, estate, relocation)? That informs how much negotiation room exists.
- Schools are A-rated — typically a magnet for longer-tenancy family renters. What's the average tenant stay here, and is there a school-zone premium baked into asking?
- Crime grade is D in this area — have there been break-ins, vandalism, or insurance claims at this property in the last 3 years? What carrier currently insures it and at what premium?
- The area grade is low — what's the realistic commute time and amenity access for the typical tenant pool here? Any planned neighborhood developments (good or bad) we should know about?
- What's the average days-on-market for RENTAL listings here right now (not sales)? A rising rental-DOM trend means longer vacancies and softer asking-rent achievability than the comps imply.
- What's the recent tenant-quality profile in this submarket — average credit score on applications, eviction rate, late-payment / NSF rate, and stable-employment percentage? A property-management company in the area should have these aggregated.
- How much new for-sale + rental construction is in the pipeline within 1–3 miles? Heavy new supply typically softens prices + rents 12–24 months out; constrained supply supports both.
Investment metrics
- 1% rule
- 1.00% ✓
- Cap rate
- 5.86%
- Cash-on-cash
- -1.53%
- DSCR
- 0.93
- GRM
- 8.3
CMA / ARV
- ARV (on-the-fly)
- $174,276
- Comps found
- 11
Show comp detail 11 sales within ~0.75 mi
| Address | Dist | Beds/Ba | Sqft | Sold | Price | $/sf | Match |
|---|---|---|---|---|---|---|---|
| 11 Apple St | 0.24mi | 2/1.0 | 888 (-4%) | 12mo | $165,000 | $186 | 72 |
| 413 Garfield Ave | 0.30mi | 2/1.5 | 960 (+4%) | 14mo | $195,000 | $203 | 67 |
| 121 W Filbert St | 0.64mi | 2/1.5 | 876 (-6%) | 0mo | $165,000 | $188 | 59 |
| 2 Upper Cres | 0.73mi | 3/1.0 (+1) | 940 (+1%) | 6mo | $185,000 | $197 | 54 |
| 318 Magnolia Ave | 0.17mi | 2/1.5 | 1,060 (+14%) | 21mo | $228,000 | $215 | 49 |
| — | 0.29mi | 3/1.5 (+1) | 1,032 (+11%) | 20mo | $145,000 | $141 | 44 |
| 4 Woodneath Cres | 0.71mi | 2/1.0 | 800 (-14%) | 5mo | $150,000 | $188 | 40 |
| 604 Grant St | 0.73mi | 3/1.0 (+1) | 832 (-10%) | 9mo | $80,000 | $96 | 37 |
| 116 W Elm St | 0.55mi | 3/1.0 (+1) | 1,062 (+15%) | 12mo | $218,000 | $205 | 35 |
| 403 W Elm St | 0.63mi | 3/1.5 (+1) | 1,056 (+14%) | 24mo | $241,000 | $228 | 21 |
| 2 Forest Rd | 0.74mi | 3/1.5 (+1) | 800 (-14%) | 22mo | $145,000 | $181 | 17 |
Match score weights: distance 35% · size 25% · config 20% · recency 20%. Top-matched comps best support the ARV.
Projected returns pro-forma
-3.0% appreciation · 3.0% rent growth · sell at horizon
- IRR
- -18.7%
- Equity multiple
- 0.34×
- Total profit
- $-29,389
- Equity at exit
- $23,842
- IRR
- -10.9%
- Equity multiple
- 0.34×
- Total profit
- $-29,629
- Equity at exit
- $13,825
Cash invested: $44,772 (down + closing). Projections, not guarantees.
Landlord ↔ Tenant lean methodology
- Overall (STATE)
- 15 Strongly Tenant-Friendly
- State New York
- 15 Strongly Tenant-Friendly · D+10
- County
- — inherits STATE
- City
- — inherits STATE
ZIP-level market 14445
- Home prices YoY
- -9.5%
- Active inventory
- 34
- Price-to-rent
- 8.3×
Monthly cashflow live
- Estimated rent
- $1,605 high interval (Pro) →
- Mortgage (P&I)
- −$839
- Tax from tax record
- −$150 /mo · $1,797/yr
- Insurance
- −$67
- HOA
- −$270
- Vacancy / Maint / Mgmt
- −$337
- Net cashflow
- $-57
Break-even live
Sensitivity live
| Price | -10% $33 | -5% $-12 | +0% $-57 | +5% $-102 | +10% $-148 |
|---|---|---|---|---|---|
| Rent | -10% $-184 | -5% $-121 | +0% $-57 | +5% $6 | +10% $70 |
| Rate | -1.0pp $23 | -0.5pp $-16 | base $-57 | +0.5pp $-99 | +1.0pp $-141 |
UW: 25.0% down · 7.5% · 30yr · 1.5% tax · 5.0% vac · 8.0% maint · 8.0% mgmt
Financing live
Cash to close
- Down payment
- $39,975
- Closing costs
- $4,797
- Reserves months
- —
- Total cash needed
- —
Loan-product check · same deal, 3 products live
Conventional
25% down · 7.5% · 30yr
- Down + closing
- —
- Monthly P&I
- —
- Monthly cashflow
- —
- DSCR
- —
- Eligible?
- —
Personal DTI + credit; lowest rate.
DSCR
20% down · 8.5% · 30yr
- Down + closing
- —
- Monthly P&I
- —
- Monthly cashflow
- —
- DSCR
- —
- Eligible?
- —
No personal income docs; deal must DSCR.
Hard money
10% down · 12.0% · 12mo
- Down + closing
- —
- Monthly P&I
- —
- Monthly cashflow
- —
- DSCR
- —
- Eligible?
- —
Short-term bridge; refi at stabilization.
Rent comps 6 comps
| Address | Beds | Baths | Sqft | Rent | $/sqft | DOM | Units | Dist |
|---|---|---|---|---|---|---|---|---|
| 234 W Commercial St Unit 2 East Rochester, NY | 2.0 | 1.0 | 640 | $1,100 | $1.72 | 44d | 1 | 0.48mi |
| 126 West Ave Unit UPPER East Rochester, NY | 2.0 | 1.0 | 820 | $1,500 | $1.83 | 19d | 1 | 0.59mi |
| 120 Brebeuf Dr Penfield, NY | 2.0 | 1.0 | 763 | $1,365 | $1.79 | 4d | 6 | 0.59mi |
| 108 W Filbert St Unit 2 East Rochester, NY | 2.0 | 1.0 | 1100 | $1,525 | $1.39 | 3d | 1 | 0.65mi |
| 214 E Spruce St East Rochester, NY | 3.0 | 1.0 | 972 | $1,750 | $1.80 | 44d | 1 | 0.81mi |
| 18 Brook Hill Ln Rochester, NY | 1.0–2.0 | 1.0–1.5 | 841 | $1,915 | $2.28 | 3d | 1 | 1.36mi |
HOA detail
- Monthly dues
- $270 · $3,240/yr
Listing history 3 events
-
2026-06-01status $159,900 Pending 10 DOM
-
2026-05-31days on market $159,900 Active 10 DOM
-
2026-05-21$159,900 Active
ⓘ Source: listings_history table (triggers on properties + properties_extension) + one-shot
backfill from property_details.listing_events for pre-trigger history.
Tax reassessment forecast NY · Partial reset (capped growth)
- Current annual tax
- $1,797 · $150/mo
- Projected year-2 tax
- $2,250 · $187/mo
- Expected delta
- +$453/yr (+$38/mo · 25.2%)
ⓘ Screening estimate from a state-policy table — verify with the county assessor before closing.
Climate risk First Street
- Flood 1/10 Low FEMA zone X (unshaded) · 0% chance over 30 yrs
- Wildfire 3/10 Moderate
- Heat 2/10 Low 7 d/yr ≥95°F today · 16 d/yr by 30 yrs out
- Wind 1/10 Low
- Air quality 2/10 Low 1 unhealthy d/yr today · 2 by 30 yrs out
Nearby sold comps map
Loading sold comps map…
Walkable amenities ~0.75 mi
Loading nearby amenities…
Taxation est. · year 1
- Rental income
- $19,258
- − Mortgage interest
- −$8,957
- − Property taxes
- −$1,797
- − Insurance
- −$800
- − Repairs & maintenance
- −$1,541
- − Management
- −$1,541
- − HOA
- −$3,240
- − Depreciation
- −$4,652
- Taxable loss
- −$3,269
- Est. tax savings @ 24.0%
- +$784
- After-tax cash flow
- $99/yr
For passive investors: Depreciation is non-cash, so a rental often shows a tax loss while cash-flowing — sheltering income. Rental losses are passive: they offset passive income freely, and up to $25,000/yr can offset ordinary (W-2) income if you actively participate and your MAGI is under $100k (phasing out to $0 by $150k); unused losses carry forward. On sale, claimed depreciation is recaptured at up to 25%, and gains may owe capital-gains tax (a 1031 exchange can defer both). Figures are a year-1 estimate at your 24.0% rate — not tax advice; consult a CPA.
Schools (NCES district)
- District
- East Rochester Union Free School District
- NCES district ID
- 3609930
- Math proficiency
- 50% ▼ -16.00%
- Reading proficiency
- 51% ▲ 5.00%
- Median HH income
- $50,308
- Composite
- 43.23/100
- National rank
- #3058
- State rank
- #371 of 590 in NY
Livability — East Rochester
- Score
- 78/100
- State rank
- #155
- US rank
- #2400
Category grades
Schools grade is shown separately in the Schools card above.
Census & demographics
- County
- Monroe County · 674,131 people
- City population
- 7,529
- Metro
- Rochester, NY
- Population (ZIP)
- 7,529
- Household income
- $73,625
- Rent vs Own
- Severe rent burden
- 216.0
Population outlook (Monroe County) Hauer SSP2
- Today (2025)
- 759,460 people
- By 2030
- 757,154 · -0.3%
- By 2040
- 740,644 · -2.5%
- By 2050
- 714,443 · -5.9%
- By 2075
- 645,883 · -15.0%
- By 2100
- 547,084 · -28.0%
Race, ethnicity, and origin ACS 2023
- Neighborhood character
- Predominantly White (88%)
- Race & ethnicity
- White 88% Hispanic / Latino 6% Black 3% Two or more races 3%
- Hispanic origin (detail)
- Puerto Rican 3%
- Common ancestry
- Romanian 4% Portuguese 2% Lithuanian 2%
- Foreign-born
- 4% · Canada
- Languages at home
- 96% English-only · Spanish 2% Other Indo-European 1% Tagalog/Filipino 1%
Political lean MEDSL · Monroe
- 2024 margin
- D (+19.1) · D 59.5% · R 40.5%
- 2008→2024 swing
- +1.4pp toward D · 2008: 17.7pp · 2024: 19.1pp
- All cycles
- 2024: D+19.1 2020: D+21.0 2016: D+14.1 2012: D+17.4 2008: D+17.7
Not yet ingested
- Civics
- —
Market trends
- HPI YoY
- ▼ -28.80%
- Current HPI
- 273.7033
- Rent YoY
- —
- Metro
- Rochester, NY
- State GDP YoY
- ▲ 2.60%
- F500 in state
- 92
Industry mix (Fortune 500 HQ in NY)
| Industry | F500 HQs | Revenue |
|---|---|---|
| Financial Services | 10 | $950B |
|
||
| Consumer Goods | 9 | $162B |
|
||
| Insurance | 4 | $225B |
|
||
| Telecommunications | 2 | $144B |
|
||
| Pharmaceuticals | 2 | $112B |
|
||
| Media / Entertainment | 2 | $69B |
|
||
Price history
1 event — show timeline
- 2026-05-21 Listed $159,900 UNYREIS
Property tax history
-3.0%/yrLatest (2025): $1,797 · +1.6% YoY. Source: county tax records.
Cash-flow waterfall
monthlySold comps — $/sqft
last 12 mo · ≤1 miLoading sold comps…