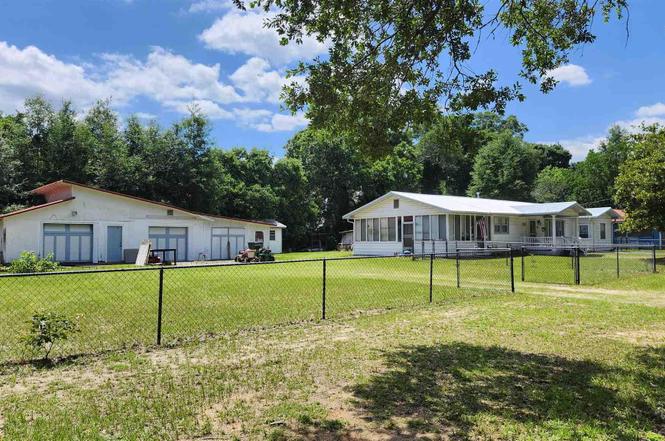
6801 Vivian Dr · Brent, FL
Flood risk 1/10 · Minimal
- FEMA flood zone
- X (unshaded)
- Chance of flooding over 30 yrs
- 0.0%
- Est. flood insurance / yr
- $507 – $1,088
Fire risk 1/10 · Minimal
- Est. fire insurance / yr
- $947 – $1,759
Heat risk 10/10 · Severe
- Hot days now (above 106°F)
- 6 days/yr
- Hot days in 30 yrs
- 18 days/yr
Wind risk 9/10 · Severe
- Chance of severe wind over 30 yrs
- 99.0%
Air-quality risk 1/10 · Minimal
- Unhealthy air days now
- 0 days/yr
- Unhealthy air days in 30 yrs
- 0 days/yr
Risk factors via First Street. Map © Google.
Why this score? — see what drove the D- grade
The composite is a weighted blend of 9 inputs, each scored 0–100. Each bar is that input's sub-score; the figure is the points it added to the 100-point composite (weight × sub-score).
- ARV discount +12.0/15.0
- Cash flow +9.8/30.0
- Rent growth +3.7/5.0
- Schools +3.6/10.0
- Livability +3.5/5.0
- DSCR +2.8/10.0
- Condition / age +2.5/5.0
- 1% rule +2.1/10.0
- Appreciation +0.0/10.0
$230,000
🖨 Deal sheet (PDF) 📄 Offer letter ✓ Due diligence
Listing remarks
A hidden gem which allows you to feel like your in the country, but has every ammenity you need within 5 minutes. Just off of US 29, centrally located to I-10. 6801 Vivian Drive is an awsome opportunity for someone who owns there own business and needs space. Or a family that is looking for a place where there kids can play outside in the fully fenced in yard or ride there bikes out on the street safely. This gem is situated on over a half an acre of land and is fully fenced with a front porch. The home has 3 bedrooms, 1 bath, living room with a fireplace, an eat-in-kitchen, formal dinning room and a den. With 2100 square feet of heated space and another 473 square feet attached to the home
Key facts
- Fully fenced
- Newer laminate
- Centrally located
Tags
Property features AI
Finance
- Other: Insulation listed as a green energy efficiency feature; Property includes both public sewer and septic connections
- HOA & community: No homeowners association
Exterior
- Parking: Detached oversized 3-car garage; RV/boat access and parking available; Covered parking for 3 vehicles (total 3 parking spaces)
- Security: Smoke detector(s)
- Utilities: Circuit breaker electrical service; Public sewer and septic tank options
- Home design: Single-story home; Resale property; Detached (not attached to other properties); Interior and exterior accessibility provisions
- Construction: Frame construction; Slab foundation; Approximately 2,100 square feet of building area
- Exterior features: Full chain-link fencing; Metal roof; Greenhouse and yard building on the property; Paved, county-maintained road access; Central access lot feature
Interior
- Kitchen: Remodeled kitchen with pantry; Updated cabinets and flooring; Gas stove; Built-in microwave; Refrigerator; Dishwasher (ENERGY STAR qualified)
- Bedrooms: Master bedroom on the first floor (approximately 11' x 12'); Two additional first-floor bedrooms (about 10' x 10' and 10' x 11.4')
- Flooring: Tile flooring; Carpet
- Bathrooms: One full bathroom
- Heating & cooling: Central air conditioning; Ceiling fans for cooling; Natural gas heating
- Interior features: Ceiling fans; Bonus room; Sun room; Storm door(s); Storm windows and blinds
- Laundry & utility: Interior laundry with washer/dryer hookups; Common area laundry available; Electric water heater
Neighborhood map
What this means for you Summary
Snapshot
- This is a 3-bed/1.0-bath single-family listed at $230k.
Deal economics
- At list price, monthly cash flow is $-149 ($-2k/yr) — negative.
- To cash-flow at today's rent, offer at most $204k (11.5% below list).
- To meet the 1% rule (rent ≥ 1% of price), the offer needs to be $164k (28.9% below list).
- Recommended offer: $164k (28.9% below list) — sets the bar for 1% rule.
Location & tenants
- Location reads 69/100 on livability (#484 in FL) — a middle-class / working-renter tenant base. Strengths: cost of living A+, housing A+, health & safety A+; Watch: crime D, amenities F, commute F.
- Escambia (suburban): math 40% / reading 45% proficiency, ranked #56 of 73 in FL (top 77%) — families likely to look elsewhere, expect single-tenant / working-renter base with shorter leases.
- Market conditions: Rents rising fast (+4.9%/yr); 198 active listings in the ZIP; 6 comparable units currently listed for rent nearby; rentals at typical pace (median 24d on market — plan ~3-4 weeks tenant-placement turnaround); lower-income renter base — watch delinquency; 1,479 units permitted in Escambia County in 2024 (0 in 5+ unit buildings).
- This rent runs 44% of the median local income ($45k/yr) — at the standard rent-burdened threshold; future hikes will face affordability resistance.
Forward outlook
- Local home prices are declining (-3.0%/yr); year-one equity from $2k of loan paydown is wiped out by about $7k of value loss. Plan a longer hold.
- Escambia County population projected at +13% by 2050 — modest demand growth; plan on rents tracking national, not racing it.
Negotiation context
- Only 8 days on market — expect competitive offers; lowballing is unlikely to land.
- 2 sale attempts since 15y ago with the ask held roughly flat each time — persistent listings suggest the price (not the market) is what's stuck; bring a comps-based counter.
Risks & watch-outs
- Watch-outs: built in 1958 — expect roof / HVAC / electrical / plumbing capex.
- Climate carrying-cost: severe wind risk, 99% chance of damaging wind over 30y; extreme-heat days projected 6→18/yr by 2055 (HVAC capex compounding) — expect insurance premiums to compound above CPI over the hold.
Questions for the listing agent
- What do current leases actually rent for vs. the listed asking? Can we see a recent rent roll and the last 12 months of T-12 income?
- Built in 1958 — when were the roof, HVAC, electrical panel, plumbing, and water heater last replaced?
- Is there a deadline driving the sale (1031 exchange, divorce, estate, relocation)? That informs how much negotiation room exists.
- Crime grade is D in this area — have there been break-ins, vandalism, or insurance claims at this property in the last 3 years? What carrier currently insures it and at what premium?
- The area grade is low — what's the realistic commute time and amenity access for the typical tenant pool here? Any planned neighborhood developments (good or bad) we should know about?
- What's the average days-on-market for RENTAL listings here right now (not sales)? A rising rental-DOM trend means longer vacancies and softer asking-rent achievability than the comps imply.
- What's the recent tenant-quality profile in this submarket — average credit score on applications, eviction rate, late-payment / NSF rate, and stable-employment percentage? A property-management company in the area should have these aggregated.
- How much new for-sale + rental construction is in the pipeline within 1–3 miles? Heavy new supply typically softens prices + rents 12–24 months out; constrained supply supports both.
Investment metrics
- 1% rule
- 0.71% ✗
- Cap rate
- 5.51%
- Cash-on-cash
- -2.78%
- DSCR
- 0.88
- GRM
- 11.7
CMA / ARV
- ARV (on-the-fly)
- $255,282
- Comps found
- 8
Show comp detail 8 sales within ~0.75 mi
| Address | Dist | Beds/Ba | Sqft | Sold | Price | $/sf | Match |
|---|---|---|---|---|---|---|---|
| 785 Ladner Dr | 0.39mi | 3/2.0 | 1,560 (-4%) | 1mo | $279,000 | $179 | 70 |
| 732 Ladner Dr | 0.51mi | 3/2.0 | 1,628 (+0%) | 13mo | $255,000 | $157 | 61 |
| 733 Ladner Dr | 0.51mi | 3/2.0 | 1,560 (-4%) | 12mo | $250,000 | $160 | 56 |
| 789 Ladner Dr | 0.38mi | 3/2.0 | 1,500 (-8%) | 15mo | $260,000 | $173 | 53 |
| 720 Lambert St | 0.59mi | 4/2.0 (+1) | 1,780 (+10%) | 7mo | $261,000 | $147 | 42 |
| 6617 Hampton Rd | 0.70mi | 4/2.0 (+1) | 1,637 (+1%) | 19mo | $195,000 | $119 | 41 |
| 142 W Burgess Rd | 0.74mi | 3/1.0 | 1,404 (-14%) | 5mo | $156,000 | $111 | 38 |
| 705 Alfonso St | 0.64mi | 4/1.0 (+1) | 1,476 (-9%) | 18mo | $105,000 | $71 | 35 |
Match score weights: distance 35% · size 25% · config 20% · recency 20%. Top-matched comps best support the ARV.
Projected returns pro-forma
-3.0% appreciation · 4.92% rent growth · sell at horizon
- IRR
- -19.1%
- Equity multiple
- 0.32×
- Total profit
- $-43,618
- Equity at exit
- $34,294
- IRR
- -8.5%
- Equity multiple
- 0.43×
- Total profit
- $-36,745
- Equity at exit
- $19,886
Cash invested: $64,400 (down + closing). Projections, not guarantees.
Landlord ↔ Tenant lean methodology
- Overall (STATE)
- 87 Strongly Landlord-Friendly
- State Florida
- 87 Strongly Landlord-Friendly · R+3
- County
- — inherits STATE
- City
- — inherits STATE
ZIP-level market 32505
- Home prices YoY
- -26.5%
- Rents YoY
- 4.9%
- Active inventory
- 198
- Price-to-rent
- 11.7×
Monthly cashflow live
- Estimated rent
- $1,635 high interval (Pro) →
- Mortgage (P&I)
- −$1,206
- Tax from tax record
- −$139 /mo · $1,669/yr
- Insurance
- −$96
- HOA
- −$0
- Vacancy / Maint / Mgmt
- −$343
- Net cashflow
- $-149
Break-even live
Sensitivity live
| Price | -10% $-19 | -5% $-84 | +0% $-149 | +5% $-214 | +10% $-279 |
|---|---|---|---|---|---|
| Rent | -10% $-278 | -5% $-214 | +0% $-149 | +5% $-85 | +10% $-20 |
| Rate | -1.0pp $-33 | -0.5pp $-91 | base $-149 | +0.5pp $-209 | +1.0pp $-269 |
UW: 25.0% down · 7.5% · 30yr · 1.5% tax · 5.0% vac · 8.0% maint · 8.0% mgmt
Financing live
Cash to close
- Down payment
- $57,500
- Closing costs
- $6,900
- Reserves months
- —
- Total cash needed
- —
Loan-product check · same deal, 3 products live
Conventional
25% down · 7.5% · 30yr
- Down + closing
- —
- Monthly P&I
- —
- Monthly cashflow
- —
- DSCR
- —
- Eligible?
- —
Personal DTI + credit; lowest rate.
DSCR
20% down · 8.5% · 30yr
- Down + closing
- —
- Monthly P&I
- —
- Monthly cashflow
- —
- DSCR
- —
- Eligible?
- —
No personal income docs; deal must DSCR.
Hard money
10% down · 12.0% · 12mo
- Down + closing
- —
- Monthly P&I
- —
- Monthly cashflow
- —
- DSCR
- —
- Eligible?
- —
Short-term bridge; refi at stabilization.
Rent comps 6 comps
| Address | Beds | Baths | Sqft | Rent | $/sqft | DOM | Units | Dist |
|---|---|---|---|---|---|---|---|---|
| 6111 Enterprise Dr Pensacola, FL | 1.0–3.0 | 1.0–2.0 | 1224 | $1,688 | $1.38 | 14d | 19 | 0.49mi |
| 6426 Wagner Rd Pensacola, FL | 4.0 | 1.5 | 1296 | $1,300 | $1.00 | 24d | 1 | 0.59mi |
| 27 E Burgess Rd Pensacola, FL | 2.0 | 2.0 | 1100 | $1,124 | $1.02 | 24d | 1 | 0.79mi |
| 1472 Wingfoot Way Pensacola, FL | 3.0 | 2.0 | 1284 | $1,595 | $1.24 | 24d | 1 | 0.83mi |
| 147 Creekview Dr Pensacola, FL | 3.0 | 2.0 | 1188 | $1,700 | $1.43 | 14d | 1 | 1.15mi |
| 118 Czar Ln Pensacola, FL | 4.0 | 2.0 | 1477 | $1,795 | $1.22 | 24d | 1 | 1.27mi |
Listing history 6 events
-
2026-06-18days on market $230,000 Active 8 DOM
-
2026-06-17days on market $230,000 Active 7 DOM
-
2026-06-16days on market $230,000 Active 6 DOM
-
2026-06-15days on market $230,000 Active 5 DOM
-
2026-06-14remarks 699-char remark
-
2026-06-14$230,000 Active 3 DOM
ⓘ Source: listings_history table (triggers on properties + properties_extension) + one-shot
backfill from property_details.listing_events for pre-trigger history.
Tax reassessment forecast FL · Resets to sale price
- Current annual tax
- $1,669 · $139/mo
- Projected year-2 tax
- $1,909 · $159/mo
- Expected delta
- +$240/yr (+$20/mo · 14.4%)
ⓘ Screening estimate from a state-policy table — verify with the county assessor before closing.
Climate risk First Street
- Flood 1/10 Low FEMA zone X (unshaded) · 0% chance over 30 yrs
- Wildfire 1/10 Low
- Heat 10/10 Extreme 6 d/yr ≥106°F today · 18 d/yr by 30 yrs out
- Wind 9/10 Extreme 99% chance of damaging wind over 30 yrs
- Air quality 1/10 Low 0 unhealthy d/yr today · 0 by 30 yrs out
Nearby sold comps map
Loading sold comps map…
Walkable amenities ~0.75 mi
Loading nearby amenities…
Taxation est. · year 1
- Rental income
- $19,624
- − Mortgage interest
- −$12,884
- − Property taxes
- −$1,669
- − Insurance
- −$1,150
- − Repairs & maintenance
- −$1,570
- − Management
- −$1,570
- − Depreciation
- −$6,691
- Taxable loss
- −$5,910
- Est. tax savings @ 24.0%
- +$1,418
- After-tax cash flow
- $-372/yr
For passive investors: Depreciation is non-cash, so a rental often shows a tax loss while cash-flowing — sheltering income. Rental losses are passive: they offset passive income freely, and up to $25,000/yr can offset ordinary (W-2) income if you actively participate and your MAGI is under $100k (phasing out to $0 by $150k); unused losses carry forward. On sale, claimed depreciation is recaptured at up to 25%, and gains may owe capital-gains tax (a 1031 exchange can defer both). Figures are a year-1 estimate at your 24.0% rate — not tax advice; consult a CPA.
Schools (NCES district)
- District
- Escambia
- NCES district ID
- 1200510
- Math proficiency
- 40% ▼ -9.00%
- Reading proficiency
- 45% ▼ -4.00%
- Median HH income
- $44,649
- Composite
- 36.04/100
- National rank
- #4773
- State rank
- #56 of 73 in FL
Livability — Brent
- Score
- 69/100
- State rank
- #484
- US rank
- #8921
Category grades
Schools grade is shown separately in the Schools card above.
Census & demographics
- Census place
- Brent, FL
- County
- Escambia County · 301,722 people
- Metro
- Pensacola-Ferry Pass-Brent, FL
- Population (ZIP)
- 27,877
- Household income
- $44,783
- Rent vs Own
- Severe rent burden
- 1458.0
Population outlook (Escambia County) Hauer SSP2
- Today (2025)
- 334,637 people
- By 2030
- 345,779 · +3.3%
- By 2040
- 364,828 · +9.0%
- By 2050
- 378,514 · +13.1%
- By 2075
- 403,220 · +20.5%
- By 2100
- 386,125 · +15.4%
Race, ethnicity, and origin ACS 2023
- Neighborhood character
- Diverse neighborhood (Simpson 0.66)
- Race & ethnicity
- Black 48% White 32% Hispanic / Latino 11% Two or more races 9% Asian 2%
- Hispanic origin (detail)
- Mexican 5% Cuban 2%
- Common ancestry
- Slovak 2% Italian 1% Serbian 1%
- Foreign-born
- 9% · Canada, Vietnam
- Languages at home
- 87% English-only · Spanish 9% Other Indo-European 1% Vietnamese 1%
Political lean MEDSL · Escambia
- 2024 margin
- R (+19.5) · D 39.7% · R 59.2% · Other 1.1%
- 2008→2024 swing
- -0.2pp no change · 2008: -19.3pp · 2024: -19.5pp
- All cycles
- 2024: R+19.5 2020: R+15.1 2016: R+20.6 2012: R+20.6 2008: R+19.3
Not yet ingested
- Civics
- —
Market trends
- HPI YoY
- ▼ -74.10%
- Current HPI
- 205.45
- Rent YoY
- ▲ 4.92%
- Metro
- Pensacola-Ferry Pass-Brent, FL
- State GDP YoY
- ▲ 3.28%
- F500 in state
- 36
Industry mix (Fortune 500 HQ in FL)
| Industry | F500 HQs | Revenue |
|---|---|---|
| Industrial Technology | 2 | $29B |
|
||
| Insurance | 2 | $17B |
|
||
| Retail | 1 | $60B |
|
||
| Technology Distribution | 1 | $58B |
|
||
| Homebuilding | 1 | $35B |
|
||
| Technology Manufacturing | 1 | $35B |
|
||
Price history
+284.0% since first listed3 events — show timeline
- 2026-06-10 Listed $230,000 PARMLS
- 2012-06-06 Listing Removed — PARMLS
- 2011-12-06 Listed $59,900 PARMLS
Property tax history
+5.8%/yrLatest (2025): $1,669 · +15.0% YoY. Source: county tax records.
Cash-flow waterfall
monthlySold comps — $/sqft
last 12 mo · ≤1 miLoading sold comps…