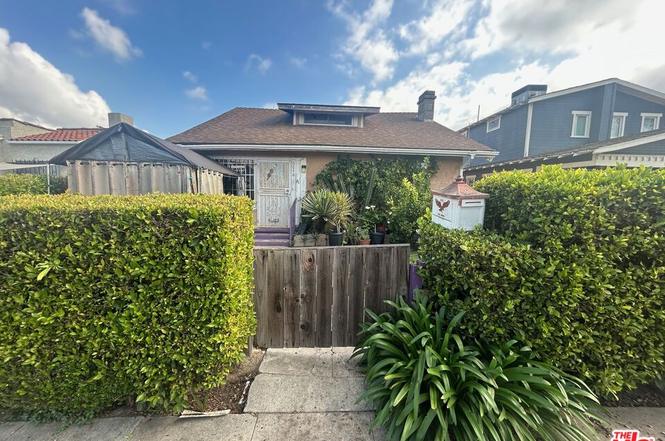
6648 8th Ave · Los Angeles, CA
Flood risk No data
- FEMA flood zone
- —
- Chance of flooding over 30 yrs
- —
- Est. flood insurance / yr
- —
Fire risk No data
- Est. fire insurance / yr
- —
Heat risk No data
- Hot days now (above threshold)
- —
- Hot days in 30 yrs
- —
Wind risk No data
- Chance of severe wind over 30 yrs
- —
Air-quality risk No data
- Unhealthy air days now
- —
- Unhealthy air days in 30 yrs
- —
Risk factors via First Street. Map © Google.
Why this score? — see what drove the C- grade
The composite is a weighted blend of 9 inputs, each scored 0–100. Each bar is that input's sub-score; the figure is the points it added to the 100-point composite (weight × sub-score).
- Cash flow +15.3/30.0
- ARV discount +15.0/15.0
- DSCR +4.7/10.0
- 1% rule +4.2/10.0
- Rent growth +3.8/5.0
- Schools +3.6/10.0
- Livability +3.4/5.0
- Condition / age +2.5/5.0
- Appreciation +0.0/10.0
$615,000
🖨 Deal sheet (PDF) 📄 Offer letter ✓ Due diligence
Listing remarks
Unlock the potential at 6648 8th Ave. as a flexible property offering multiple living spaces in a centrally located Los Angeles neighborhood. The main residence is currently configured to support separate living areas, featuring two bedrooms in the front portion and an additional bedroom toward the rear. A detached structure at the back provides added space with two bedrooms, presenting possibilities for extended occupancy or supplemental use. Additional highlights include a gated front yard, attractive greenery, spacious interiors, and a long driveway with ample parking capacity. With convenient proximity to major transportation routes, employment centers, and city amenities, this property
Key facts
- Detached structure
- Gated front yard
- Convenient proximity
Tags
Neighborhood map
What this means for you Summary
Snapshot
- This is a 3-bed/2.0-bath single-family listed at $615k.
Deal economics
- At list price, monthly cash flow is $224 ($3k/yr) — positive.
- The deal already cash-flows at list — no discount required.
- To meet the 1% rule (rent ≥ 1% of price), the offer needs to be $566k (7.9% below list).
- Recommended offer: $566k (7.9% below list) — sets the bar for 1% rule.
- Cap rate 6.7% vs local median 2.1% in Los Angeles — top-decile yield for the area; either an underpriced asset or a hidden risk that comps aren't pricing in. Stress-test before assuming the spread holds.
Location & tenants
- Location reads 68/100 on livability (#273 in CA) — a middle-class / working-renter tenant base. Strengths: amenities A+, commute A+, employment B; Watch: health & safety C-, crime F, cost of living F.
- Los Angeles Unified (urban): math 29% / reading 54% proficiency, ranked #223 of 517 in CA (top 43%) — families likely to look elsewhere, expect single-tenant / working-renter base with shorter leases; 67% free/reduced lunch — lower-income household profile, screen leases tightly.
- Zoned schools: Yes Academy (448 students, 96% FRL); Valley Academy of Arts And Sciences (math 22% / reading 52%, grade F, #578 of 1,170 statewide, top 51%, 868 students, 64% FRL).
- Market conditions: Rents rising fast (+5.0%/yr); 145 active listings in the ZIP; 14 comparable units currently listed for rent nearby; rentals lingering (median 46d on market — plan ~5-8 weeks vacancy on turnover, expect pricing pressure); 50% of comp listings sitting > 30 days — soft ceiling on asking rent; 19,697 units permitted in Los Angeles County in 2024 (9,426 in 5+ unit buildings).
- At $5,664/mo this rent would consume 105% of the median local household income ($65k/yr) (locally 3295% of renters already pay >50% of income on rent) — very limited rent-growth headroom before tenants either downsize or default.
Forward outlook
- Local home prices are declining (-3.0%/yr); year-one equity from $4k of loan paydown is wiped out by about $18k of value loss. Plan a longer hold.
- Los Angeles County population projected at +9% by 2050 — modest demand growth; plan on rents tracking national, not racing it.
Negotiation context
- It's been on market 68 days — a 6% lower offer ($578k) is reasonable based on typical stale-listing flexibility.
- 6 sale attempts since 2y ago with the ask held roughly flat each time — persistent listings suggest the price (not the market) is what's stuck; bring a comps-based counter.
Risks & watch-outs
- Watch-outs: built in 1923 — expect roof / HVAC / electrical / plumbing capex.
Questions for the listing agent
- It's been on market 68 days. Have you received any prior offers? Is the seller open to a 8% concession, seller financing, or rate buy-down credit?
- Built in 1923 — when were the roof, HVAC, electrical panel, plumbing, and water heater last replaced?
- Why hasn't it sold? Are there any deal-killer items the seller is aware of (foundation, flood, title, zoning, code violations)?
- Is there a deadline driving the sale (1031 exchange, divorce, estate, relocation)? That informs how much negotiation room exists.
- Schools are D-rated, which usually means shorter tenancies and higher turnover. Who's the typical renter profile here, and what's been the actual vacancy rate?
- Crime grade is F in this area — have there been break-ins, vandalism, or insurance claims at this property in the last 3 years? What carrier currently insures it and at what premium?
- What's the average days-on-market for RENTAL listings here right now (not sales)? A rising rental-DOM trend means longer vacancies and softer asking-rent achievability than the comps imply.
- What's the recent tenant-quality profile in this submarket — average credit score on applications, eviction rate, late-payment / NSF rate, and stable-employment percentage? A property-management company in the area should have these aggregated.
- How much new for-sale + rental construction is in the pipeline within 1–3 miles? Heavy new supply typically softens prices + rents 12–24 months out; constrained supply supports both.
Investment metrics
- 1% rule
- 0.92% ✗
- Cap rate
- 6.73%
- Cash-on-cash
- 1.56%
- DSCR
- 1.07
- GRM
- 9.0
CMA / ARV
- ARV (on-the-fly)
- $801,900
- Comps found
- 7
Show comp detail 7 sales within ~0.75 mi
| Address | Dist | Beds/Ba | Sqft | Sold | Price | $/sf | Match |
|---|---|---|---|---|---|---|---|
| 6648 8th Ave | 0.00mi | 3/2.0 | 2,430 (0%) | 1mo | $590,000 | $243 | 99 |
| 2815 Southwest Dr | 0.18mi | 2/1.0 (-1) | 2,765 (+14%) | 6mo | $684,000 | $247 | 55 |
| 2138 W Florence Ave | 0.61mi | 3/1.5 | 2,316 (-5%) | 16mo | $800,000 | $345 | 48 |
| 2401 W 78th St | 0.72mi | 4/3.0 (+1) | 2,315 (-5%) | 2mo | $680,000 | $294 | 48 |
| 3146 W 78th St | 0.68mi | 4/3.0 (+1) | 2,137 (-12%) | 1mo | $1,265,000 | $592 | 38 |
| 2615 W 76th St | 0.54mi | 4/3.0 (+1) | 2,630 (+8%) | 20mo | $1,025,000 | $390 | 36 |
| 2047 W Florence Ave | 0.68mi | 4/3.0 (+1) | 2,090 (-14%) | 15mo | $689,000 | $330 | 23 |
Match score weights: distance 35% · size 25% · config 20% · recency 20%. Top-matched comps best support the ARV.
Projected returns pro-forma
-3.0% appreciation · 5.01% rent growth · sell at horizon
- IRR
- -11.6%
- Equity multiple
- 0.57×
- Total profit
- $-73,597
- Equity at exit
- $91,698
- IRR
- 0.4%
- Equity multiple
- 1.03×
- Total profit
- $4,618
- Equity at exit
- $53,174
Cash invested: $172,200 (down + closing). Projections, not guarantees.
Landlord ↔ Tenant lean methodology
- Overall (CITY)
- 0 Strongly Tenant-Friendly
- State California
- 18 Strongly Tenant-Friendly · D+13
- County
- — inherits STATE
- City Los Angeles
- 0 Strongly Tenant-Friendly · D+22
ZIP-level market 90043
- Rents YoY
- 5.0%
- Active inventory
- 145
- Price-to-rent
- 9.0×
Monthly cashflow live
- Estimated rent
- $5,664 high interval (Pro) →
- Mortgage (P&I)
- −$3,225
- Tax est. 1.5%
- −$769 /mo · $9,225/yr
- Insurance
- −$256
- HOA
- −$0
- Vacancy / Maint / Mgmt
- −$1,189
- Net cashflow
- $224
Break-even live
Sensitivity live
| Price | -10% $649 | -5% $437 | +0% $224 | +5% $12 | +10% $-201 |
|---|---|---|---|---|---|
| Rent | -10% $-223 | -5% $1 | +0% $224 | +5% $448 | +10% $672 |
| Rate | -1.0pp $534 | -0.5pp $381 | base $224 | +0.5pp $65 | +1.0pp $-97 |
UW: 25.0% down · 7.5% · 30yr · 1.5% tax · 5.0% vac · 8.0% maint · 8.0% mgmt
Financing live
Cash to close
- Down payment
- $153,750
- Closing costs
- $18,450
- Reserves months
- —
- Total cash needed
- —
Loan-product check · same deal, 3 products live
Conventional
25% down · 7.5% · 30yr
- Down + closing
- —
- Monthly P&I
- —
- Monthly cashflow
- —
- DSCR
- —
- Eligible?
- —
Personal DTI + credit; lowest rate.
DSCR
20% down · 8.5% · 30yr
- Down + closing
- —
- Monthly P&I
- —
- Monthly cashflow
- —
- DSCR
- —
- Eligible?
- —
No personal income docs; deal must DSCR.
Hard money
10% down · 12.0% · 12mo
- Down + closing
- —
- Monthly P&I
- —
- Monthly cashflow
- —
- DSCR
- —
- Eligible?
- —
Short-term bridge; refi at stabilization.
Rent comps 14 comps
| Address | Beds | Baths | Sqft | Rent | $/sqft | DOM | Units | Dist |
|---|---|---|---|---|---|---|---|---|
| 6407 11th Ave Los Angeles, CA | 2.0 | 1.0 | 2764 | $2,250 | $0.81 | 26d | 1 | 0.28mi |
| 7007 Arlington Ave Los Angeles, CA | 3.0 | 2.0 | 1597 | $5,195 | $3.25 | 45d | 1 | 0.45mi |
| 7007 Arlington Ave Los Angeles, CA | 3.0 | 2.0 | 1597 | $4,995 | $3.13 | 24d | 1 | 0.45mi |
| 6015 Brynhurst Ave Los Angeles, CA | 4.0 | 2.0 | 1902 | $5,400 | $2.84 | 45d | 1 | 0.62mi |
| 5465 9th Ave Los Angeles, CA | 4.0 | 2.0 | 1824 | $9,500 | $5.21 | 45d | 1 | 0.85mi |
| 2211 W 78th Pl Inglewood, CA | 3.0 | 2.0 | 1749 | $4,500 | $2.57 | 17d | 1 | 0.85mi |
| 7530 S Hobart Blvd Los Angeles, CA | 4.0 | 3.0 | 2400 | $5,750 | $2.40 | 21d | 1 | 1.19mi |
| 5136 S Victoria Ave Los Angeles, CA | 4.0 | 3.5 | 2450 | $11,500 | $4.69 | 45d | 1 | 1.20mi |
| 713 Daniel Freeman Cir Inglewood, CA | 4.0 | 3.5 | 2258 | $5,700 | $2.52 | 26d | 1 | 1.31mi |
| 713 Daniel Freeman Cir Inglewood, CA | 4.0 | 3.5 | 2258 | $5,700 | $2.52 | 19d | 1 | 1.31mi |
| 720 Grace Ave Inglewood, CA | 4.0 | 3.5 | 2335 | $7,500 | $3.21 | 45d | 1 | 1.32mi |
| 749 Daniel Freeman Cir Inglewood, CA | 4.0 | 3.5 | 2258 | $5,895 | $2.61 | 45d | 1 | 1.35mi |
| 782 Daniel Freeman Cir Inglewood, CA | 4.0 | 3.0 | 2258 | $6,000 | $2.66 | 26d | 1 | 1.39mi |
| 3500 W Manchester Blvd Inglewood, CA | 2.0–3.0 | 2.5–3.0 | 1626 | $4,800 | $2.95 | 45d | 3 | 1.45mi |
Listing history 11 events
-
2026-04-22status Pending
-
2026-03-26price $615,000
-
2026-03-14status Active
-
2026-03-12historical Backup Offers Accepted
-
2026-02-27status Active
-
2026-02-04$600,000 Active
-
2025-01-13status Active
-
2024-11-24status Active
-
2024-05-14price $648,999
-
2024-05-02price $649,000
-
2024-03-26$710,000 Active
ⓘ Source: listings_history table (triggers on properties + properties_extension) + one-shot
backfill from property_details.listing_events for pre-trigger history.
Nearby sold comps map
Loading sold comps map…
Walkable amenities ~0.75 mi
Loading nearby amenities…
Taxation est. · year 1
- Rental income
- $67,967
- − Mortgage interest
- −$34,450
- − Property taxes
- −$9,225
- − Insurance
- −$3,075
- − Repairs & maintenance
- −$5,437
- − Management
- −$5,437
- − Depreciation
- −$17,891
- Taxable loss
- −$7,548
- Est. tax savings @ 24.0%
- +$1,812
- After-tax cash flow
- $4,504/yr
For passive investors: Depreciation is non-cash, so a rental often shows a tax loss while cash-flowing — sheltering income. Rental losses are passive: they offset passive income freely, and up to $25,000/yr can offset ordinary (W-2) income if you actively participate and your MAGI is under $100k (phasing out to $0 by $150k); unused losses carry forward. On sale, claimed depreciation is recaptured at up to 25%, and gains may owe capital-gains tax (a 1031 exchange can defer both). Figures are a year-1 estimate at your 24.0% rate — not tax advice; consult a CPA.
Schools (NCES district)
- District
- Los Angeles Unified
- NCES district ID
- 0622710
- Math proficiency
- 29% ▼ -4.00%
- Reading proficiency
- 54% ▲ 10.00%
- Median HH income
- $50,403
- Composite
- 35.67/100
- National rank
- #4875
- State rank
- #223 of 517 in CA
Livability — Los Angeles
- Score
- 68/100
- State rank
- #273
- US rank
- #9237
Category grades
Schools grade is shown separately in the Schools card above.
Census & demographics
- Census place
- Los Angeles, CA
- County
- Los Angeles County · 9,444,647 people
- City population
- 3,838,149
- Metro
- Los Angeles-Long Beach-Anaheim, CA
- Population (ZIP)
- 42,377
- Household income
- $64,792
- Rent vs Own
- Severe rent burden
- 3295.0
Population outlook (Los Angeles County) Hauer SSP2
- Today (2025)
- 10,940,515 people
- By 2030
- 11,256,481 · +2.9%
- By 2040
- 11,729,929 · +7.2%
- By 2050
- 11,948,407 · +9.2%
- By 2075
- 11,818,114 · +8.0%
- By 2100
- 10,842,928 · -0.9%
Race, ethnicity, and origin ACS 2023
- Neighborhood character
- Diverse neighborhood (Simpson 0.58)
- Race & ethnicity
- Black 58% Hispanic / Latino 26% Two or more races 16% White 6% Asian 2%
- Hispanic origin (detail)
- Mexican 14%
- Common ancestry
- British 2% Lithuanian 1% Italian 1%
- Foreign-born
- 18% · Canada, South Korea, Jamaica
- Languages at home
- 70% English-only · Spanish 25% French/Haitian/Cajun 1%
Political lean MEDSL · Los Angeles
- 2024 margin
- Solid D (+32.9) · D 64.8% · R 31.9% · Other 3.3%
- 2008→2024 swing
- -7.4pp toward R · 2008: 40.4pp · 2024: 32.9pp
- All cycles
- 2024: D+32.9 2020: D+44.2 2016: D+48.0 2012: D+40.0 2008: D+40.4
Not yet ingested
- Civics
- —
Market trends
- HPI YoY
- ▼ -1382.39%
- Current HPI
- 434.3031
- Rent YoY
- ▲ 5.01%
- Metro
- Los Angeles-Long Beach-Anaheim, CA
- State GDP YoY
- ▲ 3.21%
- F500 in state
- 116
Industry mix (Fortune 500 HQ in CA)
| Industry | F500 HQs | Revenue |
|---|---|---|
| Technology | 27 | $1,492B |
|
||
| Financial Services | 3 | $174B |
|
||
| Retail | 3 | $44B |
|
||
| Insurance | 3 | $26B |
|
||
| Media / Entertainment | 2 | $115B |
|
||
| Pharmaceuticals / Biotech | 2 | $62B |
|
||
Price history
-13.4% since first listed11 events — show timeline
- 2026-04-22 Pending — TheMLS
- 2026-03-26 Price Changed $615,000 TheMLS
- 2026-03-14 Relisted — TheMLS
- 2026-03-12 Contingent — TheMLS
- 2026-02-27 Relisted — TheMLS
- 2026-02-04 Listed $600,000 TheMLS
- 2025-01-13 Relisted — CRMLS
- 2024-11-24 Relisted — CRMLS
- 2024-05-14 Price Changed $648,999 CRMLS
- 2024-05-02 Price Changed $649,000 CRMLS
- 2024-03-26 Listed $710,000 CRMLS
Cash-flow waterfall
monthlySold comps — $/sqft
last 12 mo · ≤1 miLoading sold comps…