305 S Brown St · Richland Springs, TX
Flood risk 1/10 · Minimal
- FEMA flood zone
- —
- Chance of flooding over 30 yrs
- 0.0%
- Est. flood insurance / yr
- —
Fire risk 7/10 · Major
- Est. fire insurance / yr
- $1,222 – $2,270
Heat risk 7/10 · Major
- Hot days now (above 105°F)
- 6 days/yr
- Hot days in 30 yrs
- 18 days/yr
Wind risk 6/10 · Moderate
- Chance of severe wind over 30 yrs
- 27.0%
Air-quality risk 1/10 · Minimal
- Unhealthy air days now
- 0 days/yr
- Unhealthy air days in 30 yrs
- 0 days/yr
Risk factors via First Street. Map © Google.
Why this score? — see what drove the C grade
The composite is a weighted blend of 9 inputs, each scored 0–100. Each bar is that input's sub-score; the figure is the points it added to the 100-point composite (weight × sub-score).
- Cash flow +22.4/30.0
- ARV discount +7.5/15.0
- DSCR +7.2/10.0
- Appreciation +5.0/10.0
- 1% rule +4.8/10.0
- Livability +3.1/5.0
- Schools +2.9/10.0
- Rent growth +2.5/5.0
- Condition / age +2.5/5.0
$114,900
🖨 Deal sheet 📄 Offer letter ✓ Due diligence
Listing remarks MLS
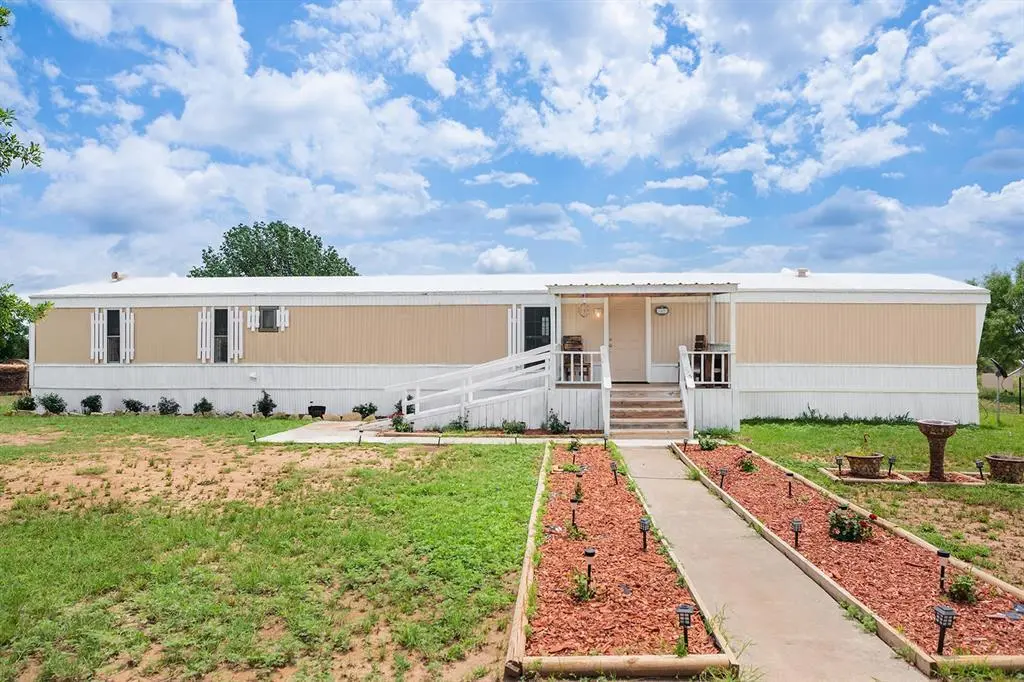
FULLY FURNISHED three bed + two bath on 0.75 acres! Settle into the simplicity of country living at this well cared for three bedroom, two bath manufactured home on approximately three quarters of an acre in Richland Springs. With open pastureland as your backdrop, this property delivers peaceful surroundings and room to breathe. Inside, you will find a clean, comfortable interior that comes fully furnished, making it move in ready or perfectly suited for a weekend escape. The home features a welcoming living area, a functional kitchen with bar seating, and a private primary suite with its own bath. Enjoy quiet mornings or relaxed evenings from either the front or back porch while taking in the wide open views. Tucked away on a low traffic road, this property offers a true break from city life while remaining within easy reach of small town amenities. Whether you are looking for a full time residence or a country retreat, this is a place to slow down and enjoy the view.
Key facts
- Functional kitchen
- Open pastureland
- Front or back porch
Tags
Neighborhood map
What this means for you Summary
Snapshot
- This is a 3-bed/2.0-bath manufactured listed at $115k.
Deal economics
- At list price, monthly cash flow is $192 ($2k/yr) — positive.
- The deal already cash-flows at list — no discount required.
- To meet the 1% rule (rent ≥ 1% of price), the offer needs to be $113k (1.6% below list).
- Recommended offer: $101k (12.0% below list) — sets the bar for market timing.
Location & tenants
- Location reads 61/100 on livability (#993 in TX) — a middle-class / working-renter tenant base. Strengths: cost of living A+, housing A+; Watch: schools D+, crime F, amenities F.
- Richland Springs ISD (rural): math 30% / reading 30% proficiency, ranked #996 of 1,141 in TX (top 87%) — families likely to look elsewhere, expect single-tenant / working-renter base with shorter leases.
- Market conditions: 19 active listings in the ZIP.
Forward outlook
- In year one you build about $4k of equity ($794 loan paydown + $3k appreciation (3.0% local appreciation)).
- San Saba County population projected at -22% by 2050 — secular population decline; favor cash flow + early exit over multi-decade hold.
- At projected returns (3.0% appreciation + 3.0% rent growth), your $32k cash investment doubles in ~5 years — after that, you're playing with house money.
- By year 8, paydown + projected appreciation supports a ~$31k cash-out refi (75% LTV) — recoverable capital for the next deal without selling this one.
Negotiation context
- It's been on market 161 days — a 12% lower offer ($101k) is reasonable based on typical stale-listing flexibility.
- 5 sale attempts since 4y ago with the ask held roughly flat each time — persistent listings suggest the price (not the market) is what's stuck; bring a comps-based counter.
Risks & watch-outs
- Climate carrying-cost: major wind risk, 27% chance of damaging wind over 30y; major wildfire risk; extreme-heat days projected 6→18/yr by 2055 (HVAC capex compounding) — expect insurance premiums to compound above CPI over the hold.
Questions for the listing agent
- It's been on market 161 days. Have you received any prior offers? Is the seller open to a 12% concession, seller financing, or rate buy-down credit?
- Why hasn't it sold? Are there any deal-killer items the seller is aware of (foundation, flood, title, zoning, code violations)?
- Is there a deadline driving the sale (1031 exchange, divorce, estate, relocation)? That informs how much negotiation room exists.
- Schools are D-rated, which usually means shorter tenancies and higher turnover. Who's the typical renter profile here, and what's been the actual vacancy rate?
- Crime grade is F in this area — have there been break-ins, vandalism, or insurance claims at this property in the last 3 years? What carrier currently insures it and at what premium?
- What's the average days-on-market for RENTAL listings here right now (not sales)? A rising rental-DOM trend means longer vacancies and softer asking-rent achievability than the comps imply.
- What's the recent tenant-quality profile in this submarket — average credit score on applications, eviction rate, late-payment / NSF rate, and stable-employment percentage? A property-management company in the area should have these aggregated.
- How much new for-sale + rental construction is in the pipeline within 1–3 miles? Heavy new supply typically softens prices + rents 12–24 months out; constrained supply supports both.
Investment metrics
- 1% rule
- 0.98% ✗
- Cap rate
- 8.30%
- Cash-on-cash
- 7.17%
- DSCR
- 1.32
- GRM
- 8.5
CMA / ARV
No comps found within radius.
Projected returns pro-forma
3.0% appreciation · 3.0% rent growth · sell at horizon
- IRR
- 14.2%
- Equity multiple
- 1.81×
- Total profit
- $26,049
- Equity at exit
- $51,664
- IRR
- 16.0%
- Equity multiple
- 3.35×
- Total profit
- $75,530
- Equity at exit
- $79,620
Cash invested: $32,172 (down + closing). Projections, not guarantees.
Landlord ↔ Tenant lean methodology
- Overall (STATE)
- 87 Strongly Landlord-Friendly
- State Texas
- 87 Strongly Landlord-Friendly · R+5
- County
- — inherits STATE
- City
- — inherits STATE
ZIP-level market 76871
- Active inventory
- 19
- Price-to-rent
- 8.5×
Monthly cashflow live
- Estimated rent
- $1,131 medium interval (Pro) →
- Mortgage (P&I)
- −$603
- Tax from tax record
- −$51 /mo · $610/yr
- Insurance
- −$48
- HOA
- −$0
- Vacancy / Maint / Mgmt
- −$238
- Net cashflow
- $192
Break-even live
UW: 25.0% down · 7.5% · 30yr · 1.5% tax · 5.0% vac · 8.0% maint · 8.0% mgmt
Financing live
Cash to close
- Down payment
- $28,725
- Closing costs
- $3,447
- Reserves months
- —
- Total cash needed
- —
Loan-product check · same deal, 3 products live
Conventional
25% down · 7.5% · 30yr
- Down + closing
- —
- Monthly P&I
- —
- Monthly cashflow
- —
- DSCR
- —
- Eligible?
- —
Personal DTI + credit; lowest rate.
DSCR
20% down · 8.5% · 30yr
- Down + closing
- —
- Monthly P&I
- —
- Monthly cashflow
- —
- DSCR
- —
- Eligible?
- —
No personal income docs; deal must DSCR.
Hard money
10% down · 12.0% · 12mo
- Down + closing
- —
- Monthly P&I
- —
- Monthly cashflow
- —
- DSCR
- —
- Eligible?
- —
Short-term bridge; refi at stabilization.
Listing history 29 events
-
2026-06-18days on market $114,900 Active 161 DOM
-
2026-06-17days on market $114,900 Active 160 DOM
-
2026-06-16days on market $114,900 Active 159 DOM
-
2026-06-15days on market $114,900 Active 158 DOM
-
2026-06-15days on market $114,900 Active 157 DOM
-
2026-06-13days on market $114,900 Active 156 DOM
-
2026-06-12days on market $114,900 Active 155 DOM
-
2026-06-09days on market $114,900 Active 152 DOM
-
2026-06-08days on market $114,900 Active 151 DOM
-
2026-06-08days on market $114,900 Active 150 DOM
-
2026-06-05days on market $114,900 Active 148 DOM
-
2026-06-03days on market $114,900 Active 146 DOM
-
2026-06-02days on market $114,900 Active 145 DOM
-
2026-06-01days on market $114,900 Active 144 DOM
-
2026-05-31days on market $114,900 Active 143 DOM
-
2026-05-06price $114,900 991-char remark
Show marketing remark (991 chars)
FULLY FURNISHED three bed + two bath on 0.75 acres! Settle into the simplicity of country living at this well cared for three bedroom, two bath manufactured home on approximately three quarters of an acre in Richland Springs. With open pastureland as your backdrop, this property delivers peaceful surroundings and room to breathe. Inside, you will find a clean, comfortable interior that comes fully furnished, making it move in ready or perfectly suited for a weekend escape. The home features a welcoming living area, a functional kitchen with bar seating, and a private primary suite with its own bath. Enjoy quiet mornings or relaxed evenings from either the front or back porch while taking in the wide open views. Tucked away on a low traffic road, this property offers a true break from city life while remaining within easy reach of small town amenities. Whether you are looking for a full time residence or a country retreat, this is a place to slow down and enjoy the view.
-
2026-01-08$119,900 Active 991-char remark
Show marketing remark (991 chars)
FULLY FURNISHED three bed + two bath on 0.75 acres! Settle into the simplicity of country living at this well cared for three bedroom, two bath manufactured home on approximately three quarters of an acre in Richland Springs. With open pastureland as your backdrop, this property delivers peaceful surroundings and room to breathe. Inside, you will find a clean, comfortable interior that comes fully furnished, making it move in ready or perfectly suited for a weekend escape. The home features a welcoming living area, a functional kitchen with bar seating, and a private primary suite with its own bath. Enjoy quiet mornings or relaxed evenings from either the front or back porch while taking in the wide open views. Tucked away on a low traffic road, this property offers a true break from city life while remaining within easy reach of small town amenities. Whether you are looking for a full time residence or a country retreat, this is a place to slow down and enjoy the view.
-
2025-07-16price $99,000
-
2025-06-02$109,000 Active
-
2024-08-19soldstatus Closed
-
2023-11-13$89,000 Active
-
2023-07-31historical
-
2023-06-01price $97,000
-
2023-01-26$110,000 Active
-
2023-01-23historical
-
2022-12-03$119,000 Active
-
2016-07-15soldstatus
-
2010-02-17soldstatus
-
2004-03-29soldstatus
ⓘ Source: listings_history table (triggers on properties + properties_extension) + one-shot
backfill from property_details.listing_events for pre-trigger history.
Tax reassessment forecast TX · Resets to sale price
- Current annual tax
- $610 · $51/mo
- Projected year-2 tax
- $2,103 · $175/mo
- Expected delta
- +$1,493/yr (+$124/mo · 244.9%)
ⓘ Screening estimate from a state-policy table — verify with the county assessor before closing.
Climate risk First Street
- Flood 1/10 Low 0% chance over 30 yrs
- Wildfire 7/10 Severe
- Heat 7/10 Severe 6 d/yr ≥105°F today · 18 d/yr by 30 yrs out
- Wind 6/10 Major 27% chance of damaging wind over 30 yrs
- Air quality 1/10 Low 0 unhealthy d/yr today · 0 by 30 yrs out
Nearby sold comps map
Loading sold comps map…
Walkable amenities ~0.75 mi
Loading nearby amenities…
Taxation est. · year 1
- Rental income
- $13,573
- − Mortgage interest
- −$6,436
- − Property taxes
- −$610
- − Insurance
- −$574
- − Repairs & maintenance
- −$1,086
- − Management
- −$1,086
- − Depreciation
- −$3,343
- Taxable income
- $438
- Est. tax owed @ 24.0%
- −$105
- After-tax cash flow
- $2,202/yr
For passive investors: Depreciation is non-cash, so a rental often shows a tax loss while cash-flowing — sheltering income. Rental losses are passive: they offset passive income freely, and up to $25,000/yr can offset ordinary (W-2) income if you actively participate and your MAGI is under $100k (phasing out to $0 by $150k); unused losses carry forward. On sale, claimed depreciation is recaptured at up to 25%, and gains may owe capital-gains tax (a 1031 exchange can defer both). Figures are a year-1 estimate at your 24.0% rate — not tax advice; consult a CPA.
Schools (NCES district)
- District
- Richland Springs ISD
- NCES district ID
- 4837080
- Math proficiency
- 30% ▼ -5.00%
- Reading proficiency
- 30% ▼ -5.00%
- Median HH income
- $48,682
- Composite
- 28.91/100
- National rank
- #11949
- State rank
- #996 of 1141 in TX
Livability — Richland Springs
- Score
- 61/100
- State rank
- #993
- US rank
- #17676
Category grades
Schools grade is shown separately in the Schools card above.
Census & demographics
- Census place
- Richland Springs, TX
- Population (ZIP)
- 560
Population outlook (San Saba County) Hauer SSP2
- Today (2025)
- 5,602 people
- By 2030
- 5,392 · -3.7%
- By 2040
- 4,844 · -13.5%
- By 2050
- 4,386 · -21.7%
- By 2075
- 3,565 · -36.4%
- By 2100
- 2,627 · -53.1%
Race, ethnicity, and origin ACS 2023
- Neighborhood character
- Diverse neighborhood (Simpson 0.60)
- Race & ethnicity
- White 61% Two or more races 24% Hispanic / Latino 16%
- Hispanic origin (detail)
- Mexican 16%
- Common ancestry
- Italian 8% Lithuanian 2% Romanian 2%
- Foreign-born
- 10% · Canada
- Languages at home
- 86% English-only · Spanish 14%
Political lean MEDSL · San Saba
- 2024 margin
- Solid R (+79.0) · D 10.2% · R 89.2%
- 2008→2024 swing
- -19.8pp toward R · 2008: -59.2pp · 2024: -79.0pp
- All cycles
- 2024: R+79.0 2020: R+77.7 2016: R+73.6 2012: R+70.1 2008: R+59.2
Not yet ingested
- Civics
- —
Market trends
- HPI YoY
- —
- Current HPI
- —
- Rent YoY
- —
- Metro
- —
- State GDP YoY
- ▲ 3.95%
- F500 in state
- 110
Industry mix (Fortune 500 HQ in TX)
| Industry | F500 HQs | Revenue |
|---|---|---|
| Energy | 16 | $1,198B |
|
||
| Technology | 5 | $198B |
|
||
| Engineering / Construction | 4 | $72B |
|
||
| Energy Services | 3 | $60B |
|
||
| Utilities | 3 | $41B |
|
||
| Healthcare | 2 | $330B |
|
||
Price history
-3.4% since first listed14 events — show timeline
- 2026-05-06 Price Changed $114,900 NTREIS
- 2026-01-08 Listed $119,900 NTREIS
- 2025-07-16 Price Changed $99,000 NTREIS
- 2025-06-02 Listed $109,000 NTREIS
- 2024-08-19 Sold (MLS) — HLMLS as distributed by MLS GRID
- 2023-11-13 Listed $89,000 HLMLS as distributed by MLS GRID
- 2023-07-31 Listing Removed — NTREIS
- 2023-06-01 Price Changed $97,000 NTREIS
- 2023-01-26 Listed $110,000 NTREIS
- 2023-01-23 Listing Removed — NTREIS
- 2022-12-03 Listed $119,000 NTREIS
- 2016-07-15 Sold (Public Records) — Public Records
- 2010-02-17 Sold (Public Records) — Public Records
- 2004-03-29 Sold (Public Records) — Public Records
Property tax history
+2.8%/yrLatest (2026): $610 · -0.5% YoY. Source: county tax records.
Cash-flow waterfall
monthlySold comps — $/sqft
last 12 mo · ≤1 miLoading sold comps…