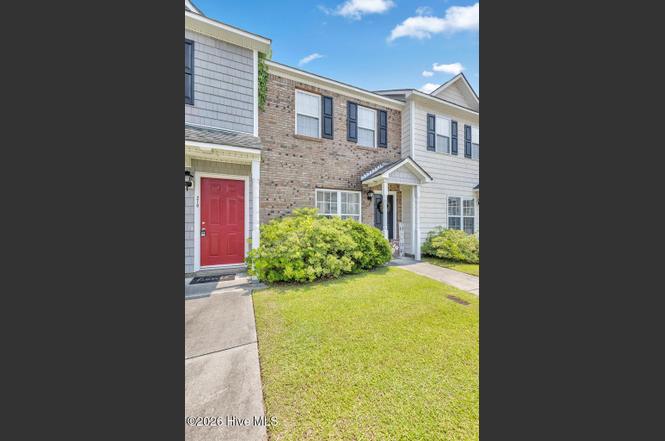
208 Bridgewood Dr · Jacksonville, NC
Flood risk 4/10 · Minor
- FEMA flood zone
- X (unshaded)
- Chance of flooding over 30 yrs
- 0.21%
- Est. flood insurance / yr
- $507 – $1,088
Fire risk 5/10 · Moderate
- Est. fire insurance / yr
- $906 – $1,684
Heat risk 9/10 · Severe
- Hot days now (above 107°F)
- 7 days/yr
- Hot days in 30 yrs
- 18 days/yr
Wind risk 8/10 · Major
- Chance of severe wind over 30 yrs
- 97.0%
Air-quality risk 3/10 · Minor
- Unhealthy air days now
- 2 days/yr
- Unhealthy air days in 30 yrs
- 3 days/yr
Risk factors via First Street. Map © Google.
Why this score? — see what drove the D+ grade
The composite is a weighted blend of 9 inputs, each scored 0–100. Each bar is that input's sub-score; the figure is the points it added to the 100-point composite (weight × sub-score).
- Cash flow +15.7/30.0
- ARV discount +11.5/15.0
- DSCR +4.8/10.0
- 1% rule +3.9/10.0
- Schools +3.9/10.0
- Livability +3.6/5.0
- Rent growth +3.5/5.0
- Condition / age +2.5/5.0
- Appreciation +0.0/10.0
$160,000
🖨 Deal sheet (PDF) 📄 Offer letter ✓ Due diligence
Listing remarks MLS
Perfect townhouse in a fabulous neighborhood close to the main strip in Jacksonville and the base.
Key facts
- Functional kitchen
- Open living area
- Private rear patio
Tags
Property features AI
Finance
- Other: Zoning: TCA
- HOA & community: Homeowners association with an annual fee of $410 (about $34.17/month); Association reports no additional amenities
Exterior
- Parking: Assigned parking
- Utilities: Public water; Sewer available; Water available
- Home design: Townhouse (residential); Two levels; Entry level on level 1
- Construction: Vinyl siding and frame construction; Shingle roof; Slab foundation; Built with an irregular lot
- Exterior features: Patio; No fencing; Has a view; City street and state road frontage
Interior
- Bathrooms: 2 full bathrooms; 1 half bathroom
- Heating & cooling: Heat pump; Electric heating; Cooling via heat pump
- Interior features: Ceiling fan(s); Window coverings
Neighborhood map
What this means for you Summary
Snapshot
- This is a 2-bed/1.5-bath townhouse listed at $160k.
Deal economics
- At list price, monthly cash flow is $71 ($847/yr) — positive.
- The deal already cash-flows at list — no discount required.
- To meet the 1% rule (rent ≥ 1% of price), the offer needs to be $143k (10.7% below list).
- Recommended offer: $143k (10.7% below list) — sets the bar for 1% rule.
- Cap rate 6.8% vs local median 4.4% in Jacksonville — top-decile yield for the area; either an underpriced asset or a hidden risk that comps aren't pricing in. Stress-test before assuming the spread holds.
Location & tenants
- Location reads 71/100 on livability (#111 in NC) — a middle-class / working-renter tenant base. Strengths: cost of living A+, housing A+, health & safety A+; Watch: employment D, crime F, amenities F.
- Onslow County Schools (other): math 42% / reading 49% proficiency, ranked #84 of 178 in NC (top 47%) — families likely to look elsewhere, expect single-tenant / working-renter base with shorter leases.
- Zoned schools: Carolina Forest Elementary (math 53% / reading 52%, grade C-, #349 of 1,410 statewide, top 25%, 678 students, 49% FRL); Jacksonville Commons Middle (math 39% / reading 47%, grade D-, #191 of 475 statewide, top 41%, 1,011 students, 64% FRL); Jacksonville High (math 52% / reading 66%, grade C+, #233 of 535 statewide, top 44%, 1,423 students, 44% FRL) — zoned schools average 52% FRL vs 37% district-wide (15 pts higher); higher-poverty schools than district average — tighter screening recommended.
- Market conditions: Rents rising (+3.9%/yr); 612 active listings in the ZIP; 5 comparable units currently listed for rent nearby; rentals at typical pace (median 15d on market — plan ~3-4 weeks tenant-placement turnaround); 1,246 units permitted in Onslow County in 2024 (0 in 5+ unit buildings).
Forward outlook
- Local home prices are declining (-3.0%/yr); year-one equity from $1k of loan paydown is wiped out by about $5k of value loss. Plan a longer hold.
Negotiation context
- Only 2 days on market — expect competitive offers; lowballing is unlikely to land.
- 6 sale attempts since 14y ago with the ask held roughly flat each time — persistent listings suggest the price (not the market) is what's stuck; bring a comps-based counter.
- Current owner paid $112k; 43% above their basis — modest negotiation headroom, anchor on the comps not their cost.
Risks & watch-outs
- Climate carrying-cost: severe wind risk, 97% chance of damaging wind over 30y; moderate wildfire risk; extreme-heat days projected 7→18/yr by 2055 (HVAC capex compounding) — expect insurance premiums to compound above CPI over the hold.
Questions for the listing agent
- What does the HOA fee cover, when was the last increase, and are there any pending special assessments or reserve-fund shortfalls?
- Is there a deadline driving the sale (1031 exchange, divorce, estate, relocation)? That informs how much negotiation room exists.
- Crime grade is F in this area — have there been break-ins, vandalism, or insurance claims at this property in the last 3 years? What carrier currently insures it and at what premium?
- The area grade is low — what's the realistic commute time and amenity access for the typical tenant pool here? Any planned neighborhood developments (good or bad) we should know about?
- What's the average days-on-market for RENTAL listings here right now (not sales)? A rising rental-DOM trend means longer vacancies and softer asking-rent achievability than the comps imply.
- What's the recent tenant-quality profile in this submarket — average credit score on applications, eviction rate, late-payment / NSF rate, and stable-employment percentage? A property-management company in the area should have these aggregated.
- How much new for-sale + rental construction is in the pipeline within 1–3 miles? Heavy new supply typically softens prices + rents 12–24 months out; constrained supply supports both.
Investment metrics
- 1% rule
- 0.89% ✗
- Cap rate
- 6.82%
- Cash-on-cash
- 1.89%
- DSCR
- 1.08
- GRM
- 9.3
CMA / ARV
- ARV (on-the-fly)
- $175,584
- Comps found
- 12
Show comp detail 12 sales within ~0.75 mi
| Address | Dist | Beds/Ba | Sqft | Sold | Price | $/sf | Match |
|---|---|---|---|---|---|---|---|
| 111 Bridgewood Dr | 0.03mi | 2/1.5 | 992 (0%) | 1mo | $130,000 | $131 | 97 |
| 903 Springwood Dr | 0.04mi | 2/1.5 | 992 (0%) | 6mo | $168,000 | $169 | 93 |
| 304 Streamwood Dr | 0.06mi | 2/1.5 | 982 (-1%) | 5mo | $154,000 | $157 | 91 |
| 607 Streamwood Dr #607 | 0.10mi | 2/1.5 | 1,016 (+2%) | 2mo | $165,000 | $162 | 90 |
| 208 Springwood Dr | 0.14mi | 2/1.5 | 974 (-2%) | 3mo | $167,500 | $172 | 88 |
| 317 Glen Cannon Dr | 0.55mi | 2/2.5 | 1,084 (+9%) | 3mo | $189,000 | $174 | 53 |
| 310 Glen Cannon Drive Dr | 0.57mi | 2/2.5 | 1,084 (+9%) | 2mo | $200,500 | $185 | 52 |
| 141 Glen Cannon Dr | 0.75mi | 2/2.5 | 1,030 (+4%) | 4mo | $185,000 | $180 | 51 |
| 221 Glen Cannon Dr | 0.62mi | 2/2.5 | 1,084 (+9%) | 1mo | $199,900 | $184 | 51 |
| 403 Falls Cv | 0.59mi | 2/2.5 | 1,084 (+9%) | 3mo | $199,900 | $184 | 51 |
| 435 Falls Cv | 0.65mi | 2/2.5 | 1,094 (+10%) | 5mo | $198,000 | $181 | 45 |
| 149 Glen Cannon Dr | 0.74mi | 2/2.5 | 1,084 (+9%) | 6mo | $191,500 | $177 | 41 |
Match score weights: distance 35% · size 25% · config 20% · recency 20%. Top-matched comps best support the ARV.
Projected returns pro-forma
-3.0% appreciation · 3.86% rent growth · sell at horizon
- IRR
- -12.4%
- Equity multiple
- 0.55×
- Total profit
- $-20,190
- Equity at exit
- $23,857
- IRR
- -2.1%
- Equity multiple
- 0.85×
- Total profit
- $-6,614
- Equity at exit
- $13,834
Cash invested: $44,800 (down + closing). Projections, not guarantees.
Landlord ↔ Tenant lean methodology
- Overall (STATE)
- 85 Strongly Landlord-Friendly
- State North Carolina
- 85 Strongly Landlord-Friendly · R+3
- County
- — inherits STATE
- City
- — inherits STATE
ZIP-level market 28546
- Home prices YoY
- -19.3%
- Rents YoY
- 3.9%
- Active inventory
- 612
- Price-to-rent
- 9.3×
Monthly cashflow live
- Estimated rent
- $1,429 high interval (Pro) →
- Mortgage (P&I)
- −$839
- Tax from tax record
- −$119 /mo · $1,424/yr
- Insurance
- −$67
- HOA
- −$34
- Vacancy / Maint / Mgmt
- −$300
- Net cashflow
- $71
Break-even live
Sensitivity live
| Price | -10% $161 | -5% $116 | +0% $71 | +5% $25 | +10% $-20 |
|---|---|---|---|---|---|
| Rent | -10% $-42 | -5% $14 | +0% $71 | +5% $127 | +10% $184 |
| Rate | -1.0pp $151 | -0.5pp $111 | base $71 | +0.5pp $29 | +1.0pp $-13 |
UW: 25.0% down · 7.5% · 30yr · 1.5% tax · 5.0% vac · 8.0% maint · 8.0% mgmt
Financing live
Cash to close
- Down payment
- $40,000
- Closing costs
- $4,800
- Reserves months
- —
- Total cash needed
- —
Loan-product check · same deal, 3 products live
Conventional
25% down · 7.5% · 30yr
- Down + closing
- —
- Monthly P&I
- —
- Monthly cashflow
- —
- DSCR
- —
- Eligible?
- —
Personal DTI + credit; lowest rate.
DSCR
20% down · 8.5% · 30yr
- Down + closing
- —
- Monthly P&I
- —
- Monthly cashflow
- —
- DSCR
- —
- Eligible?
- —
No personal income docs; deal must DSCR.
Hard money
10% down · 12.0% · 12mo
- Down + closing
- —
- Monthly P&I
- —
- Monthly cashflow
- —
- DSCR
- —
- Eligible?
- —
Short-term bridge; refi at stabilization.
Rent comps 5 comps
| Address | Beds | Baths | Sqft | Rent | $/sqft | DOM | Units | Dist |
|---|---|---|---|---|---|---|---|---|
| 606 Springwood Dr Jacksonville, NC | 3.0 | 3.0 | 1069 | $1,500 | $1.40 | 23d | 1 | 0.09mi |
| 100 Delaney Dr Jacksonville, NC | 1.0–3.0 | 1.0–2.0 | 1150 | $1,440 | $1.25 | 15d | 11 | 0.33mi |
| 100 Windsor Cir Jacksonville, NC | 3.0 | 1.0–2.5 | 1033 | $1,469 | $1.42 | 15d | 11 | 1.11mi |
| 5049 Western Blvd Jacksonville, NC | 1.0–3.0 | 1.0–2.0 | 1118 | $1,419 | $1.27 | 15d | 1 | 1.28mi |
| 231A Lakewood Dr Jacksonville, NC | 2.0 | 1.0 | 880 | $1,095 | $1.24 | 23d | 1 | 1.37mi |
HOA detail
- Monthly dues
- $34 · $408/yr
Listing history 3 events
-
2026-06-21days on market $160,000 Active 2 DOM
-
2026-06-19remarks 699-char remark
-
2026-06-19$160,000 Active 1 DOM
ⓘ Source: listings_history table (triggers on properties + properties_extension) + one-shot
backfill from property_details.listing_events for pre-trigger history.
Tax reassessment forecast NC · Resets to sale price
- Current annual tax
- $1,424 · $119/mo
- Projected year-2 tax
- $1,424 · $119/mo
- Expected delta
- $0/yr ($0/mo · 0.0%)
ⓘ Screening estimate from a state-policy table — verify with the county assessor before closing.
Climate risk First Street
- Flood 4/10 Moderate FEMA zone X (unshaded) · 21% chance over 30 yrs
- Wildfire 5/10 Major
- Heat 9/10 Extreme 7 d/yr ≥107°F today · 18 d/yr by 30 yrs out
- Wind 8/10 Severe 97% chance of damaging wind over 30 yrs
- Air quality 3/10 Moderate 2 unhealthy d/yr today · 3 by 30 yrs out
Nearby sold comps map
Loading sold comps map…
Walkable amenities ~0.75 mi
Loading nearby amenities…
Taxation est. · year 1
- Rental income
- $17,149
- − Mortgage interest
- −$8,962
- − Property taxes
- −$1,424
- − Insurance
- −$800
- − Repairs & maintenance
- −$1,372
- − Management
- −$1,372
- − HOA
- −$408
- − Depreciation
- −$4,655
- Taxable loss
- −$1,844
- Est. tax savings @ 24.0%
- +$442
- After-tax cash flow
- $1,290/yr
For passive investors: Depreciation is non-cash, so a rental often shows a tax loss while cash-flowing — sheltering income. Rental losses are passive: they offset passive income freely, and up to $25,000/yr can offset ordinary (W-2) income if you actively participate and your MAGI is under $100k (phasing out to $0 by $150k); unused losses carry forward. On sale, claimed depreciation is recaptured at up to 25%, and gains may owe capital-gains tax (a 1031 exchange can defer both). Figures are a year-1 estimate at your 24.0% rate — not tax advice; consult a CPA.
Schools (NCES district)
- District
- Onslow County Schools
- NCES district ID
- 3703450
- Math proficiency
- 42% ▲ 6.00%
- Reading proficiency
- 49% ▲ 5.00%
- Median HH income
- $46,076
- Composite
- 38.66/100
- National rank
- #4148
- State rank
- #84 of 178 in NC
Livability — Jacksonville
- Score
- 71/100
- State rank
- #111
- US rank
- #6991
Category grades
Schools grade is shown separately in the Schools card above.
Census & demographics
- Census place
- Jacksonville, NC
- County
- Onslow County · 164,453 people
- City population
- 96,397
- Metro
- Jacksonville, NC
- Population (ZIP)
- 47,256
- Household income
- $63,561
- Rent vs Own
- Severe rent burden
- 1830.0
Population outlook (Onslow County) Hauer SSP2
- Today (2025)
- 189,789 people
- By 2030
- 194,463 · +2.5%
- By 2040
- 193,629 · +2.0%
- By 2050
- 193,248 · +1.8%
- By 2075
- 196,995 · +3.8%
- By 2100
- 201,513 · +6.2%
Race, ethnicity, and origin ACS 2023
- Neighborhood character
- Diverse neighborhood (Simpson 0.62)
- Race & ethnicity
- White 57% Black 18% Hispanic / Latino 16% Two or more races 13% Asian 2%
- Hispanic origin (detail)
- Mexican 5% Puerto Rican 5% Dominican 1%
- Common ancestry
- Romanian 1% Serbian 1% Slovak 1%
- Foreign-born
- 5% · Canada, South Korea
- Languages at home
- 89% English-only · Spanish 8% German/W. Germanic 1% Tagalog/Filipino 1%
Political lean MEDSL · Onslow
- 2024 margin
- Solid R (+35.9) · D 31.5% · R 67.5% · Other 1.0%
- 2008→2024 swing
- -14.5pp toward R · 2008: -21.5pp · 2024: -35.9pp
- All cycles
- 2024: R+35.9 2020: R+30.2 2016: R+34.6 2012: R+27.0 2008: R+21.5
Not yet ingested
- Civics
- —
Market trends
- HPI YoY
- ▼ -50.75%
- Current HPI
- 211.9993
- Rent YoY
- ▲ 3.86%
- Metro
- Jacksonville, NC
- State GDP YoY
- ▲ 3.28%
- F500 in state
- 26
Industry mix (Fortune 500 HQ in NC)
| Industry | F500 HQs | Revenue |
|---|---|---|
| Financial Services | 2 | $213B |
|
||
| Retail | 2 | $95B |
|
||
| Industrial Conglomerate | 1 | $38B |
|
||
| Metals / Steel | 1 | $35B |
|
||
| Utilities | 1 | $30B |
|
||
| Industrial Machinery | 1 | $19B |
|
||
Price history
+60.1% since first listed15 events — show timeline
- 2026-06-18 Listed $160,000 Hive MLS
- 2025-08-17 Rental Removed $1,200 APPFOLIO
- 2025-08-06 Listed for Rent $1,200 APPFOLIO
- 2025-08-05 Relisted — Hive MLS
- 2025-07-24 Pending — Hive MLS
- 2025-07-24 Listing Removed — Hive MLS
- 2025-07-07 Price Changed $160,000 Hive MLS
- 2025-06-15 Price Changed $170,000 Hive MLS
- 2025-06-06 Listed $180,000 Hive MLS
- 2023-07-18 Rental Removed — APPFOLIO
- 2021-10-29 Sold (Public Records) $112,000 Public Records
- 2021-10-28 Sold (MLS) $112,000 Hive MLS
- 2021-09-10 Listed $112,000 Hive MLS
- 2013-07-22 Listing Removed — Hive MLS
- 2012-12-03 Listed $99,957 Hive MLS
Property tax history
+0.9%/yrLatest (2025): $1,424 · +0.0% YoY. Source: county tax records.
Cash-flow waterfall
monthlySold comps — $/sqft
last 12 mo · ≤1 miLoading sold comps…