524 Barrington Rd · Longswamp, PA
Flood risk No data
- FEMA flood zone
- —
- Chance of flooding over 30 yrs
- —
- Est. flood insurance / yr
- —
Fire risk No data
- Est. fire insurance / yr
- —
Heat risk No data
- Hot days now (above threshold)
- —
- Hot days in 30 yrs
- —
Wind risk No data
- Chance of severe wind over 30 yrs
- —
Air-quality risk No data
- Unhealthy air days now
- —
- Unhealthy air days in 30 yrs
- —
Risk factors via First Street. Map © Google.
Why this score? — see what drove the C grade
The composite is a weighted blend of 9 inputs, each scored 0–100. Each bar is that input's sub-score; the figure is the points it added to the 100-point composite (weight × sub-score).
- Cash flow +27.7/30.0
- DSCR +9.8/10.0
- 1% rule +7.6/10.0
- Schools +5.2/10.0
- Condition / age +4.0/5.0
- Rent growth +2.5/5.0
- Livability +2.5/5.0
- ARV discount +0.0/15.0
- Appreciation +0.0/10.0
$195,435
🖨 Deal sheet (PDF) 📄 Offer letter ✓ Due diligence
Listing remarks
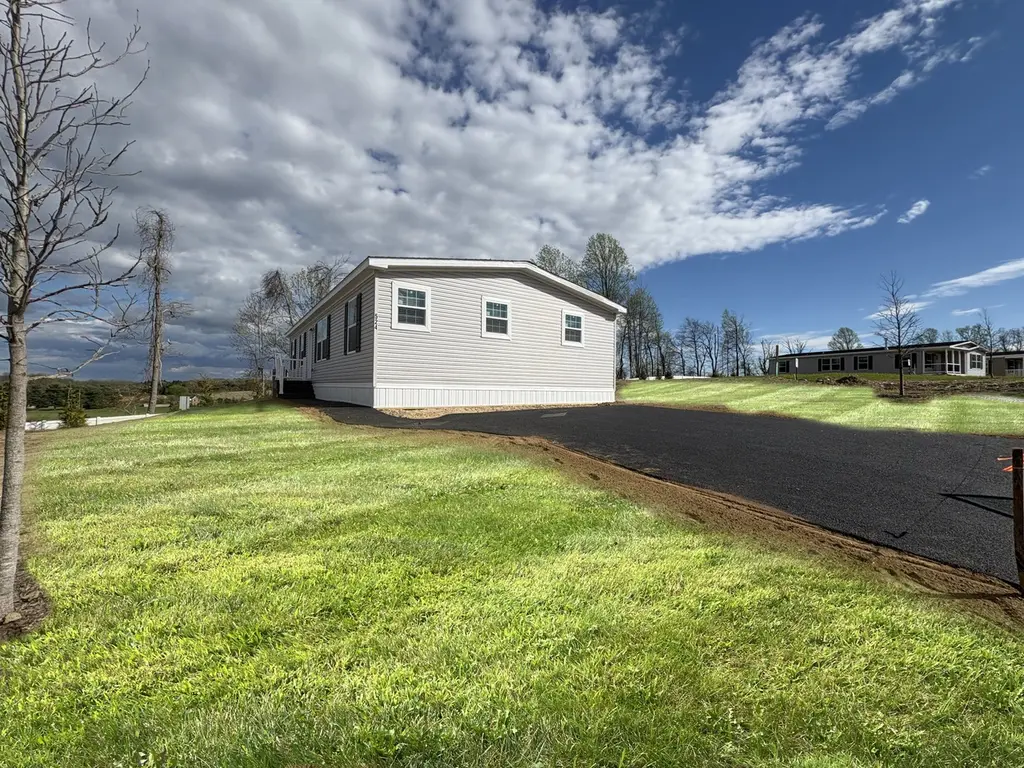
Welcome Home to 524 Barrington Road! Step into, modern living with this brand-new home offering 3 bedrooms, 2 baths, and approximately 1,387 sq. ft. of thoughtfully designed space. An open, airy layout creates a natural flow between the living, dining, and kitchen areas-perfect for both everyday routines and relaxed gatherings. Features 3 Bed & 2 Bath Open Living Space Designer Kitchen Wood Beam Accents Primary Suite with Walk-In Closet Spactios Walk-In Pantry Dedicated utility room with utility sink Additional Space added to Each of the Secondary Bedrooms Additional Space added in Primary Suite Paved Two Car Driveway
Key facts
- Built 2026
- Listed 54 days
Property features AI
Finance
- Other: Address: 524 Barrington Rd, Macungie, PA 18062; Status: Active
- Financial info: List price $195,435
Exterior
- Utilities: Natural gas; Central air
- Home design: Spec construction, Denali Grand plan
- Construction: Living area approximately 1387; Spec-built home
- Exterior features: Asphalt roof
Interior
- Kitchen: Dishwasher; Microwave; Refrigerator
- Bedrooms: 3 bedrooms
- Bathrooms: 2 bathrooms
- Heating & cooling: Natural gas forced air heating; Central air conditioning; Ceiling fan(s)
- Interior features: Dishwasher; Microwave; Refrigerator
Neighborhood map
What this means for you Summary
Snapshot
- This is a 3-bed/2.0-bath manufactured listed at $195k. Condition is rated good.
Deal economics
- At list price, monthly cash flow is $590 ($7k/yr) — positive.
- The deal already cash-flows at list — no discount required.
- Meets the 1% rule at list price ($2k rent vs $195k).
- Recommended offer: $190k (3.0% below list) — sets the bar for market timing.
Location & tenants
- Location reads: area grade C — affects rentability + tenant quality, not the cash-flow math above.
- Brandywine Heights Area SD (suburban): math 48% / reading 66% proficiency, ranked #241 of 658 in PA (top 37%) — acceptable for families but not a draw, mixed tenant base, ~2y average lease; only 20% free/reduced lunch — higher-income household profile.
- Zoned schools: Brandywine Heights El Sch (337 students, 30% FRL); Brandywine Heights Intrmd/Ms (math 50% / reading 70%, grade B, #46 of 512 statewide, top 9%, 501 students, 32% FRL); Brandywine Heights Hs (math 42% / reading 24%, grade F, #325 of 437 statewide, top 75%, 439 students, 22% FRL).
- Market conditions: Rents flat; 162 active listings in the ZIP; high-income renter base; 258 units permitted in Berks County in 2024 (27 in 5+ unit buildings).
Forward outlook
- Local home prices are declining (-3.0%/yr); year-one equity from $1k of loan paydown is wiped out by about $6k of value loss. Plan a longer hold.
- Berks County population projected at +3% by 2050 — modest demand growth; plan on rents tracking national, not racing it.
Negotiation context
- It's been on market 54 days — a 3% lower offer ($190k) is reasonable based on typical stale-listing flexibility.
Questions for the listing agent
- It's been on market 54 days. Have you received any prior offers? Is the seller open to a 3% concession, seller financing, or rate buy-down credit?
- Is there a deadline driving the sale (1031 exchange, divorce, estate, relocation)? That informs how much negotiation room exists.
- What's the average days-on-market for RENTAL listings here right now (not sales)? A rising rental-DOM trend means longer vacancies and softer asking-rent achievability than the comps imply.
- What's the recent tenant-quality profile in this submarket — average credit score on applications, eviction rate, late-payment / NSF rate, and stable-employment percentage? A property-management company in the area should have these aggregated.
- How much new for-sale + rental construction is in the pipeline within 1–3 miles? Heavy new supply typically softens prices + rents 12–24 months out; constrained supply supports both.
Investment metrics
- 1% rule
- 1.26% ✓
- Cap rate
- 9.92%
- Cash-on-cash
- 12.94%
- DSCR
- 1.58
- GRM
- 6.6
CMA / ARV
- ARV (median comp)
- $133,900
- List price
- $195,435
- Delta
- 45.96%
- Verdict
- OVERPRICED
- Comps
- 1 within 2.0 mi
Show comp detail 1 sale within ~0.75 mi
| Address | Dist | Beds/Ba | Sqft | Sold | Price | $/sf | Match |
|---|---|---|---|---|---|---|---|
| 194 Haddon Dr | 0.20mi | 3/2.0 | 1,344 (-3%) | 2mo | $133,900 | $100 | 84 |
Match score weights: distance 35% · size 25% · config 20% · recency 20%. Top-matched comps best support the ARV.
Projected returns pro-forma
-3.0% appreciation · 0.13% rent growth · sell at horizon
- IRR
- -0.5%
- Equity multiple
- 0.98×
- Total profit
- $-934
- Equity at exit
- $29,140
- IRR
- 5.9%
- Equity multiple
- 1.38×
- Total profit
- $21,024
- Equity at exit
- $16,898
Cash invested: $54,722 (down + closing). Projections, not guarantees.
Landlord ↔ Tenant lean methodology
- Overall (STATE)
- 62 Landlord-Friendly
- State Pennsylvania
- 62 Landlord-Friendly · EVEN
- County
- — inherits STATE
- City
- — inherits STATE
ZIP-level market 18062
- Home prices YoY
- -26.4%
- Rents YoY
- 0.1%
- Active inventory
- 162
- Price-to-rent
- 6.6×
Monthly cashflow live
- Estimated rent
- $2,457 medium interval (Pro) →
- Mortgage (P&I)
- −$1,025
- Tax est. 1.5%
- −$244 /mo · $2,932/yr
- Insurance
- −$81
- HOA
- −$0
- Vacancy / Maint / Mgmt
- −$516
- Net cashflow
- $590
Break-even live
Sensitivity live
| Price | -10% $725 | -5% $658 | +0% $590 | +5% $523 | +10% $455 |
|---|---|---|---|---|---|
| Rent | -10% $396 | -5% $493 | +0% $590 | +5% $687 | +10% $784 |
| Rate | -1.0pp $689 | -0.5pp $640 | base $590 | +0.5pp $540 | +1.0pp $488 |
UW: 25.0% down · 7.5% · 30yr · 1.5% tax · 5.0% vac · 8.0% maint · 8.0% mgmt
Financing live
Cash to close
- Down payment
- $48,859
- Closing costs
- $5,863
- Reserves months
- —
- Total cash needed
- —
Loan-product check · same deal, 3 products live
Conventional
25% down · 7.5% · 30yr
- Down + closing
- —
- Monthly P&I
- —
- Monthly cashflow
- —
- DSCR
- —
- Eligible?
- —
Personal DTI + credit; lowest rate.
DSCR
20% down · 8.5% · 30yr
- Down + closing
- —
- Monthly P&I
- —
- Monthly cashflow
- —
- DSCR
- —
- Eligible?
- —
No personal income docs; deal must DSCR.
Hard money
10% down · 12.0% · 12mo
- Down + closing
- —
- Monthly P&I
- —
- Monthly cashflow
- —
- DSCR
- —
- Eligible?
- —
Short-term bridge; refi at stabilization.
Listing history 18 events
-
2026-06-22days on market $195,435 Active 54 DOM
-
2026-06-18days on market $195,435 Active 51 DOM
-
2026-06-17days on market $195,435 Active 50 DOM
-
2026-06-16days on market $195,435 Active 49 DOM
-
2026-06-15days on market $195,435 Active 48 DOM
-
2026-06-14days on market $195,435 Active 46 DOM
-
2026-06-13days on market $195,435 Active 45 DOM
-
2026-06-10days on market $195,435 Active 43 DOM
-
2026-06-09days on market $195,435 Active 42 DOM
-
2026-06-08days on market $195,435 Active 41 DOM
-
2026-06-07days on market $195,435 Active 40 DOM
-
2026-06-05days on market $195,435 Active 37 DOM
-
2026-06-03days on market $195,435 Active 36 DOM
-
2026-06-02days on market $195,435 Active 35 DOM
-
2026-06-01days on market $195,435 Active 34 DOM
-
2026-05-31days on market $195,435 Active 33 DOM
-
2026-05-31days on market $195,435 Active 32 DOM
-
2026-04-28$195,435 Active 632-char remark
ⓘ Source: listings_history table (triggers on properties + properties_extension) + one-shot
backfill from property_details.listing_events for pre-trigger history.
Nearby sold comps map
Loading sold comps map…
Walkable amenities ~0.75 mi
Loading nearby amenities…
Taxation est. · year 1
- Rental income
- $29,482
- − Mortgage interest
- −$10,947
- − Property taxes
- −$2,932
- − Insurance
- −$977
- − Repairs & maintenance
- −$2,359
- − Management
- −$2,359
- − Depreciation
- −$5,685
- Taxable income
- $4,223
- Est. tax owed @ 24.0%
- −$1,014
- After-tax cash flow
- $6,070/yr
For passive investors: Depreciation is non-cash, so a rental often shows a tax loss while cash-flowing — sheltering income. Rental losses are passive: they offset passive income freely, and up to $25,000/yr can offset ordinary (W-2) income if you actively participate and your MAGI is under $100k (phasing out to $0 by $150k); unused losses carry forward. On sale, claimed depreciation is recaptured at up to 25%, and gains may owe capital-gains tax (a 1031 exchange can defer both). Figures are a year-1 estimate at your 24.0% rate — not tax advice; consult a CPA.
Condition & rehab AI · 12 photos
This modern manufactured home is in excellent condition with no visible repairs needed. It offers a good balance of aesthetics and functionality, making it a strong candidate for both resale and rental markets.
Value-add opportunities
- Both Painting the exterior and interior walls — Fresh paint enhances curb appeal and interior aesthetics.
- Both Landscaping improvements — Enhanced landscaping can increase both resale and rental value.
- Both Adding smart home features — Smart home features can increase both resale and rental value by making the home more modern and convenient.
Renovation cost estimate screening
Value-add ROI direction
- Both Painting the exterior and interior walls — Fresh paint enhances curb appeal and interior aesthetics. ↑
- Both Landscaping improvements — Enhanced landscaping can increase both resale and rental value. ↑
- Both Adding smart home features — Smart home features can increase both resale and rental value by making the home more modern and convenient. ↑
ⓘ Cost ranges are severity-bucket heuristics (US national rule-of-thumb). Get contractor quotes + a written scope before underwriting a rehab budget.
Schools (NCES district)
- District
- Brandywine Heights Area SD
- NCES district ID
- 4204050
- Math proficiency
- 48% ▲ 1.00%
- Reading proficiency
- 66% ▼ -1.00%
- Median HH income
- $62,904
- Composite
- 51.52/100
- National rank
- #3670
- State rank
- #241 of 658 in PA
Livability — Longswamp
No livability data for this city. (Only ~50 U.S. cities are tracked.)
Census & demographics
- County
- Lehigh County · 333,019 people
- Metro
- Allentown-Bethlehem-Easton, PA-NJ
- Population (ZIP)
- 27,110
- Household income
- $110,675
- Rent vs Own
- Severe rent burden
- 537.0
Population outlook (Berks County) Hauer SSP2
- Today (2025)
- 425,767 people
- By 2030
- 428,814 · +0.7%
- By 2040
- 433,463 · +1.8%
- By 2050
- 439,426 · +3.2%
- By 2075
- 478,647 · +12.4%
- By 2100
- 518,507 · +21.8%
Race, ethnicity, and origin ACS 2023
- Neighborhood character
- Predominantly White (77%)
- Race & ethnicity
- White 77% Hispanic / Latino 10% Two or more races 10% Asian 5% Black 3%
- Hispanic origin (detail)
- Puerto Rican 4% Dominican 2%
- Common ancestry
- Romanian 5% Lithuanian 2% Subsaharan African 2%
- Foreign-born
- 11% · Canada, China, Jamaica
- Languages at home
- 83% English-only · Spanish 7% Other Indo-European 4% French/Haitian/Cajun 2%
Political lean MEDSL · Berks
- 2024 margin
- R (+12.2) · D 43.4% · R 55.6%
- 2008→2024 swing
- -21.4pp toward R · 2008: 9.2pp · 2024: -12.2pp
- All cycles
- 2024: R+12.2 2020: R+8.2 2016: R+10.2 2012: R+0.6 2008: D+9.2
Not yet ingested
- Civics
- —
Market trends
- HPI YoY
- ▼ -91.04%
- Current HPI
- 253.5939
- Rent YoY
- ▲ 0.13%
- Metro
- Allentown-Bethlehem-Easton, PA-NJ
- State GDP YoY
- ▲ 1.68%
- F500 in state
- 34
Industry mix (Fortune 500 HQ in PA)
| Industry | F500 HQs | Revenue |
|---|---|---|
| Healthcare | 2 | $309B |
|
||
| Insurance | 2 | $27B |
|
||
| Telecommunications / Media | 1 | $124B |
|
||
| Industrial Distribution | 1 | $22B |
|
||
| Financial Services | 1 | $20B |
|
||
| Chemicals / Materials | 1 | $18B |
|
||
Cash-flow waterfall
monthlySold comps — $/sqft
last 12 mo · ≤1 miLoading sold comps…