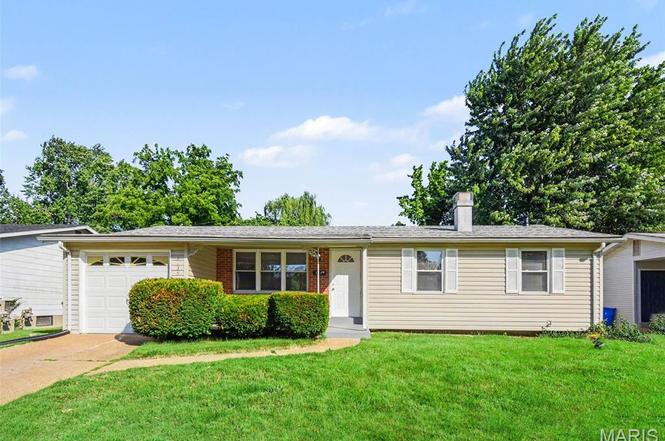
2125 Collier Dr · Florissant, MO
Flood risk 1/10 · Minimal
- FEMA flood zone
- X (unshaded)
- Chance of flooding over 30 yrs
- 0.0%
- Est. flood insurance / yr
- $473 – $860
Fire risk 1/10 · Minimal
- Est. fire insurance / yr
- $1,054 – $1,958
Heat risk 5/10 · Moderate
- Hot days now (above 105°F)
- 7 days/yr
- Hot days in 30 yrs
- 21 days/yr
Wind risk 2/10 · Minimal
- Chance of severe wind over 30 yrs
- 1.0%
Air-quality risk 3/10 · Minor
- Unhealthy air days now
- 3 days/yr
- Unhealthy air days in 30 yrs
- 5 days/yr
Risk factors via First Street. Map © Google.
Why this score? — see what drove the D grade
The composite is a weighted blend of 9 inputs, each scored 0–100. Each bar is that input's sub-score; the figure is the points it added to the 100-point composite (weight × sub-score).
- Cash flow +14.4/30.0
- ARV discount +7.5/15.0
- DSCR +4.4/10.0
- 1% rule +3.9/10.0
- Livability +3.7/5.0
- Rent growth +3.6/5.0
- Condition / age +2.5/5.0
- Schools +1.7/10.0
- Appreciation +0.0/10.0
$184,900
🖨 Deal sheet (PDF) 📄 Offer letter ✓ Due diligence
Listing remarks MLS
Beautiful open floor plan is featured in this majorly updated home! Vaulted Ceilings; recessed lighting, beautiful laminate flooring in spacious living and dining rooms. Totally remodeled kitchen with 42” maple cabinetry with easy-slide drawers, stainless steel appliances, marble basket-weave design backsplash, ceiling fan and beautiful stone look ceramic flooring. White six panel doors throughout. Updated thermal windows. Hall bath updated with pedestal sink, custom ceramic tile and more. Master features large closet, half bath w/oak vanity and updated flooring, ceiling fan. Need room to spread out? Don’t miss the fantastic finished lower level. Family room with custom bar and office/den. Plenty of storage too! Oversized garage, spacious patio, level fenced yard complete this beautiful home.
Key facts
- Black appliances
- Open floor plan
- Granite countertops
Tags
Property features AI
Exterior
- Parking: Attached garage (1-car)
- Utilities: Public water; Public sewer; Electric service (other); Underground utilities
- Home design: Single family residence; One level
- Construction: Brick and vinyl siding exterior; Composition shingle roof; Slab foundation
- Exterior features: Rain gutters
Interior
- Kitchen: Dishwasher; Range; Refrigerator
- Bedrooms: 3 bedrooms on the main level (sizes include 12x14, 10x10, 10x10)
- Flooring: Hardwood
- Bathrooms: 1 full bathroom; 1 half bathroom (main level)
- Heating & cooling: Forced air heating (natural gas); Central air conditioning (electric)
- Interior features: Storage; Partially finished basement; Wood-burning fireplace in basement (1)
- Laundry & utility: Utility space present
Neighborhood map
What this means for you Summary
Snapshot
- This is a 3-bed/1.5-bath single-family listed at $185k.
Deal economics
- At list price, monthly cash flow is $36 ($433/yr) — positive.
- The deal already cash-flows at list — no discount required.
- To meet the 1% rule (rent ≥ 1% of price), the offer needs to be $164k (11.5% below list).
- Recommended offer: $164k (11.5% below list) — sets the bar for 1% rule.
Location & tenants
- Location reads 73/100 on livability (#82 in MO) — a middle-class / working-renter tenant base. Strengths: cost of living A+, housing A+, health & safety B+; Watch: crime C-, amenities D+, commute F.
- Hazelwood (suburban): math 11% / reading 26% proficiency, ranked #306 of 324 in MO (top 94%) — low school quality limits family demand, transient renter base, plan for 1-2y turnover.
- Zoned schools: Walker Elem. (math 8% / reading 33%, grade F, #931 of 1,115 statewide, top 83%, 477 students, 67% FRL); Northwest Middle (math 18% / reading 26%, grade F, #332 of 391 statewide, top 86%, 767 students, 62% FRL); Hazelwood West High (math 16% / reading 42%, grade F, #407 of 521 statewide, top 78%, 2,042 students, 54% FRL).
- Market conditions: Rents rising fast (+4.3%/yr); 271 active listings in the ZIP; 34 comparable units currently listed for rent nearby; rentals at typical pace (median 14d on market — plan ~3-4 weeks tenant-placement turnaround); 920 units permitted in St. Louis County in 2024 (250 in 5+ unit buildings).
Forward outlook
- Local home prices are declining (-3.0%/yr); year-one equity from $1k of loan paydown is wiped out by about $6k of value loss. Plan a longer hold.
Negotiation context
- Only 5 days on market — expect competitive offers; lowballing is unlikely to land.
- 3 sale attempts since 14y ago with the ask held roughly flat each time — persistent listings suggest the price (not the market) is what's stuck; bring a comps-based counter.
- Current owner paid $153k; 21% above their basis — modest negotiation headroom, anchor on the comps not their cost.
Risks & watch-outs
- Climate carrying-cost: extreme-heat days projected 7→21/yr by 2055 (HVAC capex compounding) — expect insurance premiums to compound above CPI over the hold.
Questions for the listing agent
- Built in 1963 — when were the roof, HVAC, electrical panel, plumbing, and water heater last replaced?
- Is there a deadline driving the sale (1031 exchange, divorce, estate, relocation)? That informs how much negotiation room exists.
- Schools are D-rated, which usually means shorter tenancies and higher turnover. Who's the typical renter profile here, and what's been the actual vacancy rate?
- The area grade is low — what's the realistic commute time and amenity access for the typical tenant pool here? Any planned neighborhood developments (good or bad) we should know about?
- What's the average days-on-market for RENTAL listings here right now (not sales)? A rising rental-DOM trend means longer vacancies and softer asking-rent achievability than the comps imply.
- What's the recent tenant-quality profile in this submarket — average credit score on applications, eviction rate, late-payment / NSF rate, and stable-employment percentage? A property-management company in the area should have these aggregated.
- How much new for-sale + rental construction is in the pipeline within 1–3 miles? Heavy new supply typically softens prices + rents 12–24 months out; constrained supply supports both.
Investment metrics
- 1% rule
- 0.89% ✗
- Cap rate
- 6.53%
- Cash-on-cash
- 0.84%
- DSCR
- 1.04
- GRM
- 9.4
CMA / ARV
- ARV (on-the-fly)
- $184,800
- Comps found
- 12
Show comp detail 12 sales within ~0.75 mi
| Address | Dist | Beds/Ba | Sqft | Sold | Price | $/sf | Match |
|---|---|---|---|---|---|---|---|
| 1865 Violet Dr | 0.22mi | 3/1.5 | 1,064 (-3%) | 0mo | $100,000 | $94 | 84 |
| 750 Blackbird Dr | 0.27mi | 3/1.5 | 1,025 (-7%) | 1mo | $174,900 | $171 | 75 |
| 2052 Aristocrat Dr | 0.12mi | 3/1.5 | 960 (-13%) | 1mo | $89,900 | $94 | 72 |
| 660 Crabapple Ln | 0.35mi | 3/2.0 | 1,045 (-5%) | 2mo | $199,999 | $191 | 72 |
| 1285 Flamingo Dr | 0.29mi | 3/2.0 | 1,198 (+9%) | 1mo | $215,000 | $179 | 69 |
| 2328 Urbandale Dr | 0.36mi | 3/2.0 | 1,025 (-7%) | 1mo | $140,400 | $137 | 69 |
| 2465 Grants Pkwy | 0.34mi | 3/2.0 | 995 (-10%) | 2mo | $129,900 | $131 | 65 |
| 1398 Brenthaven Ln | 0.51mi | 3/2.0 | 1,025 (-7%) | 1mo | $185,000 | $180 | 62 |
| 880 Fifth Plz | 0.31mi | 4/1.0 (+1) | 980 (-11%) | 1mo | $159,000 | $162 | 60 |
| 2750 Robert Dr | 0.74mi | 3/1.5 | 1,064 (-3%) | 2mo | $169,000 | $159 | 58 |
| 390 Versailles Dr | 0.74mi | 3/1.5 | 1,040 (-6%) | 1mo | $174,900 | $168 | 56 |
| 1910 Flamingo Dr | 0.67mi | 3/1.0 | 1,025 (-7%) | 1mo | $199,500 | $195 | 54 |
Match score weights: distance 35% · size 25% · config 20% · recency 20%. Top-matched comps best support the ARV.
Projected returns pro-forma
-3.0% appreciation · 4.27% rent growth · sell at horizon
- IRR
- -13.6%
- Equity multiple
- 0.51×
- Total profit
- $-25,534
- Equity at exit
- $27,569
- IRR
- -2.8%
- Equity multiple
- 0.80×
- Total profit
- $-10,310
- Equity at exit
- $15,987
Cash invested: $51,772 (down + closing). Projections, not guarantees.
Landlord ↔ Tenant lean methodology
- Overall (STATE)
- 81 Strongly Landlord-Friendly
- State Missouri
- 81 Strongly Landlord-Friendly · R+10
- County
- — inherits STATE
- City
- — inherits STATE
ZIP-level market 63031
- Rents YoY
- 4.3%
- Active inventory
- 271
- Price-to-rent
- 9.4×
Monthly cashflow live
- Estimated rent
- $1,636 high interval (Pro) →
- Mortgage (P&I)
- −$970
- Tax from tax record
- −$210 /mo · $2,520/yr
- Insurance
- −$77
- HOA
- −$0
- Vacancy / Maint / Mgmt
- −$344
- Net cashflow
- $36
Break-even live
Sensitivity live
| Price | -10% $141 | -5% $88 | +0% $36 | +5% $-16 | +10% $-69 |
|---|---|---|---|---|---|
| Rent | -10% $-93 | -5% $-29 | +0% $36 | +5% $101 | +10% $165 |
| Rate | -1.0pp $129 | -0.5pp $83 | base $36 | +0.5pp $-12 | +1.0pp $-61 |
UW: 25.0% down · 7.5% · 30yr · 1.5% tax · 5.0% vac · 8.0% maint · 8.0% mgmt
Financing live
Cash to close
- Down payment
- $46,225
- Closing costs
- $5,547
- Reserves months
- —
- Total cash needed
- —
Loan-product check · same deal, 3 products live
Conventional
25% down · 7.5% · 30yr
- Down + closing
- —
- Monthly P&I
- —
- Monthly cashflow
- —
- DSCR
- —
- Eligible?
- —
Personal DTI + credit; lowest rate.
DSCR
20% down · 8.5% · 30yr
- Down + closing
- —
- Monthly P&I
- —
- Monthly cashflow
- —
- DSCR
- —
- Eligible?
- —
No personal income docs; deal must DSCR.
Hard money
10% down · 12.0% · 12mo
- Down + closing
- —
- Monthly P&I
- —
- Monthly cashflow
- —
- DSCR
- —
- Eligible?
- —
Short-term bridge; refi at stabilization.
Rent comps 34 comps
| Address | Beds | Baths | Sqft | Rent | $/sqft | DOM | Units | Dist |
|---|---|---|---|---|---|---|---|---|
| 1095 Humes Ln Florissant, MO | 3.0 | 1.5 | 1100 | $1,650 | $1.50 | 6d | 1 | 0.08mi |
| 1725 Fernbrook Ln Florissant, MO | 3.0 | 1.0 | 925 | $1,485 | $1.61 | 0d | 1 | 0.35mi |
| 1145 Swallow Ln Florissant, MO | 3.0 | 2.0 | 1288 | $1,645 | $1.28 | 4d | 1 | 0.36mi |
| 1395 Bluebird Dr Florissant, MO | 3.0 | 2.0 | 1168 | $1,599 | $1.37 | 18d | 1 | 0.37mi |
| 2160 Splendor Dr Florissant, MO | 3.0 | 2.0 | 1100 | $1,800 | $1.64 | 4d | 1 | 0.40mi |
| 855 Daniel Boone Dr Florissant, MO | 3.0 | 1.0 | 964 | $1,400 | $1.45 | 45d | 1 | 0.61mi |
| 1540 Aspen Dr Florissant, MO | 3.0 | 2.0 | 912 | $1,395 | $1.53 | 9d | 1 | 0.64mi |
| 1540 Aspen Dr Florissant, MO | 3.0 | 2.0 | 912 | $1,395 | $1.53 | 0d | 1 | 0.64mi |
| 775 Sherwood Dr Florissant, MO | 3.0 | 1.0 | 1023 | $1,690 | $1.65 | 45d | 1 | 0.67mi |
| 765 Babler Dr Florissant, MO | 3.0 | 2.0 | 888 | $1,700 | $1.91 | 9d | 1 | 0.69mi |
| 840 Dawnview Ct Florissant, MO | 3.0 | 1.5 | 750 | $900 | $1.20 | 25d | 1 | 0.70mi |
| 9 Charlotte Dr Florissant, MO | 3.0 | 1.5 | 1404 | $1,561 | $1.11 | 0d | 1 | 0.71mi |
| 470 Hundley Dr Florissant, MO | 3.0 | 2.0 | 962 | $1,595 | $1.66 | 45d | 1 | 0.71mi |
| 330 Moule Dr Florissant, MO | 3.0 | 1.0 | 1014 | $1,575 | $1.55 | 45d | 1 | 0.79mi |
| 2857 Dawnview Dr Florissant, MO | 3.0 | 1.0 | 890 | $1,325 | $1.49 | 9d | 1 | 0.81mi |
| 4 Sharon Ct Florissant, MO | 3.0 | 2.0 | 1108 | $1,800 | $1.62 | 0d | 1 | 0.82mi |
| 1315 Bobolink Dr Florissant, MO | 3.0 | 2.0 | 1025 | $1,700 | $1.66 | 14d | 1 | 0.84mi |
| 1015 Lindsay Ln Florissant, MO | 3.0 | 2.0 | 988 | $1,600 | $1.62 | 25d | 1 | 0.85mi |
| 2942 Chance Dr Florissant, MO | 3.0 | 1.0 | 912 | $1,700 | $1.86 | 14d | 1 | 0.93mi |
| 1545 Swan Dr Florissant, MO | 3.0 | 1.0 | 1064 | $1,590 | $1.49 | 9d | 1 | 0.97mi |
| 1710 Kay Dr Florissant, MO | 3.0 | 1.0 | 960 | $1,500 | $1.56 | 3d | 1 | 1.04mi |
| 2316 Millvalley Dr Florissant, MO | 3.0 | 3.0 | 1189 | $1,696 | $1.43 | 16d | 1 | 1.04mi |
| 2400 Teakwood Manor Dr Florissant, MO | 3.0 | 2.0 | 1380 | $1,725 | $1.25 | 45d | 1 | 1.11mi |
| 1505 Miller Dr Florissant, MO | 3.0 | 3.0 | 1246 | $1,750 | $1.40 | 0d | 1 | 1.14mi |
| 2245 Lindsay Ln Florissant, MO | 4.0 | 2.0 | 1466 | $1,800 | $1.23 | 18d | 1 | 1.15mi |
| 3015 Matlock Dr Florissant, MO | 3.0 | 1.0 | 950 | $1,475 | $1.55 | 45d | 1 | 1.17mi |
| 3 Champlain Ct Florissant, MO | 3.0 | 1.0 | 1100 | $1,600 | $1.45 | 45d | 1 | 1.18mi |
| 1095 Cedar Pl Florissant, MO | 3.0 | 1.5 | 1107 | $1,710 | $1.54 | 0d | 1 | 1.18mi |
| 9 Saint Celeste Dr Florissant, MO | 3.0 | 1.0 | 992 | $1,450 | $1.46 | 45d | 1 | 1.21mi |
| 10 Saint Celeste Dr Florissant, MO | 2.0 | 1.0 | 716 | $1,290 | $1.80 | 14d | 1 | 1.24mi |
| 13 Bruce Dr Unit Bruce 13-2 Florissant, MO | 2.0 | 1.0 | 880 | $975 | $1.11 | 45d | 1 | 1.46mi |
| 13 Bruce Dr Florissant, MO | 2.0 | 1.0 | 880 | $975 | $1.11 | 25d | 1 | 1.46mi |
| 14 Bruce Dr Unit Bruce 14-4 Florissant, MO | 2.0 | 1.0 | 880 | $975 | $1.11 | 45d | 1 | 1.47mi |
| 2485 Jenkee Dr Florissant, MO | 3.0 | 1.0 | 960 | $1,376 | $1.43 | 0d | 1 | 1.47mi |
Listing history 4 events
-
2026-06-21days on market $184,900 Active 5 DOM
-
2026-06-18days on market $184,900 Active 2 DOM
-
2026-06-17remarks 503-char remark
-
2026-06-17$184,900 Active 1 DOM
ⓘ Source: listings_history table (triggers on properties + properties_extension) + one-shot
backfill from property_details.listing_events for pre-trigger history.
Tax reassessment forecast MO · Resets to sale price
- Current annual tax
- $2,520 · $210/mo
- Projected year-2 tax
- $2,520 · $210/mo
- Expected delta
- $0/yr ($0/mo · 0.0%)
ⓘ Screening estimate from a state-policy table — verify with the county assessor before closing.
Climate risk First Street
- Flood 1/10 Low FEMA zone X (unshaded) · 0% chance over 30 yrs
- Wildfire 1/10 Low
- Heat 5/10 Major 7 d/yr ≥105°F today · 21 d/yr by 30 yrs out
- Wind 2/10 Low 100% chance of damaging wind over 30 yrs
- Air quality 3/10 Moderate 3 unhealthy d/yr today · 5 by 30 yrs out
Nearby sold comps map
Loading sold comps map…
Walkable amenities ~0.75 mi
Loading nearby amenities…
Taxation est. · year 1
- Rental income
- $19,637
- − Mortgage interest
- −$10,357
- − Property taxes
- −$2,520
- − Insurance
- −$924
- − Repairs & maintenance
- −$1,571
- − Management
- −$1,571
- − Depreciation
- −$5,379
- Taxable loss
- −$2,686
- Est. tax savings @ 24.0%
- +$645
- After-tax cash flow
- $1,078/yr
For passive investors: Depreciation is non-cash, so a rental often shows a tax loss while cash-flowing — sheltering income. Rental losses are passive: they offset passive income freely, and up to $25,000/yr can offset ordinary (W-2) income if you actively participate and your MAGI is under $100k (phasing out to $0 by $150k); unused losses carry forward. On sale, claimed depreciation is recaptured at up to 25%, and gains may owe capital-gains tax (a 1031 exchange can defer both). Figures are a year-1 estimate at your 24.0% rate — not tax advice; consult a CPA.
Schools (NCES district)
- District
- Hazelwood
- NCES district ID
- 2913830
- Math proficiency
- 11% ▼ -13.00%
- Reading proficiency
- 26% ▼ -6.00%
- Median HH income
- $51,621
- Composite
- 16.77/100
- National rank
- #9156
- State rank
- #306 of 324 in MO
Livability — Florissant
- Score
- 73/100
- State rank
- #82
- US rank
- #5406
Category grades
Schools grade is shown separately in the Schools card above.
Census & demographics
- Census place
- Florissant, MO
- County
- Saint Louis County · 888,823 people
- City population
- 69,104
- Metro
- St. Louis, MO-IL
- Population (ZIP)
- 50,196
- Household income
- $70,811
- Rent vs Own
- Severe rent burden
- 1279.0
Population outlook (St. Louis County) Hauer SSP2
- Today (2025)
- 1,025,227 people
- By 2030
- 1,028,023 · +0.3%
- By 2040
- 1,020,940 · -0.4%
- By 2050
- 1,007,280 · -1.8%
- By 2075
- 987,277 · -3.7%
- By 2100
- 921,984 · -10.1%
Race, ethnicity, and origin ACS 2023
- Neighborhood character
- Diverse neighborhood (Simpson 0.58)
- Race & ethnicity
- White 49% Black 41% Two or more races 7% Hispanic / Latino 2%
- Common ancestry
- Romanian 3% Lithuanian 3% Swedish 1%
- Foreign-born
- 5% · Canada, Jamaica
- Languages at home
- 94% English-only · Spanish 2% Arabic 1%
Political lean MEDSL · St. Louis
- 2024 margin
- Strong D (+23.4) · D 60.8% · R 37.4% · Other 1.7%
- 2008→2024 swing
- +3.5pp toward D · 2008: 19.9pp · 2024: 23.4pp
- All cycles
- 2024: D+23.4 2020: D+24.0 2016: D+16.2 2012: D+13.7 2008: D+19.9
Not yet ingested
- Civics
- —
Market trends
- HPI YoY
- ▼ -223.57%
- Current HPI
- 202.7192
- Rent YoY
- ▲ 4.27%
- Metro
- St. Louis, MO-IL
- State GDP YoY
- ▲ 1.84%
- F500 in state
- 20
Industry mix (Fortune 500 HQ in MO)
| Industry | F500 HQs | Revenue |
|---|---|---|
| Healthcare | 1 | $163B |
|
||
| Insurance | 1 | $21B |
|
||
| Industrial Technology | 1 | $17B |
|
||
| Retail | 1 | $16B |
|
||
| Industrial Distribution | 1 | $10B |
|
||
| Utilities | 1 | $9B |
|
||
Price history
+285.2% since first listed12 events — show timeline
- 2026-06-16 Listed $184,900 MARIS as Distributed by MLS Grid
- 2021-07-30 Sold (Public Records) $153,000 Public Records
- 2021-07-20 Sold (MLS) — MARIS as Distributed by MLS Grid
- 2021-06-26 Pending — MARIS as Distributed by MLS Grid
- 2021-06-24 Listed $149,000 MARIS as Distributed by MLS Grid
- 2012-09-26 Sold (Public Records) $87,500 Public Records
- 2012-09-21 Sold (MLS) — MARIS as Distributed by MLS Grid
- 2012-02-14 Listed $87,500 MARIS as Distributed by MLS Grid
- 2001-08-16 Sold (Public Records) $91,500 Public Records
- 1993-08-26 Sold (Public Records) $72,000 Public Records
- 1981-01-01 Sold (Public Records) — Public Records
- 1981-01-01 Sold (Public Records) $48,000 Public Records
Property tax history
+5.8%/yrLatest (2022): $2,520 · +2.7% YoY. Source: county tax records.
Cash-flow waterfall
monthlySold comps — $/sqft
last 12 mo · ≤1 miLoading sold comps…