 6-Plex
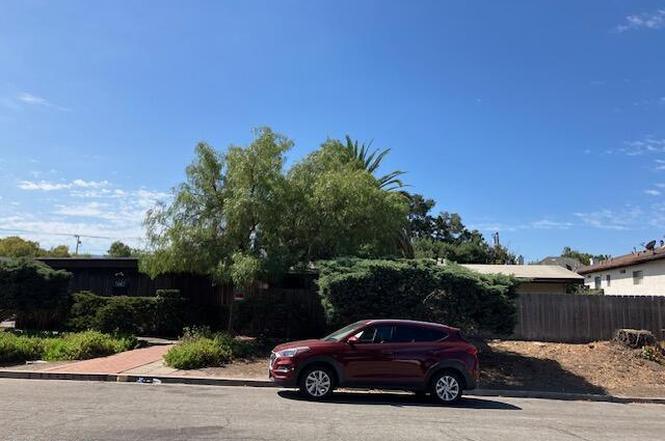
1662 Eucalyptus Dr · Solvang, CA
Flood risk 1/10 · Minimal
- FEMA flood zone
- X (unshaded)
- Chance of flooding over 30 yrs
- 0.0%
- Est. flood insurance / yr
- $507 – $1,088
Fire risk 6/10 · Moderate
- Est. fire insurance / yr
- $659 – $1,223
Heat risk 3/10 · Minor
- Hot days now (above 93°F)
- 7 days/yr
- Hot days in 30 yrs
- 17 days/yr
Wind risk 1/10 · Minimal
- Chance of severe wind over 30 yrs
- —
Air-quality risk 6/10 · Moderate
- Unhealthy air days now
- 8 days/yr
- Unhealthy air days in 30 yrs
- 8 days/yr
Risk factors via First Street. Map © Google.
Why this score? — see what drove the D grade
The composite is a weighted blend of 9 inputs, each scored 0–100. Each bar is that input's sub-score; the figure is the points it added to the 100-point composite (weight × sub-score).
- Cash flow +14.2/30.0
- ARV discount +7.5/15.0
- Schools +4.8/10.0
- DSCR +4.3/10.0
- Livability +3.8/5.0
- 1% rule +2.6/10.0
- Rent growth +2.5/5.0
- Condition / age +2.5/5.0
- Appreciation +0.0/10.0
$3,299,000
🖨 Deal sheet (PDF) 📄 Offer letter ✓ Due diligence
Multi-family units
County records classify this as Multi-Family (5+ Unit). Listing-text estimate: 6 units. confirmed
5+ unit building — per-unit beds/baths from public records are typically unavailable; the breakdown below (if shown) is an estimate from the listing text.
Listing remarks
Great 11+ unit Multi family Investor opportunity, plus a separate free standing residence located on Laurel Ave. in Solvang. Zoning is R/3, Cities highest density designation, giving the investor the possibility to add additional units on this over one acre parcel. 5 ground level two bed/1 bath units, 6 - 1 bedroom/ 1 bath units(3 upstairs, 3 downstairs), plus detached free standing 2 bedroom, 1 bath residence. 10 space parking structure and common coin-op laundry area. Close to town & schools.
Key facts
- Over one acre parcel
- Zoning is r/3
- 1.1 acre lot
Tags
Property features AI
Finance
- Other:
- Financial info: Operating expenses include insurance, maintenance, water/sewer, electricity, trash, and legal; Owner pays electricity, trash collection, water, gardener, taxes, and insurance; Tenants pay gas, electricity, and cable TV; Vacancy allowance rate listed as 0%
- HOA & community:
Exterior
- Parking: Covered parking; On-street parking; 6–10 parking spaces
- Security:
- Utilities: Public water; Public sewer; Cable available
- Home design: Multi-family property
- Construction: Stucco construction; Composition roof
- Exterior features: Patio; Raised and slab foundation
Interior
- Kitchen:
- Bedrooms: Six 1-bedroom units; Six 2-bedroom units
- Flooring:
- Bathrooms: Twelve full bathrooms total (units each have full baths)
- Heating & cooling: Forced-air heating; Wall furnace heating
- Interior features: Common-area laundry with coin-operated machines and leased laundry equipment; Six 1-bedroom units and six 2-bedroom units (12 units total)
- Laundry & utility: Common-area coin-operated laundry, leased equipment
Neighborhood map
What this means for you Summary
Snapshot
- This is a 6 × 3-bed/2.0-bath units multifamily listed at $3.30M.
Deal economics
- At list price, monthly cash flow is $528 ($6k/yr) — positive. Per door: $88/mo.
- The deal already cash-flows at list — no discount required.
- To meet the 1% rule (rent ≥ 1% of price), the offer needs to be $2.50M (24.1% below list).
- Recommended offer: $2.50M (24.1% below list) — sets the bar for 1% rule.
- Cap rate 6.5% vs local median 2.3% in Solvang — top-decile yield for the area; either an underpriced asset or a hidden risk that comps aren't pricing in. Stress-test before assuming the spread holds.
Location & tenants
- Location reads 76/100 on livability (#96 in CA, #3,502 nationally) — a middle-class / working-renter tenant base. Strengths: crime A+, employment A+, health & safety A+; Watch: housing C-, commute D, cost of living F.
- Solvang Elementary (town): math 46% / reading 63% proficiency, ranked #104 of 517 in CA (top 20%) — acceptable for families but not a draw, mixed tenant base, ~2y average lease.
- Zoned schools: Solvang Elementary (math 46% / reading 63%, grade C, #311 of 1,571 statewide, top 21%, 593 students, 39% FRL); Santa Ynez Valley Union High (847 students, 24% FRL) — zoned schools at 32% FRL track the district average.
- Market conditions: 73 active listings in the ZIP; high-income renter base; 719 units permitted in Santa Barbara County in 2024 (217 in 5+ unit buildings).
- At $25,030/mo this rent would consume 253% of the median local household income ($118k/yr) (locally 394% of renters already pay >50% of income on rent) — very limited rent-growth headroom before tenants either downsize or default.
Forward outlook
- Local home prices are declining (-3.0%/yr); year-one equity from $23k of loan paydown is wiped out by about $99k of value loss. Plan a longer hold.
- Santa Barbara County population projected at +20% by 2050 — long-run rental-demand tailwind backs the buy-and-hold thesis.
Negotiation context
- It's been on market 298 days — a 12% lower offer ($2.90M) is reasonable based on typical stale-listing flexibility.
Risks & watch-outs
- Climate carrying-cost: major wildfire risk — expect insurance premiums to compound above CPI over the hold.
Questions for the listing agent
- It's been on market 298 days. Have you received any prior offers? Is the seller open to a 24% concession, seller financing, or rate buy-down credit?
- Can we see the unit-by-unit rent roll, current vacancy, and any below-market leases? What's the average tenancy length?
- What capital expenditures (roof, boiler, parking lot, exteriors) have been made in the last 5 years, and what's planned in the next 2?
- Built in 1962 — when were the roof, HVAC, electrical panel, plumbing, and water heater last replaced?
- Why hasn't it sold? Are there any deal-killer items the seller is aware of (foundation, flood, title, zoning, code violations)?
- Is there a deadline driving the sale (1031 exchange, divorce, estate, relocation)? That informs how much negotiation room exists.
- Schools are A-rated — typically a magnet for longer-tenancy family renters. What's the average tenant stay here, and is there a school-zone premium baked into asking?
- The area grade is low — what's the realistic commute time and amenity access for the typical tenant pool here? Any planned neighborhood developments (good or bad) we should know about?
- What's the average days-on-market for RENTAL listings here right now (not sales)? A rising rental-DOM trend means longer vacancies and softer asking-rent achievability than the comps imply.
- What's the recent tenant-quality profile in this submarket — average credit score on applications, eviction rate, late-payment / NSF rate, and stable-employment percentage? A property-management company in the area should have these aggregated.
- How much new apartment / multifamily construction is in the pipeline within 1–3 miles? Heavy new supply (>2% of stock underway) typically softens rents 12–24 months out; light construction supports rent growth.
Investment metrics
- 1% rule
- 0.76% ✗
- Cap rate
- 6.49%
- Cash-on-cash
- 0.69%
- DSCR
- 1.03
- GRM
- 11.0
CMA / ARV
No comps found within radius.
Projected returns pro-forma
-3.0% appreciation · 3.0% rent growth · sell at horizon
- IRR
- -15.3%
- Equity multiple
- 0.46×
- Total profit
- $-502,741
- Equity at exit
- $491,892
- IRR
- -6.8%
- Equity multiple
- 0.57×
- Total profit
- $-401,792
- Equity at exit
- $285,237
Cash invested: $923,720 (down + closing). Projections, not guarantees.
Landlord ↔ Tenant lean methodology
- Overall (STATE)
- 18 Strongly Tenant-Friendly
- State California
- 18 Strongly Tenant-Friendly · D+13
- County
- — inherits STATE
- City
- — inherits STATE
ZIP-level market 93463
- Active inventory
- 73
- Price-to-rent
- 65.9×
Monthly cashflow live
- Estimated rent
- $25,030 high interval (Pro) →
- Mortgage (P&I)
- −$17,300
- Tax from tax record
- −$571 /mo · $6,847/yr
- Insurance
- −$1,375
- HOA
- −$0
- Lot rent
- −$0
- Vacancy / Maint / Mgmt
- −$5,256
- Net cashflow
- $528
Break-even live
Sensitivity live
| Price | -10% $2,396 | -5% $1,462 | +0% $528 | +5% $-4,165 | +10% $-5,305 |
|---|---|---|---|---|---|
| Rent | -10% $-1,449 | -5% $-460 | +0% $528 | +5% $1,517 | +10% $2,506 |
| Rate | -1.0pp $2,190 | -0.5pp $1,367 | base $528 | +0.5pp $-327 | +1.0pp $-1,196 |
6-unit breakdown (identical units grouped — click to expand)
| Units | Beds | Baths | Est. rent |
|---|---|---|---|
| 6× units | 3 | 2 | $25,032 |
| #1 | 3 | 2 | $4,172 |
| #2 | 3 | 2 | $4,172 |
| #3 | 3 | 2 | $4,172 |
| #4 | 3 | 2 | $4,172 |
| #5 | 3 | 2 | $4,172 |
| #6 | 3 | 2 | $4,172 |
| Total (6 units) | $25,030 | ||
UW: 25.0% down · 7.5% · 30yr · 1.5% tax · 5.0% vac · 8.0% maint · 8.0% mgmt
Financing live
Cash to close
- Down payment
- $824,750
- Closing costs
- $98,970
- Reserves months
- —
- Total cash needed
- —
Loan-product check · same deal, 3 products live
Conventional
25% down · 7.5% · 30yr
- Down + closing
- —
- Monthly P&I
- —
- Monthly cashflow
- —
- DSCR
- —
- Eligible?
- —
Personal DTI + credit; lowest rate.
DSCR
20% down · 8.5% · 30yr
- Down + closing
- —
- Monthly P&I
- —
- Monthly cashflow
- —
- DSCR
- —
- Eligible?
- —
No personal income docs; deal must DSCR.
Hard money
10% down · 12.0% · 12mo
- Down + closing
- —
- Monthly P&I
- —
- Monthly cashflow
- —
- DSCR
- —
- Eligible?
- —
Short-term bridge; refi at stabilization.
Listing history 19 events
-
2026-06-23days on market $3,299,000 Active 298 DOM
-
2026-06-22days on market $3,299,000 Active 297 DOM
-
2026-06-18days on market $3,299,000 Active 294 DOM
-
2026-06-17days on market $3,299,000 Active 293 DOM
-
2026-06-16days on market $3,299,000 Active 292 DOM
-
2026-06-15days on market $3,299,000 Active 291 DOM
-
2026-06-14pricedays on market $3,299,000 Active 289 DOM
-
2026-06-10days on market $3,499,000 Active 286 DOM
-
2026-06-09days on market $3,499,000 Active 285 DOM
-
2026-06-08days on market $3,499,000 Active 284 DOM
-
2026-06-07days on market $3,499,000 Active 283 DOM
-
2026-06-05days on market $3,499,000 Active 280 DOM
-
2026-06-03days on market $3,499,000 Active 279 DOM
-
2026-06-02days on market $3,499,000 Active 278 DOM
-
2026-06-01days on market $3,499,000 Active 277 DOM
-
2026-05-31days on market $3,499,000 Active 276 DOM
-
2026-05-30days on market $3,499,000 Active 275 DOM
-
2025-12-02price $3,499,000
-
2025-08-28$3,800,000 Active
ⓘ Source: listings_history table (triggers on properties + properties_extension) + one-shot
backfill from property_details.listing_events for pre-trigger history.
Tax reassessment forecast CA · Resets to sale price
- Current annual tax
- $6,847 · $571/mo
- Projected year-2 tax
- $25,072 · $2,089/mo
- Expected delta
- +$18,226/yr (+$1,519/mo · 266.2%)
ⓘ Screening estimate from a state-policy table — verify with the county assessor before closing.
Climate risk First Street
- Flood 1/10 Low FEMA zone X (unshaded) · 0% chance over 30 yrs
- Wildfire 6/10 Major
- Heat 3/10 Moderate 7 d/yr ≥93°F today · 17 d/yr by 30 yrs out
- Wind 1/10 Low
- Air quality 6/10 Major 8 unhealthy d/yr today · 8 by 30 yrs out
Nearby sold comps map
Loading sold comps map…
Walkable amenities ~0.75 mi
Loading nearby amenities…
Taxation est. · year 1
- Rental income
- $300,360
- − Mortgage interest
- −$184,795
- − Property taxes
- −$6,847
- − Insurance
- −$16,495
- − Repairs & maintenance
- −$24,029
- − Management
- −$24,029
- − Depreciation
- −$95,971
- Taxable loss
- −$51,805
- Est. tax savings @ 24.0%
- +$12,433
- After-tax cash flow
- $18,772/yr
For passive investors: Depreciation is non-cash, so a rental often shows a tax loss while cash-flowing — sheltering income. Rental losses are passive: they offset passive income freely, and up to $25,000/yr can offset ordinary (W-2) income if you actively participate and your MAGI is under $100k (phasing out to $0 by $150k); unused losses carry forward. On sale, claimed depreciation is recaptured at up to 25%, and gains may owe capital-gains tax (a 1031 exchange can defer both). Figures are a year-1 estimate at your 24.0% rate — not tax advice; consult a CPA.
Schools (NCES district)
- District
- Solvang Elementary
- NCES district ID
- 0637110
- Math proficiency
- 46% ▼ -22.00%
- Reading proficiency
- 63% ▼ -5.00%
- Median HH income
- $65,321
- Composite
- 47.91/100
- National rank
- #2211
- State rank
- #104 of 517 in CA
Livability — Solvang
- Score
- 76/100
- State rank
- #96
- US rank
- #3502
Category grades
Schools grade is shown separately in the Schools card above.
Census & demographics
- Census place
- Solvang, CA
- County
- Santa Barbara County · 410,380 people
- City population
- 8,130
- Metro
- Santa Maria-Santa Barbara, CA
- Population (ZIP)
- 8,130
- Household income
- $118,488
- Rent vs Own
- Severe rent burden
- 394.0
Population outlook (Santa Barbara County) Hauer SSP2
- Today (2025)
- 484,679 people
- By 2030
- 505,323 · +4.3%
- By 2040
- 545,783 · +12.6%
- By 2050
- 584,263 · +20.5%
- By 2075
- 682,586 · +40.8%
- By 2100
- 723,188 · +49.2%
Race, ethnicity, and origin ACS 2023
- Neighborhood character
- Predominantly White (71%)
- Race & ethnicity
- White 71% Hispanic / Latino 19% Two or more races 14% Asian 3%
- Hispanic origin (detail)
- Mexican 16%
- Common ancestry
- Slovak 5% Lithuanian 3% Iranian 2%
- Foreign-born
- 15% · Canada, China, Dominican Republic
- Languages at home
- 77% English-only · Spanish 15% Chinese 2% Arabic 2%
Political lean MEDSL · Santa Barbara
- 2024 margin
- Strong D (+26.7) · D 61.8% · R 35.1% · Other 3.1%
- 2008→2024 swing
- +3.8pp toward D · 2008: 22.9pp · 2024: 26.7pp
- All cycles
- 2024: D+26.7 2020: D+32.1 2016: D+28.2 2012: D+17.1 2008: D+22.9
Not yet ingested
- Civics
- —
Market trends
- HPI YoY
- ▼ -273.23%
- Current HPI
- 324.7536
- Rent YoY
- —
- Metro
- Santa Maria-Santa Barbara, CA
- State GDP YoY
- ▲ 3.21%
- F500 in state
- 116
Industry mix (Fortune 500 HQ in CA)
| Industry | F500 HQs | Revenue |
|---|---|---|
| Technology | 27 | $1,492B |
|
||
| Financial Services | 3 | $174B |
|
||
| Retail | 3 | $44B |
|
||
| Insurance | 3 | $26B |
|
||
| Media / Entertainment | 2 | $115B |
|
||
| Pharmaceuticals / Biotech | 2 | $62B |
|
||
Price history
-7.9% since first listed2 events — show timeline
- 2025-12-02 Price Changed $3,499,000 NSBCRMLS
- 2025-08-28 Listed $3,800,000 NSBCRMLS
Property tax history
+0.6%/yrLatest (2025): $6,847 · +1.8% YoY. Source: county tax records.
Cash-flow waterfall
monthlySold comps — $/sqft
last 12 mo · ≤1 miLoading sold comps…