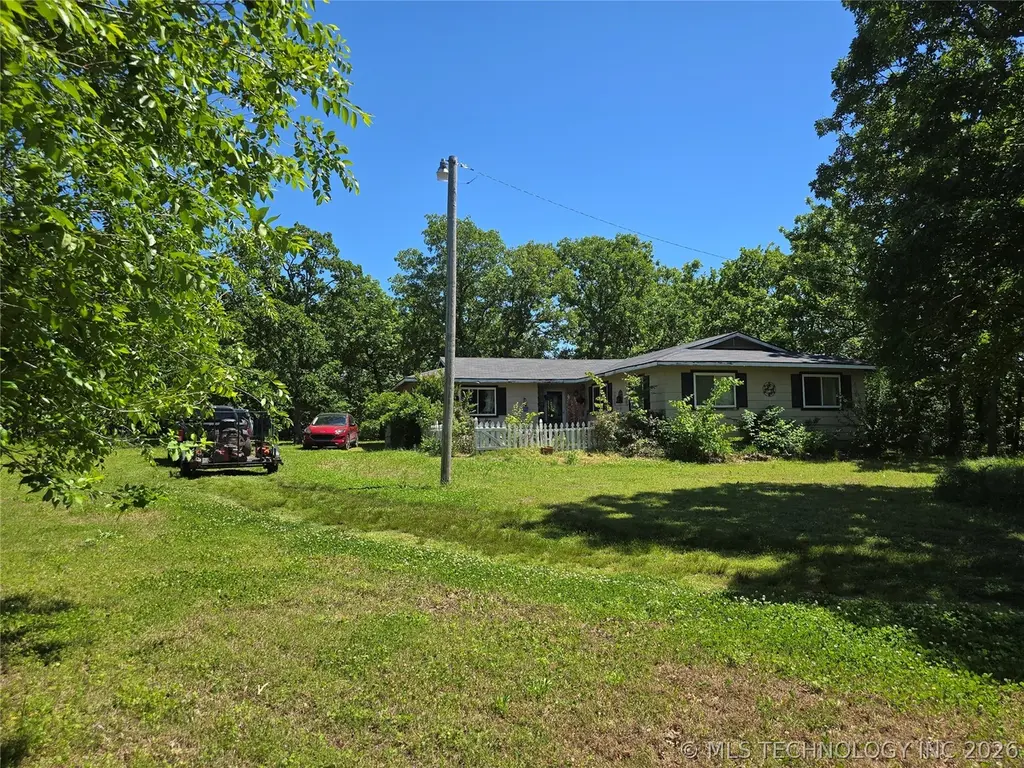
14501 E 202nd St S · Bixby, OK
Flood risk 1/10 · Minimal
- FEMA flood zone
- X (unshaded)
- Chance of flooding over 30 yrs
- 0.0%
- Est. flood insurance / yr
- $507 – $1,088
Fire risk 7/10 · Major
- Est. fire insurance / yr
- $2,463 – $4,575
Heat risk 6/10 · Moderate
- Hot days now (above 110°F)
- 7 days/yr
- Hot days in 30 yrs
- 19 days/yr
Wind risk 2/10 · Minimal
- Chance of severe wind over 30 yrs
- 4.0%
Air-quality risk 3/10 · Minor
- Unhealthy air days now
- 2 days/yr
- Unhealthy air days in 30 yrs
- 3 days/yr
Risk factors via First Street. Map © Google.
Why this score? — see what drove the C grade
The composite is a weighted blend of 9 inputs, each scored 0–100. Each bar is that input's sub-score; the figure is the points it added to the 100-point composite (weight × sub-score).
- Cash flow +23.1/30.0
- ARV discount +10.9/15.0
- DSCR +7.4/10.0
- 1% rule +5.5/10.0
- Livability +3.6/5.0
- Schools +3.5/10.0
- Rent growth +3.3/5.0
- Condition / age +2.5/5.0
- Appreciation +0.0/10.0
$210,000
🖨 Deal sheet 📄 Offer letter ✓ Due diligence
Listing remarks
Come see this 4.99 acre property with a 4 bedroom 2 bath home. Property has cross fencing/paneling and loafing shed. Circle gravel drive. Secluded off the main road. Older garage/shop that needs repair. Home will need some repairs but is a livable. AC system needs serviced as owner has been told the Freon is obsolete. Possible heat pump. Good opportunity to make this home into your perfect place to call home off the beaten path.
Key facts
- Older garage shop
- Circle gravel drive
- Loafing shed
Tags
Property features AI
Exterior
- Parking: Gravel driveway
- Security: No safety shelter
- Utilities: Electricity available; Water available (rural); Septic tank
- Home design: Single-story home; Faces northeast; Crawlspace foundation
- Construction: Built with Masonite and wood siding on wood frame; Asphalt/fiberglass roof
- Exterior features: Gravel driveway; Shed(s); Barbed wire and cross fencing; Farm/ranch setting with mature trees and wooded areas; Horses allowed
Interior
- Kitchen: Oven; Range; Stove; Disposal; Laminate counters
- Flooring: Carpet
- Bathrooms: 2 full bathrooms
- Heating & cooling: Propane heating; Radiant heating; Window cooling units
- Interior features: Vinyl, insulated and storm windows; Insulated doors; Laminate counters; Electric oven and range connections; Disposal; Electric water heater
- Laundry & utility: Washer hookup; Electric dryer hookup
Neighborhood map
What this means for you Summary
Snapshot
- This is a 4-bed/1.0-bath single-family listed at $210k.
Deal economics
- At list price, monthly cash flow is $377 ($5k/yr) — positive.
- The deal already cash-flows at list — no discount required.
- Meets the 1% rule at list price ($2k rent vs $210k).
- Cap rate 8.4% vs local median 3.6% in Bixby — top-decile yield for the area; either an underpriced asset or a hidden risk that comps aren't pricing in. Stress-test before assuming the spread holds.
Location & tenants
- Location reads 72/100 on livability (#24 in OK) — a middle-class / working-renter tenant base. Strengths: crime A+, employment A+, housing A+; Watch: amenities F, commute F, health & safety F.
- Bixby (suburban): math 39% / reading 36% proficiency, ranked #15 of 270 in OK (top 6%) — families likely to look elsewhere, expect single-tenant / working-renter base with shorter leases; only 19% free/reduced lunch — higher-income household profile.
- Market conditions: Rents rising (+3.3%/yr); 789 active listings in the ZIP; solid renter incomes; 581 units permitted in Wagoner County in 2024 (0 in 5+ unit buildings).
Forward outlook
- Local home prices are declining (-3.0%/yr); year-one equity from $1k of loan paydown is wiped out by about $6k of value loss. Plan a longer hold.
- Wagoner County population projected at +16% by 2050 — long-run rental-demand tailwind backs the buy-and-hold thesis.
Negotiation context
- Only 13 days on market — expect competitive offers; lowballing is unlikely to land.
- Current owner paid $147k; 43% above their basis — modest negotiation headroom, anchor on the comps not their cost.
Risks & watch-outs
- Climate carrying-cost: major wildfire risk; extreme-heat days projected 7→19/yr by 2055 (HVAC capex compounding) — expect insurance premiums to compound above CPI over the hold.
Questions for the listing agent
- Built in 1972 — when were the roof, HVAC, electrical panel, plumbing, and water heater last replaced?
- Is there a deadline driving the sale (1031 exchange, divorce, estate, relocation)? That informs how much negotiation room exists.
- Schools are B-rated — typically a magnet for longer-tenancy family renters. What's the average tenant stay here, and is there a school-zone premium baked into asking?
- What's the average days-on-market for RENTAL listings here right now (not sales)? A rising rental-DOM trend means longer vacancies and softer asking-rent achievability than the comps imply.
- What's the recent tenant-quality profile in this submarket — average credit score on applications, eviction rate, late-payment / NSF rate, and stable-employment percentage? A property-management company in the area should have these aggregated.
- How much new for-sale + rental construction is in the pipeline within 1–3 miles? Heavy new supply typically softens prices + rents 12–24 months out; constrained supply supports both.
Investment metrics
- 1% rule
- 1.05% ✓
- Cap rate
- 8.45%
- Cash-on-cash
- 7.69%
- DSCR
- 1.34
- GRM
- 8.0
CMA / ARV
- ARV (on-the-fly)
- $227,178
- Comps found
- 1
Show comp detail 1 sale within ~0.75 mi
| Address | Dist | Beds/Ba | Sqft | Sold | Price | $/sf | Match |
|---|---|---|---|---|---|---|---|
| 15051 E 202nd St S | 0.31mi | 3/2.5 (-1) | 1,832 (+2%) | 10mo | $230,000 | $126 | 64 |
Match score weights: distance 35% · size 25% · config 20% · recency 20%. Top-matched comps best support the ARV.
Projected returns pro-forma
-3.0% appreciation · 3.34% rent growth · sell at horizon
- IRR
- -4.2%
- Equity multiple
- 0.84×
- Total profit
- $-9,300
- Equity at exit
- $31,312
- IRR
- 5.8%
- Equity multiple
- 1.44×
- Total profit
- $25,825
- Equity at exit
- $18,157
Cash invested: $58,800 (down + closing). Projections, not guarantees.
Landlord ↔ Tenant lean methodology
- Overall (STATE)
- 83 Strongly Landlord-Friendly
- State Oklahoma
- 83 Strongly Landlord-Friendly · R+20
- County
- — inherits STATE
- City
- — inherits STATE
ZIP-level market 74008
- Rents YoY
- 3.3%
- Active inventory
- 789
- Price-to-rent
- 8.0×
Monthly cashflow live
- Estimated rent
- $2,197 medium interval (Pro) →
- Mortgage (P&I)
- −$1,101
- Tax from tax record
- −$170 /mo · $2,045/yr
- Insurance
- −$88
- HOA
- −$0
- Vacancy / Maint / Mgmt
- −$461
- Net cashflow
- $377
Break-even live
UW: 25.0% down · 7.5% · 30yr · 1.5% tax · 5.0% vac · 8.0% maint · 8.0% mgmt
Financing live
Cash to close
- Down payment
- $52,500
- Closing costs
- $6,300
- Reserves months
- —
- Total cash needed
- —
Loan-product check · same deal, 3 products live
Conventional
25% down · 7.5% · 30yr
- Down + closing
- —
- Monthly P&I
- —
- Monthly cashflow
- —
- DSCR
- —
- Eligible?
- —
Personal DTI + credit; lowest rate.
DSCR
20% down · 8.5% · 30yr
- Down + closing
- —
- Monthly P&I
- —
- Monthly cashflow
- —
- DSCR
- —
- Eligible?
- —
No personal income docs; deal must DSCR.
Hard money
10% down · 12.0% · 12mo
- Down + closing
- —
- Monthly P&I
- —
- Monthly cashflow
- —
- DSCR
- —
- Eligible?
- —
Short-term bridge; refi at stabilization.
Listing history 11 events
-
2026-06-18days on market $210,000 Active 13 DOM
-
2026-06-17days on market $210,000 Active 12 DOM
-
2026-06-16days on market $210,000 Active 11 DOM
-
2026-06-15days on market $210,000 Active 10 DOM
-
2026-06-13days on market $210,000 Active 8 DOM
-
2026-06-13days on market $210,000 Active 7 DOM
-
2026-06-10days on market $210,000 Active 5 DOM
-
2026-06-09days on market $210,000 Active 4 DOM
-
2026-06-08days on market $210,000 Active 3 DOM
-
2026-06-07remarks 432-char remark
-
2026-06-07$210,000 Active 2 DOM
ⓘ Source: listings_history table (triggers on properties + properties_extension) + one-shot
backfill from property_details.listing_events for pre-trigger history.
Tax reassessment forecast OK · Resets to sale price
- Current annual tax
- $2,045 · $170/mo
- Projected year-2 tax
- $2,045 · $170/mo
- Expected delta
- $0/yr ($0/mo · 0.0%)
ⓘ Screening estimate from a state-policy table — verify with the county assessor before closing.
Climate risk First Street
- Flood 1/10 Low FEMA zone X (unshaded) · 0% chance over 30 yrs
- Wildfire 7/10 Severe
- Heat 6/10 Major 7 d/yr ≥110°F today · 19 d/yr by 30 yrs out
- Wind 2/10 Low 4% chance of damaging wind over 30 yrs
- Air quality 3/10 Moderate 2 unhealthy d/yr today · 3 by 30 yrs out
Nearby sold comps map
Loading sold comps map…
Walkable amenities ~0.75 mi
Loading nearby amenities…
Taxation est. · year 1
- Rental income
- $26,369
- − Mortgage interest
- −$11,763
- − Property taxes
- −$2,045
- − Insurance
- −$1,050
- − Repairs & maintenance
- −$2,110
- − Management
- −$2,110
- − Depreciation
- −$6,109
- Taxable income
- $1,183
- Est. tax owed @ 24.0%
- −$284
- After-tax cash flow
- $4,238/yr
For passive investors: Depreciation is non-cash, so a rental often shows a tax loss while cash-flowing — sheltering income. Rental losses are passive: they offset passive income freely, and up to $25,000/yr can offset ordinary (W-2) income if you actively participate and your MAGI is under $100k (phasing out to $0 by $150k); unused losses carry forward. On sale, claimed depreciation is recaptured at up to 25%, and gains may owe capital-gains tax (a 1031 exchange can defer both). Figures are a year-1 estimate at your 24.0% rate — not tax advice; consult a CPA.
Schools (NCES district)
- District
- Bixby
- NCES district ID
- 4004500
- Math proficiency
- 39% ▼ -13.00%
- Reading proficiency
- 36% ▼ -14.00%
- Median HH income
- $75,727
- Composite
- 34.9/100
- National rank
- #5081
- State rank
- #15 of 270 in OK
Livability — Bixby
- Score
- 72/100
- State rank
- #24
- US rank
- #6029
Category grades
Schools grade is shown separately in the Schools card above.
Census & demographics
- Census place
- Bixby, OK
- County
- Tulsa County · 640,811 people
- City population
- 34,006
- Metro
- Tulsa, OK
- Population (ZIP)
- 34,006
- Household income
- $104,000
- Rent vs Own
- Severe rent burden
- 525.0
Population outlook (Wagoner County) Hauer SSP2
- Today (2025)
- 84,796 people
- By 2030
- 88,162 · +4.0%
- By 2040
- 93,882 · +10.7%
- By 2050
- 98,219 · +15.8%
- By 2075
- 106,561 · +25.7%
- By 2100
- 109,360 · +29.0%
Race, ethnicity, and origin ACS 2023
- Neighborhood character
- Predominantly White (73%)
- Race & ethnicity
- White 73% Two or more races 15% Hispanic / Latino 9% Native American 5% Asian 2% Black 2%
- Hispanic origin (detail)
- Mexican 5%
- Common ancestry
- Italian 4% Slovak 2% Lithuanian 2%
- Foreign-born
- 5% · Canada
- Languages at home
- 92% English-only · Spanish 5% Other Indo-European 1%
Political lean MEDSL · Wagoner
- 2024 margin
- Solid R (+49.8) · D 24.2% · R 74.0% · Other 1.8%
- 2008→2024 swing
- -8.0pp toward R · 2008: -41.8pp · 2024: -49.8pp
- All cycles
- 2024: R+49.8 2020: R+50.1 2016: R+52.0 2012: R+45.7 2008: R+41.8
Not yet ingested
- Civics
- —
Market trends
- HPI YoY
- ▼ -127.20%
- Current HPI
- 195.2538
- Rent YoY
- ▲ 3.34%
- Metro
- Tulsa, OK
- State GDP YoY
- ▲ 1.55%
- F500 in state
- 6
Industry mix (Fortune 500 HQ in OK)
| Industry | F500 HQs | Revenue |
|---|---|---|
| Energy | 3 | $48B |
|
||
Price history
+42.9% since first listed2 events — show timeline
- 2026-06-05 Listed $210,000 MLS Technology, Inc.
- 2009-06-16 Sold (Public Records) $147,000 Public Records
Property tax history
+3.1%/yrLatest (2025): $2,045 · +5.2% YoY. Source: county tax records.
Cash-flow waterfall
monthlySold comps — $/sqft
last 12 mo · ≤1 miLoading sold comps…