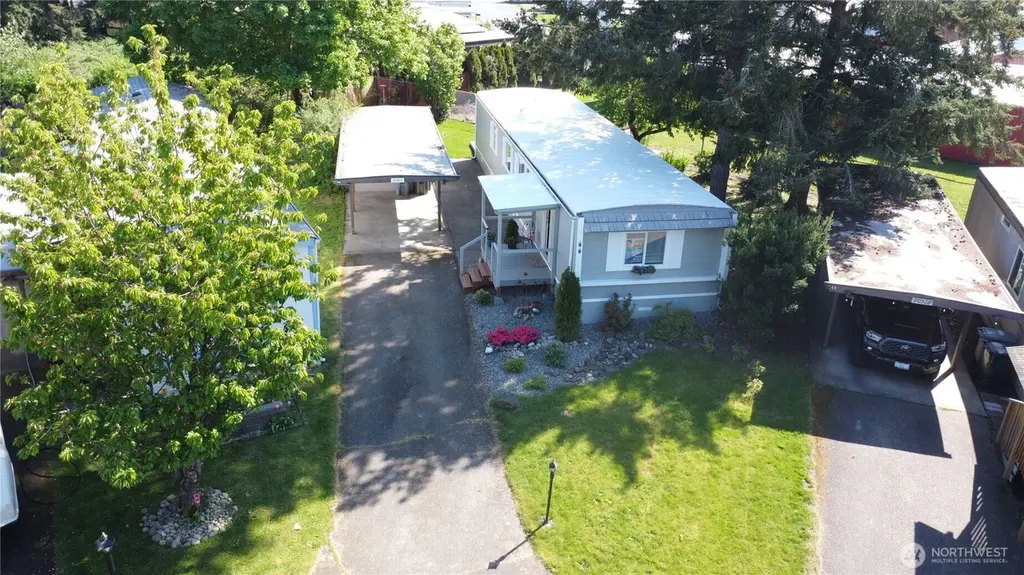
20512 10th Ave E #44 · Spanaway, WA
Flood risk 8/10 · Major
- FEMA flood zone
- X (unshaded)
- Chance of flooding over 30 yrs
- 0.99%
- Est. flood insurance / yr
- $507 – $1,088
Fire risk 1/10 · Minimal
- Est. fire insurance / yr
- $604 – $1,122
Heat risk 3/10 · Minor
- Hot days now (above 87°F)
- 7 days/yr
- Hot days in 30 yrs
- 15 days/yr
Wind risk 1/10 · Minimal
- Chance of severe wind over 30 yrs
- —
Air-quality risk 7/10 · Major
- Unhealthy air days now
- 9 days/yr
- Unhealthy air days in 30 yrs
- 10 days/yr
Risk factors via First Street. Map © Google.
Why this score? — see what drove the C+ grade
The composite is a weighted blend of 9 inputs, each scored 0–100. Each bar is that input's sub-score; the figure is the points it added to the 100-point composite (weight × sub-score).
- Cash flow +30.0/30.0
- 1% rule +10.0/10.0
- DSCR +10.0/10.0
- Schools +4.9/10.0
- Livability +3.7/5.0
- Rent growth +3.6/5.0
- Condition / age +2.5/5.0
- ARV discount +0.0/15.0
- Appreciation +0.0/10.0
$89,990
🖨 Deal sheet 📄 Offer letter ✓ Due diligence
Listing remarks
Beauty meets COMFORT & convenience in this budget-friendly, tastefully updated 2-bedroom, 1-bath mobile home in a safe and friendly ALL AGES park! Inviting landscaping & private yard in a quiet corner of the park - complete with carport, storage shed, and patio to set up your BBQ and enjoy the outdoors. BRIGHT, welcoming atmosphere with fresh paint inside & out, new flooring, new vinyl windows, & energy efficient heat pump for AC. Spacious eat-in kitchen with NEW stainless appliances, quartz counters, quality soft close cabinets. Large primary bedroom, NEW washer/dryer. SUPER location, just off Hwy 7, close to shopping (Walmart, Starbucks), & new transit center.
Key facts
- Quartz counters
- Carport
- Private yard
Tags
Property features AI
Finance
- Other: Land lease amount applies
- Financial info: Listing terms: Cash or Conventional
- HOA & community: Mobile home park amenities: clubhouse, RV parking; Approximately 82 homes in the park; Pets allowed per park rules (see remarks); Monthly land lease
Exterior
- Parking: Carport; Uncovered parking
- Utilities: Electric energy source; Shared well (water) serving the mobile home park; Septic sewer; Power by Tacoma Public Utilities
- Home design: Manufactured single-wide home; One level; Flat roof; Tie-down foundation; Manufactured home model NEW MOON (make REDMN); Located in Twin Firs mobile home park (park approved for sale)
- Construction: Wood construction
- Exterior features: Wood exterior products; Cul-de-sac location at the end of a dead-end street; Paved access
Interior
- Kitchen: Dishwasher; Microwave; Refrigerator
- Bedrooms: 2 bedrooms
- Flooring: Vinyl plank flooring; Carpet
- Bathrooms: 1 full bath with bathtub
- Heating & cooling: Forced air heating; Heat pump (heating and cooling)
- Interior features: Interior water heater (tank) located in an interior closet; Updated/remodeled interior; Kitchen with eating space; Living room
- Laundry & utility: Washer; Dryer; Storage next to carport
Neighborhood map
What this means for you Summary
Snapshot
- This is a 2-bed/1.0-bath manufactured listed at $90k.
Deal economics
- At list price, monthly cash flow is $1k ($12k/yr) — positive.
- The deal already cash-flows at list — no discount required.
- Meets the 1% rule at list price ($2k rent vs $90k).
- Recommended offer: $89k (1.5% below list) — sets the bar for market timing.
- Cap rate 21.0% vs local median 3.5% in Spanaway — top-decile yield for the area; either an underpriced asset or a hidden risk that comps aren't pricing in. Stress-test before assuming the spread holds.
Location & tenants
- Location reads 74/100 on livability (#184 in WA, #4,891 nationally) — a middle-class / working-renter tenant base. Strengths: housing A+, employment A, commute A-; Watch: cost of living C-, health & safety C-, crime D-.
- Bethel School District (suburban): math 47% / reading 59% proficiency, ranked #103 of 291 in WA (top 35%) — acceptable for families but not a draw, mixed tenant base, ~2y average lease.
- Market conditions: Rents rising fast (+4.2%/yr); 383 active listings in the ZIP; 5 comparable units currently listed for rent nearby; rentals at typical pace (median 25d on market — plan ~3-4 weeks tenant-placement turnaround); solid renter incomes; 3,209 units permitted in Pierce County in 2024 (1,269 in 5+ unit buildings).
Forward outlook
- Local home prices are declining (-3.0%/yr); year-one equity from $622 of loan paydown is wiped out by about $3k of value loss. Plan a longer hold.
- Pierce County population projected at +26% by 2050 — long-run rental-demand tailwind backs the buy-and-hold thesis.
- At projected returns (-3.0% appreciation + 4.2% rent growth), your $25k cash investment doubles in ~3 years — after that, you're playing with house money.
Negotiation context
- It's been on market 17 days — a 2% lower offer ($89k) is reasonable based on typical stale-listing flexibility.
Risks & watch-outs
- Watch-outs: flood insurance adds $66/mo.
- Climate carrying-cost: severe flood risk — expect insurance premiums to compound above CPI over the hold.
Questions for the listing agent
- Built in 1975 — when were the roof, HVAC, electrical panel, plumbing, and water heater last replaced?
- What's the actual annual flood-insurance premium (NFIP or private), and is the property in a SFHA with mandatory coverage?
- Is there a deadline driving the sale (1031 exchange, divorce, estate, relocation)? That informs how much negotiation room exists.
- Schools are B-rated — typically a magnet for longer-tenancy family renters. What's the average tenant stay here, and is there a school-zone premium baked into asking?
- Crime grade is D in this area — have there been break-ins, vandalism, or insurance claims at this property in the last 3 years? What carrier currently insures it and at what premium?
- What's the average days-on-market for RENTAL listings here right now (not sales)? A rising rental-DOM trend means longer vacancies and softer asking-rent achievability than the comps imply.
- What's the recent tenant-quality profile in this submarket — average credit score on applications, eviction rate, late-payment / NSF rate, and stable-employment percentage? A property-management company in the area should have these aggregated.
- How much new for-sale + rental construction is in the pipeline within 1–3 miles? Heavy new supply typically softens prices + rents 12–24 months out; constrained supply supports both.
Investment metrics
- 1% rule
- 2.33% ✓
- Cap rate
- 20.97%
- Cash-on-cash
- 52.42%
- DSCR
- 3.33
- GRM
- 3.6
CMA / ARV
- ARV (on-the-fly)
- $65,072
- Comps found
- 6
Show comp detail 6 sales within ~0.75 mi
| Address | Dist | Beds/Ba | Sqft | Sold | Price | $/sf | Match |
|---|---|---|---|---|---|---|---|
| 20403 9th Ave E #23 | 0.11mi | 2/1.0 | 784 (0%) | 11mo | $65,000 | $83 | 85 |
| 911 205th St E #26 | 0.07mi | 2/1.0 | 840 (+7%) | 17mo | $110,000 | $131 | 71 |
| 20718 9th Ave E #18 | 0.11mi | 2/1.0 | 728 (-7%) | 19mo | $28,000 | $38 | 67 |
| 823 204th Street Ct E #21 | 0.13mi | 3/1.5 (+1) | 896 (+14%) | 7mo | $80,000 | $89 | 57 |
| 819 E 204th St E #20 | 0.12mi | 2/1.0 | 672 (-14%) | 17mo | $39,950 | $59 | 56 |
| 20709 9th Ave E #10 | 0.07mi | 2/1.0 | 672 (-14%) | 21mo | $45,000 | $67 | 55 |
Match score weights: distance 35% · size 25% · config 20% · recency 20%. Top-matched comps best support the ARV.
Projected returns pro-forma
-3.0% appreciation · 4.24% rent growth · sell at horizon
- IRR
- 48.3%
- Equity multiple
- 3.14×
- Total profit
- $53,963
- Equity at exit
- $13,418
- IRR
- 54.4%
- Equity multiple
- 6.68×
- Total profit
- $143,066
- Equity at exit
- $7,781
Cash invested: $25,197 (down + closing). Projections, not guarantees.
Landlord ↔ Tenant lean methodology
- Overall (STATE)
- 28 Tenant-Leaning
- State Washington
- 28 Tenant-Leaning · D+8
- County
- — inherits STATE
- City
- — inherits STATE
ZIP-level market 98387
- Rents YoY
- 4.2%
- Active inventory
- 383
- Price-to-rent
- 3.6×
Monthly cashflow live
- Estimated rent
- $2,095 high interval (Pro) →
- Mortgage (P&I)
- −$472
- Tax from tax record
- −$45 /mo · $538/yr
- Insurance
- −$37
- Flood insurance flood zone
- −$66 /mo · $798/yr
- HOA
- −$0
- Vacancy / Maint / Mgmt
- −$440
- Net cashflow
- $1,034
Break-even live
UW: 25.0% down · 7.5% · 30yr · 1.5% tax · 5.0% vac · 8.0% maint · 8.0% mgmt
Financing live
Cash to close
- Down payment
- $22,498
- Closing costs
- $2,700
- Reserves months
- —
- Total cash needed
- —
Loan-product check · same deal, 3 products live
Conventional
25% down · 7.5% · 30yr
- Down + closing
- —
- Monthly P&I
- —
- Monthly cashflow
- —
- DSCR
- —
- Eligible?
- —
Personal DTI + credit; lowest rate.
DSCR
20% down · 8.5% · 30yr
- Down + closing
- —
- Monthly P&I
- —
- Monthly cashflow
- —
- DSCR
- —
- Eligible?
- —
No personal income docs; deal must DSCR.
Hard money
10% down · 12.0% · 12mo
- Down + closing
- —
- Monthly P&I
- —
- Monthly cashflow
- —
- DSCR
- —
- Eligible?
- —
Short-term bridge; refi at stabilization.
Rent comps 5 comps
| Address | Beds | Baths | Sqft | Rent | $/sqft | DOM | Units | Dist |
|---|---|---|---|---|---|---|---|---|
| 20002 Mountain Hwy E Spanaway, WA | 2.0–3.0 | 1.0–2.0 | 933 | $1,630 | $1.75 | 5d | 1 | 0.30mi |
| 814 196th St E Spanaway, WA | 2.0 | 1.5 | 1026 | $2,095 | $2.04 | 24d | 1 | 0.59mi |
| 19606 9th Avenue Ct E Spanaway, WA | 2.0 | 1.5 | 1026 | $2,000 | $1.95 | 5d | 1 | 0.59mi |
| 19316 Twinkle Dr E Spanaway, WA | 3.0 | 1.0 | 975 | $1,975 | $2.03 | 24d | 1 | 0.77mi |
| 19012 B St E Spanaway, WA | 2.0 | 1.0 | 850 | $1,400 | $1.65 | 24d | 1 | 1.06mi |
Listing history 18 events
-
2026-06-19status $89,990 Pending 17 DOM
-
2026-06-18days on market $89,990 Active Under Contract 17 DOM
-
2026-06-17days on market $89,990 Active Under Contract 16 DOM
-
2026-06-16days on market $89,990 Active Under Contract 15 DOM
-
2026-06-15days on market $89,990 Active Under Contract 14 DOM
-
2026-06-13days on market $89,990 Active Under Contract 12 DOM
-
2026-06-13statusdays on market $89,990 Active Under Contract 11 DOM
-
2026-06-09days on market $89,990 Active 8 DOM
-
2026-06-08days on market $89,990 Active 7 DOM
-
2026-06-07days on market $89,990 Active 6 DOM
-
2026-06-04days on market $89,990 Active 3 DOM
-
2026-06-03days on market $89,990 Active 2 DOM
-
2026-06-02pricedays on market $89,990 Active 1 DOM
-
2026-05-31days on market $93,000 Active 64 DOM
-
2026-05-24price $93,000
-
2026-05-18price $96,990
-
2026-04-28price $99,499
-
2026-03-28$104,450 Active
ⓘ Source: listings_history table (triggers on properties + properties_extension) + one-shot
backfill from property_details.listing_events for pre-trigger history.
Tax reassessment forecast WA · Resets to sale price
- Current annual tax
- $538 · $45/mo
- Projected year-2 tax
- $882 · $73/mo
- Expected delta
- +$344/yr (+$29/mo · 63.9%)
ⓘ Screening estimate from a state-policy table — verify with the county assessor before closing.
Climate risk First Street
- Flood 8/10 Severe FEMA zone X (unshaded) · 99% chance over 30 yrs
- Wildfire 1/10 Low
- Heat 3/10 Moderate 7 d/yr ≥87°F today · 15 d/yr by 30 yrs out
- Wind 1/10 Low
- Air quality 7/10 Severe 9 unhealthy d/yr today · 10 by 30 yrs out
Nearby sold comps map
Loading sold comps map…
Walkable amenities ~0.75 mi
Loading nearby amenities…
Taxation est. · year 1
- Rental income
- $25,138
- − Mortgage interest
- −$5,041
- − Property taxes
- −$538
- − Insurance
- −$1,247
- − Repairs & maintenance
- −$2,011
- − Management
- −$2,011
- − Depreciation
- −$2,618
- Taxable income
- $11,671
- Est. tax owed @ 24.0%
- −$2,801
- After-tax cash flow
- $9,609/yr
For passive investors: Depreciation is non-cash, so a rental often shows a tax loss while cash-flowing — sheltering income. Rental losses are passive: they offset passive income freely, and up to $25,000/yr can offset ordinary (W-2) income if you actively participate and your MAGI is under $100k (phasing out to $0 by $150k); unused losses carry forward. On sale, claimed depreciation is recaptured at up to 25%, and gains may owe capital-gains tax (a 1031 exchange can defer both). Figures are a year-1 estimate at your 24.0% rate — not tax advice; consult a CPA.
Schools (NCES district)
- District
- Bethel School District
- NCES district ID
- 5300480
- Math proficiency
- 47% ▬ 0.00%
- Reading proficiency
- 59% ▲ 2.00%
- Median HH income
- $65,872
- Composite
- 48.66/100
- National rank
- #4568
- State rank
- #103 of 291 in WA
Livability — Spanaway
- Score
- 74/100
- State rank
- #184
- US rank
- #4891
Category grades
Schools grade is shown separately in the Schools card above.
Census & demographics
- Census place
- Spanaway, WA
- County
- Pierce County · 788,257 people
- City population
- 50,774
- Metro
- Seattle-Tacoma-Bellevue, WA
- Population (ZIP)
- 50,774
- Household income
- $106,872
- Rent vs Own
- Severe rent burden
- 807.0
Population outlook (Pierce County) Hauer SSP2
- Today (2025)
- 956,648 people
- By 2030
- 1,010,862 · +5.7%
- By 2040
- 1,113,170 · +16.4%
- By 2050
- 1,206,524 · +26.1%
- By 2075
- 1,436,425 · +50.2%
- By 2100
- 1,563,654 · +63.5%
Race, ethnicity, and origin ACS 2023
- Neighborhood character
- Diverse neighborhood (Simpson 0.68)
- Race & ethnicity
- White 53% Two or more races 18% Hispanic / Latino 16% Black 10% Asian 6% Pacific Islander 4%
- Hispanic origin (detail)
- Mexican 10% Puerto Rican 2%
- Common ancestry
- Portuguese 3% Italian 3% Slovak 2%
- Foreign-born
- 11% · Canada, South Korea
- Languages at home
- 82% English-only · Spanish 7% Russian/Polish/Slavic 2% Other Asian/Pacific 2%
Political lean MEDSL · Pierce
- 2024 margin
- D (+10.8) · D 53.9% · R 43.1% · Other 3.0%
- 2008→2024 swing
- -1.4pp toward R · 2008: 12.2pp · 2024: 10.8pp
- All cycles
- 2024: D+10.8 2020: D+11.2 2016: D+7.5 2012: D+11.0 2008: D+12.2
Not yet ingested
- Civics
- —
Market trends
- HPI YoY
- ▼ -208.94%
- Current HPI
- 308.0462
- Rent YoY
- ▲ 4.24%
- Metro
- Seattle-Tacoma-Bellevue, WA
- State GDP YoY
- ▲ 4.65%
- F500 in state
- 22
Industry mix (Fortune 500 HQ in WA)
| Industry | F500 HQs | Revenue |
|---|---|---|
| Retail | 2 | $269B |
|
||
| Technology / Retail | 1 | $638B |
|
||
| Technology | 1 | $245B |
|
||
| Telecommunications | 1 | $38B |
|
||
| Food / Beverage | 1 | $36B |
|
||
| Automotive / Trucks | 1 | $34B |
|
||
Price history
-11.0% since first listed4 events — show timeline
- 2026-05-24 Price Changed $93,000 NWMLS as Distributed by MLS Grid
- 2026-05-18 Price Changed $96,990 NWMLS as Distributed by MLS Grid
- 2026-04-28 Price Changed $99,499 NWMLS as Distributed by MLS Grid
- 2026-03-28 Listed $104,450 NWMLS as Distributed by MLS Grid
Property tax history
+9.5%/yrLatest (2026): $538 · +47.5% YoY. Source: county tax records.
Cash-flow waterfall
monthlySold comps — $/sqft
last 12 mo · ≤1 miLoading sold comps…