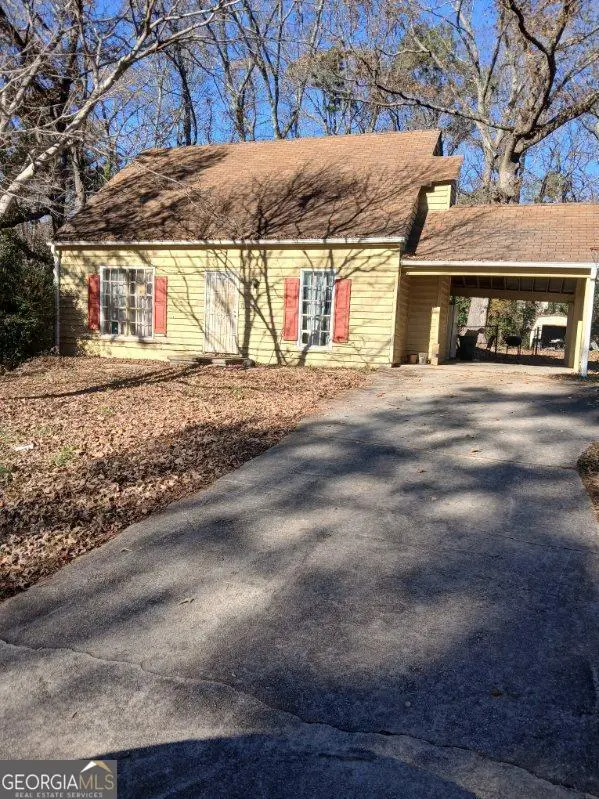
108 Fairview Pl · Stonecrest, GA
Flood risk 1/10 · Minimal
- FEMA flood zone
- X (unshaded)
- Chance of flooding over 30 yrs
- 0.0%
- Est. flood insurance / yr
- $507 – $1,088
Fire risk 3/10 · Minor
- Est. fire insurance / yr
- $963 – $1,789
Heat risk 6/10 · Moderate
- Hot days now (above 106°F)
- 7 days/yr
- Hot days in 30 yrs
- 18 days/yr
Wind risk 6/10 · Moderate
- Chance of severe wind over 30 yrs
- 27.0%
Air-quality risk 4/10 · Minor
- Unhealthy air days now
- 5 days/yr
- Unhealthy air days in 30 yrs
- 7 days/yr
Risk factors via First Street. Map © Google.
Why this score? — see what drove the B- grade
The composite is a weighted blend of 9 inputs, each scored 0–100. Each bar is that input's sub-score; the figure is the points it added to the 100-point composite (weight × sub-score).
- Cash flow +27.0/30.0
- ARV discount +15.0/15.0
- DSCR +9.3/10.0
- 1% rule +8.0/10.0
- Rent growth +2.7/5.0
- Schools +2.6/10.0
- Livability +2.5/5.0
- Condition / age +2.5/5.0
- Appreciation +0.0/10.0
$149,000
🖨 Deal sheet 📄 Offer letter ✓ Due diligence
Listing remarks
This was a rental property. Seller is negotiable but is not accepting extremely low offers. No blind offers! MUST SEE PROPERTY BEFORE MAKING AN OFFER!!
Key facts
- Parking
- Built 1978
- Listed 21 days
Property features AI
Finance
- Other: Subdivision: Fairview Manor; Directions provided to property; Photos available
- Financial info: Seller will consider cash, conventional financing, or owner financing; Listed As-Is; investor owned
- HOA & community: No HOA; Community has street lights
Exterior
- Parking: Attached carport (1 parking space); Side/rear entrance
- Utilities: Public water available; Septic tank; Electricity available; Natural gas available; High speed internet available; Phone service available
- Home design: Single family residence (house); Two levels; Built in 1978; Property listed as fixer
- Construction: Press board construction; Composition roof; No basement
- Exterior features: Patio; Other exterior features; Back yard fencing (chain link, fenced); Partially wooded; Level, private lot; Shed(s)
Interior
- Kitchen: Dishwasher; Refrigerator; Gas water heater
- Bedrooms: 4 bedrooms (2 on the main level)
- Flooring: Carpet; Other
- Bathrooms: 2 full bathrooms (1 on the main level)
- Heating & cooling: Central heating (forced air, natural gas); Central air conditioning (electric); Ceiling fan(s)
- Interior features: Roommate plan layout; Walk-in closet(s); Great room
- Laundry & utility: Laundry located in kitchen; Laundry closet
Neighborhood map
What this means for you Summary
Snapshot
- This is a 3-bed/2.0-bath single-family listed at $149k.
Deal economics
- At list price, monthly cash flow is $416 ($5k/yr) — positive.
- The deal already cash-flows at list — no discount required.
- Meets the 1% rule at list price ($2k rent vs $149k).
- Recommended offer: $147k (1.5% below list) — sets the bar for market timing.
- Cap rate 9.6% vs local median 5.1% in Stonecrest — top-decile yield for the area; either an underpriced asset or a hidden risk that comps aren't pricing in. Stress-test before assuming the spread holds.
Location & tenants
- Location reads: area grade B — affects rentability + tenant quality, not the cash-flow math above.
- Henry County (rural): math 24% / reading 33% proficiency, ranked #89 of 174 in GA (top 51%) — low school quality limits family demand, transient renter base, plan for 1-2y turnover.
- Zoned schools: Austin Road Elementary School (math 22% / reading 22%, grade F, #810 of 1,228 statewide, top 69%, 386 students, 65% FRL); Austin Road Middle School (math 15% / reading 35%, grade F, #291 of 470 statewide, top 64%, 542 students, 68% FRL); Woodland High School (math 15% / reading 24%, grade F, #238 of 424 statewide, top 57%, 1,334 students, 42% FRL) — zoned schools average 58% FRL vs 43% district-wide (15 pts higher); higher-poverty schools than district average — tighter screening recommended.
- Market conditions: Rents flat; 586 active listings in the ZIP; 2 comparable units currently listed for rent nearby; 1,989 units permitted in Henry County in 2024 (92 in 5+ unit buildings).
- This rent runs 33% of the median local income ($71k/yr) — at the standard rent-burdened threshold; future hikes will face affordability resistance.
Forward outlook
- Local home prices are declining (-3.0%/yr); year-one equity from $1k of loan paydown is wiped out by about $4k of value loss. Plan a longer hold.
- Henry County population projected at +29% by 2050 — long-run rental-demand tailwind backs the buy-and-hold thesis.
Negotiation context
- It's been on market 21 days — a 2% lower offer ($147k) is reasonable based on typical stale-listing flexibility.
- Current owner paid $105k; 42% above their basis — modest negotiation headroom, anchor on the comps not their cost.
Risks & watch-outs
- Climate carrying-cost: major wind risk, 27% chance of damaging wind over 30y; extreme-heat days projected 7→18/yr by 2055 (HVAC capex compounding) — expect insurance premiums to compound above CPI over the hold.
Questions for the listing agent
- Built in 1978 — when were the roof, HVAC, electrical panel, plumbing, and water heater last replaced?
- Is there a deadline driving the sale (1031 exchange, divorce, estate, relocation)? That informs how much negotiation room exists.
- What's the average days-on-market for RENTAL listings here right now (not sales)? A rising rental-DOM trend means longer vacancies and softer asking-rent achievability than the comps imply.
- What's the recent tenant-quality profile in this submarket — average credit score on applications, eviction rate, late-payment / NSF rate, and stable-employment percentage? A property-management company in the area should have these aggregated.
- How much new for-sale + rental construction is in the pipeline within 1–3 miles? Heavy new supply typically softens prices + rents 12–24 months out; constrained supply supports both.
Investment metrics
- 1% rule
- 1.30% ✓
- Cap rate
- 9.64%
- Cash-on-cash
- 11.96%
- DSCR
- 1.53
- GRM
- 6.4
CMA / ARV
- ARV (median comp)
- $242,020
- List price
- $149,000
- Delta
- -38.43%
- Verdict
- UNDERPRICED
- Comps
- 20 within 1.0 mi
Show comp detail 12 sales within ~0.75 mi
| Address | Dist | Beds/Ba | Sqft | Sold | Price | $/sf | Match |
|---|---|---|---|---|---|---|---|
| 108 Fairview Pl | 0.00mi | 4/2.0 (+1) | 1,472 (0%) | 1mo | $105,000 | $71 | 94 |
| 1411 Fairview Dr | 0.12mi | 3/2.0 | 1,447 (-2%) | 1mo | $230,000 | $159 | 90 |
| 357 Falling Timber Ct | 0.36mi | 3/2.0 | 1,536 (+4%) | 2mo | $245,000 | $160 | 74 |
| 122 Farmbrook Trl | 0.48mi | 3/2.0 | 1,542 (+5%) | 2mo | $248,000 | $161 | 68 |
| 109 Park Cir | 0.20mi | 3/2.0 | 1,632 (+11%) | 14mo | $244,000 | $150 | 61 |
| 130 Fairview Dr | 0.26mi | 3/2.0 | 1,254 (-15%) | 3mo | $198,000 | $158 | 60 |
| 225 Farmbrook Pkwy | 0.57mi | 3/2.0 | 1,597 (+8%) | 1mo | $225,000 | $141 | 58 |
| 239 Farmbrook Pkwy | 0.69mi | 3/2.0 | 1,363 (-7%) | 3mo | $250,000 | $183 | 53 |
| 103 Forest Pl | 0.38mi | 3/2.0 | 1,252 (-15%) | 7mo | $198,000 | $158 | 51 |
| 222 Farmbrook Pkwy | 0.53mi | 3/2.0 | 1,683 (+14%) | 4mo | $250,000 | $149 | 48 |
| 416 Winterwood Dr | 0.71mi | 3/2.0 | 1,610 (+9%) | 10mo | $230,000 | $143 | 43 |
| 121 Forest Pl | 0.58mi | 3/2.0 | 1,636 (+11%) | 15mo | $250,000 | $153 | 42 |
Match score weights: distance 35% · size 25% · config 20% · recency 20%. Top-matched comps best support the ARV.
Projected returns pro-forma
-3.0% appreciation · 0.87% rent growth · sell at horizon
- IRR
- -1.1%
- Equity multiple
- 0.96×
- Total profit
- $-1,648
- Equity at exit
- $22,216
- IRR
- 6.1%
- Equity multiple
- 1.41×
- Total profit
- $17,018
- Equity at exit
- $12,883
Cash invested: $41,720 (down + closing). Projections, not guarantees.
Landlord ↔ Tenant lean methodology
- Overall (STATE)
- 90 Strongly Landlord-Friendly
- State Georgia
- 90 Strongly Landlord-Friendly · R+3
- County
- — inherits STATE
- City
- — inherits STATE
ZIP-level market 30281
- Home prices YoY
- -33.6%
- Rents YoY
- 0.9%
- Active inventory
- 586
- Price-to-rent
- 6.4×
Monthly cashflow live
- Estimated rent
- $1,935 medium interval (Pro) →
- Mortgage (P&I)
- −$781
- Tax from tax record
- −$270 /mo · $3,234/yr
- Insurance
- −$62
- HOA
- −$0
- Vacancy / Maint / Mgmt
- −$406
- Net cashflow
- $416
Break-even live
UW: 25.0% down · 7.5% · 30yr · 1.5% tax · 5.0% vac · 8.0% maint · 8.0% mgmt
Financing live
Cash to close
- Down payment
- $37,250
- Closing costs
- $4,470
- Reserves months
- —
- Total cash needed
- —
Loan-product check · same deal, 3 products live
Conventional
25% down · 7.5% · 30yr
- Down + closing
- —
- Monthly P&I
- —
- Monthly cashflow
- —
- DSCR
- —
- Eligible?
- —
Personal DTI + credit; lowest rate.
DSCR
20% down · 8.5% · 30yr
- Down + closing
- —
- Monthly P&I
- —
- Monthly cashflow
- —
- DSCR
- —
- Eligible?
- —
No personal income docs; deal must DSCR.
Hard money
10% down · 12.0% · 12mo
- Down + closing
- —
- Monthly P&I
- —
- Monthly cashflow
- —
- DSCR
- —
- Eligible?
- —
Short-term bridge; refi at stabilization.
Rent comps 2 comps
| Address | Beds | Baths | Sqft | Rent | $/sqft | DOM | Units | Dist |
|---|---|---|---|---|---|---|---|---|
| 1069 Estates Ct Stockbridge, GA | 3.0 | 2.0 | 1476 | $1,746 | $1.18 | 44d | 1 | 1.06mi |
| 285 Lakeshore Dr Stockbridge, GA | 3.0 | 2.0 | 1411 | $1,895 | $1.34 | 22d | 1 | 1.32mi |
Listing history 3 events
-
2026-05-08$149,000 New 151-char remark
-
1995-09-07soldstatus $72,900
-
1978-11-01soldstatus $34,600
ⓘ Source: listings_history table (triggers on properties + properties_extension) + one-shot
backfill from property_details.listing_events for pre-trigger history.
Tax reassessment forecast GA · Resets to sale price
- Current annual tax
- $3,234 · $270/mo
- Projected year-2 tax
- $3,234 · $270/mo
- Expected delta
- $0/yr ($0/mo · 0.0%)
ⓘ Screening estimate from a state-policy table — verify with the county assessor before closing.
Climate risk First Street
- Flood 1/10 Low FEMA zone X (unshaded) · 0% chance over 30 yrs
- Wildfire 3/10 Moderate
- Heat 6/10 Major 7 d/yr ≥106°F today · 18 d/yr by 30 yrs out
- Wind 6/10 Major 27% chance of damaging wind over 30 yrs
- Air quality 4/10 Moderate 5 unhealthy d/yr today · 7 by 30 yrs out
Nearby sold comps map
Loading sold comps map…
Walkable amenities ~0.75 mi
Loading nearby amenities…
Taxation est. · year 1
- Rental income
- $23,220
- − Mortgage interest
- −$8,346
- − Property taxes
- −$3,234
- − Insurance
- −$745
- − Repairs & maintenance
- −$1,858
- − Management
- −$1,858
- − Depreciation
- −$4,335
- Taxable income
- $2,845
- Est. tax owed @ 24.0%
- −$683
- After-tax cash flow
- $4,306/yr
For passive investors: Depreciation is non-cash, so a rental often shows a tax loss while cash-flowing — sheltering income. Rental losses are passive: they offset passive income freely, and up to $25,000/yr can offset ordinary (W-2) income if you actively participate and your MAGI is under $100k (phasing out to $0 by $150k); unused losses carry forward. On sale, claimed depreciation is recaptured at up to 25%, and gains may owe capital-gains tax (a 1031 exchange can defer both). Figures are a year-1 estimate at your 24.0% rate — not tax advice; consult a CPA.
Schools (NCES district)
- District
- Henry County
- NCES district ID
- 1302820
- Math proficiency
- 24% ▼ -9.00%
- Reading proficiency
- 33% ▼ -7.00%
- Median HH income
- $62,594
- Composite
- 26.13/100
- National rank
- #7279
- State rank
- #89 of 174 in GA
Livability — Stonecrest
No livability data for this city. (Only ~50 U.S. cities are tracked.)
Census & demographics
- County
- Henry County · 316,359 people
- City population
- 106,165
- Metro
- Atlanta-Sandy Springs-Alpharetta, GA
- Population (ZIP)
- 71,603
- Household income
- $71,213
- Rent vs Own
- Severe rent burden
- 2464.0
Population outlook (Henry County) Hauer SSP2
- Today (2025)
- 249,041 people
- By 2030
- 264,369 · +6.2%
- By 2040
- 294,459 · +18.2%
- By 2050
- 322,249 · +29.4%
- By 2075
- 392,310 · +57.5%
- By 2100
- 437,836 · +75.8%
Race, ethnicity, and origin ACS 2023
- Neighborhood character
- Diverse neighborhood (Simpson 0.61)
- Race & ethnicity
- Black 55% White 28% Hispanic / Latino 11% Two or more races 6% Asian 4%
- Hispanic origin (detail)
- Mexican 7%
- Common ancestry
- Hispanic 1% Italian 1% Romanian 1%
- Foreign-born
- 9% · Canada, Vietnam
- Languages at home
- 86% English-only · Spanish 8% Vietnamese 2% French/Haitian/Cajun 1%
Political lean MEDSL · Henry
- 2024 margin
- Strong D (+29.7) · D 64.5% · R 34.9%
- 2008→2024 swing
- +37.1pp toward D · 2008: -7.5pp · 2024: 29.7pp
- All cycles
- 2024: D+29.7 2020: D+20.5 2016: D+4.3 2012: R+3.2 2008: R+7.5
Not yet ingested
- Civics
- —
Market trends
- HPI YoY
- ▼ -104.76%
- Current HPI
- 207.2332
- Rent YoY
- ▲ 0.87%
- Metro
- Atlanta-Sandy Springs-Alpharetta, GA
- State GDP YoY
- ▲ 2.66%
- F500 in state
- 28
Industry mix (Fortune 500 HQ in GA)
| Industry | F500 HQs | Revenue |
|---|---|---|
| Paper / Packaging | 2 | $29B |
|
||
| Retail | 1 | $160B |
|
||
| Transportation / Logistics | 1 | $91B |
|
||
| Airlines | 1 | $62B |
|
||
| Consumer Goods | 1 | $47B |
|
||
| Utilities | 1 | $25B |
|
||
Price history
+203.5% since first listed5 events — show timeline
- 2026-06-01 Sold (MLS) $105,000 GAMLS
- 2026-05-29 Pending — GAMLS
- 2026-05-08 Listed $149,000 GAMLS
- 1995-09-07 Sold (Public Records) $72,900 Public Records
- 1978-11-01 Sold (Public Records) $34,600 Public Records
Property tax history
+4.8%/yrLatest (2025): $3,234 · -2.4% YoY. Source: county tax records.
Cash-flow waterfall
monthlySold comps — $/sqft
last 12 mo · ≤1 miLoading sold comps…