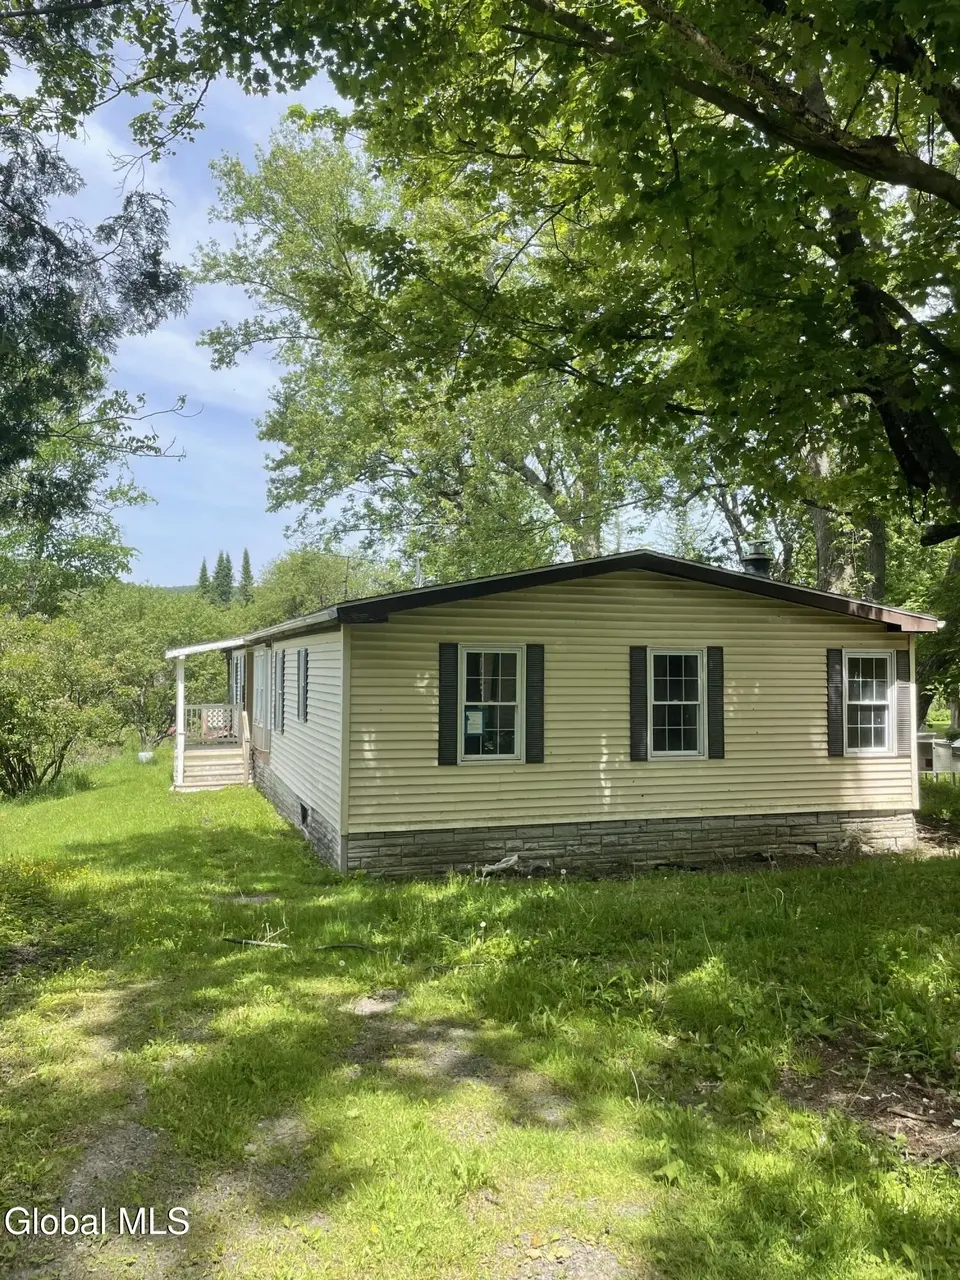
3653 County Highway 35 · Westford, NY
Flood risk 5/10 · Moderate
- FEMA flood zone
- X (unshaded)
- Chance of flooding over 30 yrs
- 0.47%
- Est. flood insurance / yr
- $507 – $1,088
Fire risk 1/10 · Minimal
- Est. fire insurance / yr
- $691 – $1,283
Heat risk 2/10 · Minimal
- Hot days now (above 89°F)
- 8 days/yr
- Hot days in 30 yrs
- 18 days/yr
Wind risk 2/10 · Minimal
- Chance of severe wind over 30 yrs
- 1.0%
Air-quality risk 1/10 · Minimal
- Unhealthy air days now
- 0 days/yr
- Unhealthy air days in 30 yrs
- 0 days/yr
Risk factors via First Street. Map © Google.
Why this score? — see what drove the B+ grade
The composite is a weighted blend of 9 inputs, each scored 0–100. Each bar is that input's sub-score; the figure is the points it added to the 100-point composite (weight × sub-score).
- Cash flow +30.0/30.0
- 1% rule +10.0/10.0
- DSCR +10.0/10.0
- Appreciation +10.0/10.0
- ARV discount +7.5/15.0
- Schools +4.1/10.0
- Rent growth +2.5/5.0
- Livability +2.5/5.0
- Condition / age +2.5/5.0
$60,000
🖨 Deal sheet 📄 Offer letter ✓ Due diligence
Listing remarks
Three-bedroom, two-bath manufactured home offering approximately 1,400 square feet of living space on a 0.34-acre lot in a country setting. Features include a slab foundation, detached one-car garage, private well, and septic system. Property requires extensive repairs and renovation and is being sold as-is. Cash purchase or renovation financing may be most suitable. Opportunity for investors, contractors, or buyers seeking a project property. Buyer to verify all property information and condition.
Key facts
- 0.34 acre lot
- Garage
- Built 1988
Property features AI
Exterior
- Parking: Detached 1-car garage; Driveway; Total parking for 4 vehicles
- Utilities: Septic tank
- Home design: Single-family residence; One story; Manufactured home (on site)
- Construction: Aluminum and vinyl siding; Built with slab foundation
- Exterior features: Asphalt roof; 0.34-acre corner lot
Interior
- Kitchen: Kitchen on the first floor
- Bedrooms: Three bedrooms on the first floor
- Bathrooms: Two full bathrooms on the first floor
- Heating & cooling: Forced air heating
- Interior features: Slab foundation; Fireplace (1); Seven total rooms
Neighborhood map
What this means for you Summary
Snapshot
- This is a 3-bed/2.0-bath manufactured listed at $60k.
Deal economics
- At list price, monthly cash flow is $566 ($7k/yr) — positive.
- The deal already cash-flows at list — no discount required.
- Meets the 1% rule at list price ($1k rent vs $60k).
Location & tenants
- Location reads: area grade B — affects rentability + tenant quality, not the cash-flow math above.
- Cherry Valley-Springfield Central School District (rural): math 45% / reading 45% proficiency, ranked #564 of 755 in NY (top 75%) — families likely to look elsewhere, expect single-tenant / working-renter base with shorter leases.
- Market conditions: 37 active listings in the ZIP; 133 units permitted in Otsego County in 2024 (10 in 5+ unit buildings).
Forward outlook
- In year one you build about $6k of equity ($415 loan paydown + $6k appreciation (10.0% local appreciation)).
- Otsego County population projected at -21% by 2050 — secular population decline; favor cash flow + early exit over multi-decade hold.
- At projected returns (10.0% appreciation + 3.0% rent growth), your $17k cash investment doubles in ~2 years — after that, you're playing with house money.
- By year 6, paydown + projected appreciation supports a ~$38k cash-out refi (75% LTV) — recoverable capital for the next deal without selling this one.
Negotiation context
- Only 9 days on market — expect competitive offers; lowballing is unlikely to land.
- 4 sale attempts with the ask held roughly flat each time — persistent listings suggest the price (not the market) is what's stuck; bring a comps-based counter.
Risks & watch-outs
- Watch-outs: property tax is 4.0% of price.
- Climate carrying-cost: moderate flood risk — expect insurance premiums to compound above CPI over the hold.
Questions for the listing agent
- Property tax is high relative to price — has the assessment been appealed recently, and will the sale trigger a re-assessment?
- Is there a deadline driving the sale (1031 exchange, divorce, estate, relocation)? That informs how much negotiation room exists.
- What's the average days-on-market for RENTAL listings here right now (not sales)? A rising rental-DOM trend means longer vacancies and softer asking-rent achievability than the comps imply.
- What's the recent tenant-quality profile in this submarket — average credit score on applications, eviction rate, late-payment / NSF rate, and stable-employment percentage? A property-management company in the area should have these aggregated.
- How much new for-sale + rental construction is in the pipeline within 1–3 miles? Heavy new supply typically softens prices + rents 12–24 months out; constrained supply supports both.
Investment metrics
- 1% rule
- 2.33% ✓
- Cap rate
- 17.61%
- Cash-on-cash
- 40.43%
- DSCR
- 2.80
- GRM
- 3.6
CMA / ARV
- ARV (median comp)
- $153,276
- List price
- $60,000
- Delta
- -60.85%
- Verdict
- UNDERPRICED
- Comps
- 1 within 2.0 mi
Projected returns pro-forma
10.0% appreciation · 3.0% rent growth · sell at horizon
- IRR
- 55.6%
- Equity multiple
- 5.10×
- Total profit
- $68,823
- Equity at exit
- $54,053
- IRR
- 49.2%
- Equity multiple
- 11.39×
- Total profit
- $174,516
- Equity at exit
- $116,567
Cash invested: $16,800 (down + closing). Projections, not guarantees.
Landlord ↔ Tenant lean methodology
- Overall (STATE)
- 15 Strongly Tenant-Friendly
- State New York
- 15 Strongly Tenant-Friendly · D+10
- County
- — inherits STATE
- City
- — inherits STATE
ZIP-level market 13326
- Home prices YoY
- 10.9%
- Active inventory
- 37
- Price-to-rent
- 3.6×
Monthly cashflow live
- Estimated rent
- $1,397 medium interval (Pro) →
- Mortgage (P&I)
- −$315
- Tax from tax record
- −$198 /mo · $2,380/yr
- Insurance
- −$25
- HOA
- −$0
- Vacancy / Maint / Mgmt
- −$293
- Net cashflow
- $566
Break-even live
UW: 25.0% down · 7.5% · 30yr · 1.5% tax · 5.0% vac · 8.0% maint · 8.0% mgmt
Financing live
Cash to close
- Down payment
- $15,000
- Closing costs
- $1,800
- Reserves months
- —
- Total cash needed
- —
Loan-product check · same deal, 3 products live
Conventional
25% down · 7.5% · 30yr
- Down + closing
- —
- Monthly P&I
- —
- Monthly cashflow
- —
- DSCR
- —
- Eligible?
- —
Personal DTI + credit; lowest rate.
DSCR
20% down · 8.5% · 30yr
- Down + closing
- —
- Monthly P&I
- —
- Monthly cashflow
- —
- DSCR
- —
- Eligible?
- —
No personal income docs; deal must DSCR.
Hard money
10% down · 12.0% · 12mo
- Down + closing
- —
- Monthly P&I
- —
- Monthly cashflow
- —
- DSCR
- —
- Eligible?
- —
Short-term bridge; refi at stabilization.
Listing history 14 events
-
2026-06-18days on market $60,000 Active 9 DOM
-
2026-06-17days on market $60,000 Active 8 DOM
-
2026-06-16days on market $60,000 Active 7 DOM
-
2026-06-15days on market $60,000 Active 6 DOM
-
2026-06-13days on market $60,000 Active 4 DOM
-
2026-06-12days on market $60,000 Active 3 DOM
-
2026-06-09remarks 503-char remark
-
2026-06-09statusdays on market $60,000 Active 1 DOM
-
2026-05-04historical
-
2026-04-21$60,000 Active
-
2026-04-03historical
-
2026-01-28$60,000 Active
-
2026-01-28historical
-
2025-11-12$70,200 Active
ⓘ Source: listings_history table (triggers on properties + properties_extension) + one-shot
backfill from property_details.listing_events for pre-trigger history.
Tax reassessment forecast NY · Partial reset (capped growth)
- Current annual tax
- $2,380 · $198/mo
- Projected year-2 tax
- $2,380 · $198/mo
- Expected delta
- $0/yr ($0/mo · 0.0%)
ⓘ Screening estimate from a state-policy table — verify with the county assessor before closing.
Climate risk First Street
- Flood 5/10 Major FEMA zone X (unshaded) · 47% chance over 30 yrs
- Wildfire 1/10 Low
- Heat 2/10 Low 8 d/yr ≥89°F today · 18 d/yr by 30 yrs out
- Wind 2/10 Low 100% chance of damaging wind over 30 yrs
- Air quality 1/10 Low 0 unhealthy d/yr today · 0 by 30 yrs out
Nearby sold comps map
Loading sold comps map…
Walkable amenities ~0.75 mi
Loading nearby amenities…
Taxation est. · year 1
- Rental income
- $16,770
- − Mortgage interest
- −$3,361
- − Property taxes
- −$2,380
- − Insurance
- −$300
- − Repairs & maintenance
- −$1,342
- − Management
- −$1,342
- − Depreciation
- −$1,745
- Taxable income
- $6,300
- Est. tax owed @ 24.0%
- −$1,512
- After-tax cash flow
- $5,280/yr
For passive investors: Depreciation is non-cash, so a rental often shows a tax loss while cash-flowing — sheltering income. Rental losses are passive: they offset passive income freely, and up to $25,000/yr can offset ordinary (W-2) income if you actively participate and your MAGI is under $100k (phasing out to $0 by $150k); unused losses carry forward. On sale, claimed depreciation is recaptured at up to 25%, and gains may owe capital-gains tax (a 1031 exchange can defer both). Figures are a year-1 estimate at your 24.0% rate — not tax advice; consult a CPA.
Schools (NCES district)
- District
- Cherry Valley-Springfield Central School District
- NCES district ID
- 3600006
- Math proficiency
- 45% ▲ 5.00%
- Reading proficiency
- 45% ▲ 10.00%
- Median HH income
- $49,619
- Composite
- 40.82/100
- National rank
- #7553
- State rank
- #564 of 755 in NY
Livability — Westford
No livability data for this city. (Only ~50 U.S. cities are tracked.)
Census & demographics
- Population (ZIP)
- 4,536
Population outlook (Otsego County) Hauer SSP2
- Today (2025)
- 57,987 people
- By 2030
- 55,403 · -4.5%
- By 2040
- 50,336 · -13.2%
- By 2050
- 45,715 · -21.2%
- By 2075
- 38,769 · -33.1%
- By 2100
- 33,468 · -42.3%
Race, ethnicity, and origin ACS 2023
- Neighborhood character
- Predominantly White (85%)
- Race & ethnicity
- White 85% Asian 5% Two or more races 4% Hispanic / Latino 4% Black 2%
- Common ancestry
- Slovak 8% Romanian 5% Portuguese 3%
- Foreign-born
- 10% · Canada, China
- Languages at home
- 89% English-only · Other Indo-European 4% Spanish 2% Tagalog/Filipino 1%
Political lean MEDSL · Otsego
- 2024 margin
- Lean R (+7.9) · D 46.1% · R 53.9%
- 2008→2024 swing
- -13.8pp toward R · 2008: 5.9pp · 2024: -7.9pp
- All cycles
- 2024: R+7.9 2020: R+5.0 2016: R+13.0 2012: D+2.0 2008: D+5.9
Not yet ingested
- Civics
- —
Market trends
- HPI YoY
- ▲ 40.77%
- Current HPI
- 415.0073
- Rent YoY
- —
- Metro
- —
- State GDP YoY
- ▲ 2.60%
- F500 in state
- 92
Industry mix (Fortune 500 HQ in NY)
| Industry | F500 HQs | Revenue |
|---|---|---|
| Financial Services | 10 | $950B |
|
||
| Consumer Goods | 9 | $162B |
|
||
| Insurance | 4 | $225B |
|
||
| Telecommunications | 2 | $144B |
|
||
| Pharmaceuticals | 2 | $112B |
|
||
| Media / Entertainment | 2 | $69B |
|
||
Price history
-14.5% since first listed7 events — show timeline
- 2026-06-08 Listed $60,000 Global MLS
- 2026-05-04 Listing Removed — UNYREIS
- 2026-04-21 Listed $60,000 UNYREIS
- 2026-04-03 Listing Removed — UNYREIS
- 2026-01-28 Listing Removed — UNYREIS
- 2026-01-28 Listed $60,000 UNYREIS
- 2025-11-12 Listed $70,200 UNYREIS
Property tax history
+1.3%/yrLatest (2025): $2,380 · -0.6% YoY. Source: county tax records.
Cash-flow waterfall
monthlySold comps — $/sqft
last 12 mo · ≤1 miLoading sold comps…