240 Gus Loop · West Lake Hills, TX
Flood risk No data
- FEMA flood zone
- —
- Chance of flooding over 30 yrs
- —
- Est. flood insurance / yr
- —
Fire risk No data
- Est. fire insurance / yr
- —
Heat risk No data
- Hot days now (above threshold)
- —
- Hot days in 30 yrs
- —
Wind risk No data
- Chance of severe wind over 30 yrs
- —
Air-quality risk No data
- Unhealthy air days now
- —
- Unhealthy air days in 30 yrs
- —
Risk factors via First Street. Map © Google.
Why this score? — see what drove the B grade
The composite is a weighted blend of 9 inputs, each scored 0–100. Each bar is that input's sub-score; the figure is the points it added to the 100-point composite (weight × sub-score).
- Cash flow +27.3/30.0
- ARV discount +15.0/15.0
- DSCR +9.5/10.0
- 1% rule +7.6/10.0
- Schools +6.8/10.0
- Livability +3.4/5.0
- Condition / age +2.5/5.0
- Rent growth +1.6/5.0
- Appreciation +0.0/10.0
$344,900
🖨 Deal sheet (PDF) 📄 Offer letter ✓ Due diligence
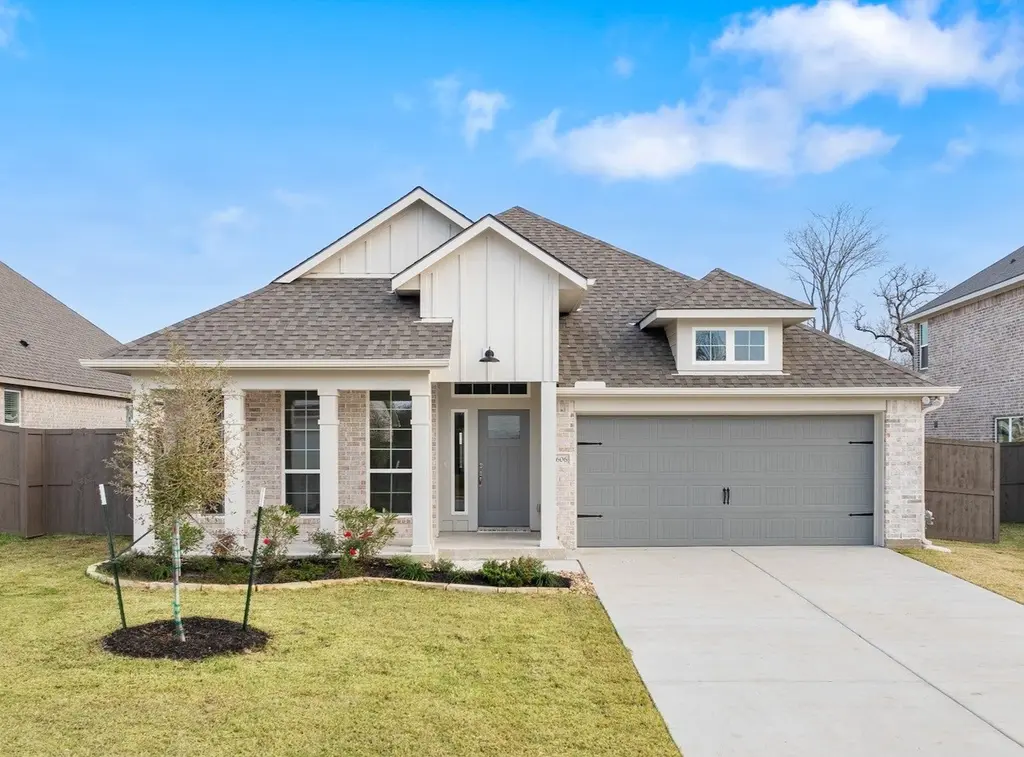
Listing remarks
If charm and elegance are what you're looking for - Welcome home! A favorite of many, the 1818 has several features that make it stand out from the rest. From the moment your eyes catch the stunning exterior, you're captivated. Interior features include dual living areas to use as you choose, a large kitchen with granite-topped island that is open through the dining and living room, stunning windows flowing with natural light, an optional study alcove, and a spacious primary suite. Stylecraft's selections round out everything that make this floor plan so special. Additional options included: 4th bedroom option, stainless steel appliances, integral miniblinds in the rear door, and single bas
Key facts
- High ceiling foyer
- Open-concept kitchen
- Natural light
Tags
Property features AI
Finance
- HOA & community: Homeowners association: Rancho San Gabriel Residential Community Inc.; Annual HOA fee of $480 covering common area maintenance and grounds maintenance
Exterior
- Parking: Attached garage with 2 covered spaces; Driveway parking (2 total spaces)
- Utilities: Electricity available; Public water; Public sewer
- Home design: Single-story home; New construction by Stylecraft; Faces southeast; Slab foundation
- Construction: Built by builder (new construction); Brick and cement siding exterior; Composition/shingle roof
- Exterior features: Covered patio; Privacy wood fencing
Interior
- Kitchen: Dishwasher; Electric oven; Electric range; Microwave; Garbage disposal; Granite counters; Pantry
- Bedrooms: Four main-level bedrooms
- Flooring: Carpet; Tile; Vinyl
- Bathrooms: Two full bathrooms
- Heating & cooling: Electric heating; Electric cooling; Ceiling fans
- Interior features: Ceiling fans; Double vanity; Granite counters; Main level primary suite; Pantry
- Laundry & utility: Dedicated laundry room; Washer hookup; Electric dryer hookup; Electric water heater
Neighborhood map
What this means for you Summary
Snapshot
- This is a 4-bed/2.0-bath single-family listed at $345k.
Deal economics
- At list price, monthly cash flow is $997 ($12k/yr) — positive.
- The deal already cash-flows at list — no discount required.
- Meets the 1% rule at list price ($4k rent vs $345k).
Location & tenants
- Location reads 68/100 on livability (#466 in TX) — a middle-class / working-renter tenant base. Strengths: employment A+, health & safety A+, housing A; Watch: amenities F, commute F, cost of living F.
- Eanes ISD (suburban): math 70% / reading 74% proficiency, ranked #5 of 826 in TX (top 1%) — strong family-tenant draw, lease renewals of 3-5y typical; only 4% free/reduced lunch — higher-income household profile.
- Zoned schools: Eanes El (math 63% / reading 71%, grade B+, #199 of 4,322 statewide, top 5%, 526 students, 5% FRL); Hill Country Middle (math 72% / reading 72%, grade A, #52 of 1,662 statewide, top 3%, 975 students, 0% FRL); Westlake H S (math 76% / reading 89%, grade A, #23 of 1,632 statewide, top 1%, 2,825 students, 0% FRL) — zoned schools at 2% FRL track the district average.
- Market conditions: Rents falling (-3.5%/yr); 571 active listings in the ZIP; 11 comparable units currently listed for rent nearby; rentals at typical pace (median 20d on market — plan ~3-4 weeks tenant-placement turnaround); solid renter incomes; 17,121 units permitted in Travis County in 2024 (11,963 in 5+ unit buildings).
- At $4,329/mo this rent would consume 52% of the median local household income ($100k/yr) (locally 1384% of renters already pay >50% of income on rent) — very limited rent-growth headroom before tenants either downsize or default.
Forward outlook
- Local home prices are declining (-3.0%/yr); year-one equity from $2k of loan paydown is wiped out by about $10k of value loss. Plan a longer hold.
- Travis County population projected at +60% by 2050 — long-run rental-demand tailwind backs the buy-and-hold thesis.
Negotiation context
- Only 2 days on market — expect competitive offers; lowballing is unlikely to land.
Questions for the listing agent
- What does the HOA fee cover, when was the last increase, and are there any pending special assessments or reserve-fund shortfalls?
- Is there a deadline driving the sale (1031 exchange, divorce, estate, relocation)? That informs how much negotiation room exists.
- Schools are A-rated — typically a magnet for longer-tenancy family renters. What's the average tenant stay here, and is there a school-zone premium baked into asking?
- What's the average days-on-market for RENTAL listings here right now (not sales)? A rising rental-DOM trend means longer vacancies and softer asking-rent achievability than the comps imply.
- What's the recent tenant-quality profile in this submarket — average credit score on applications, eviction rate, late-payment / NSF rate, and stable-employment percentage? A property-management company in the area should have these aggregated.
- How much new for-sale + rental construction is in the pipeline within 1–3 miles? Heavy new supply typically softens prices + rents 12–24 months out; constrained supply supports both.
Investment metrics
- 1% rule
- 1.26% ✓
- Cap rate
- 9.76%
- Cash-on-cash
- 12.39%
- DSCR
- 1.55
- GRM
- 6.6
CMA / ARV
- ARV (median comp)
- $450,843
- List price
- $344,900
- Delta
- -23.50%
- Verdict
- UNDERPRICED
- Comps
- 3 within 1.0 mi
Show comp detail 7 sales within ~0.75 mi
| Address | Dist | Beds/Ba | Sqft | Sold | Price | $/sf | Match |
|---|---|---|---|---|---|---|---|
| 209 Westlake Dr | 0.33mi | 4/2.0 | 1,914 (+3%) | 20mo | $1,250,000 | $653 | 62 |
| 3500 Peregrine Falcon Dr | 0.71mi | 3/2.5 (-1) | 1,833 (-1%) | 3mo | $1,200,000 | $655 | 55 |
| 306 Briarwood Trl | 0.49mi | 4/2.0 | 2,104 (+13%) | 2mo | $1,695,000 | $806 | 53 |
| 3409 Rosefinch Trl | 0.54mi | 3/2.0 (-1) | 1,991 (+7%) | 10mo | $1,000,000 | $502 | 49 |
| 3627 Peregrine Falcon Dr | 0.63mi | 3/2.5 (-1) | 2,004 (+8%) | 1mo | $1,290,000 | $644 | 49 |
| 466 Spiller Ln | 0.72mi | 3/2.0 (-1) | 1,820 (-2%) | 12mo | $1,200,000 | $659 | 48 |
| 1205 Dusky Thrush Trl | 0.48mi | 3/2.5 (-1) | 1,608 (-13%) | 1mo | $850,000 | $529 | 47 |
Match score weights: distance 35% · size 25% · config 20% · recency 20%. Top-matched comps best support the ARV.
Projected returns pro-forma
-3.0% appreciation · 0.0% rent growth · sell at horizon
- IRR
- -1.4%
- Equity multiple
- 0.95×
- Total profit
- $-5,005
- Equity at exit
- $51,426
- IRR
- 4.7%
- Equity multiple
- 1.30×
- Total profit
- $28,717
- Equity at exit
- $29,821
Cash invested: $96,572 (down + closing). Projections, not guarantees.
Landlord ↔ Tenant lean methodology
- Overall (STATE)
- 87 Strongly Landlord-Friendly
- State Texas
- 87 Strongly Landlord-Friendly · R+5
- County
- — inherits STATE
- City
- — inherits STATE
ZIP-level market 78626
- Rents YoY
- -3.5%
- Active inventory
- 571
- Price-to-rent
- 6.6×
Monthly cashflow live
- Estimated rent
- $4,329 high interval (Pro) →
- Mortgage (P&I)
- −$1,809
- Tax est. 1.5%
- −$431 /mo · $5,174/yr
- Insurance
- −$144
- HOA
- −$40
- Vacancy / Maint / Mgmt
- −$909
- Net cashflow
- $997
Break-even live
Sensitivity live
| Price | -10% $1,235 | -5% $1,116 | +0% $997 | +5% $878 | +10% $758 |
|---|---|---|---|---|---|
| Rent | -10% $655 | -5% $826 | +0% $997 | +5% $1,168 | +10% $1,339 |
| Rate | -1.0pp $1,170 | -0.5pp $1,084 | base $997 | +0.5pp $907 | +1.0pp $816 |
UW: 25.0% down · 7.5% · 30yr · 1.5% tax · 5.0% vac · 8.0% maint · 8.0% mgmt
Financing live
Cash to close
- Down payment
- $86,225
- Closing costs
- $10,347
- Reserves months
- —
- Total cash needed
- —
Loan-product check · same deal, 3 products live
Conventional
25% down · 7.5% · 30yr
- Down + closing
- —
- Monthly P&I
- —
- Monthly cashflow
- —
- DSCR
- —
- Eligible?
- —
Personal DTI + credit; lowest rate.
DSCR
20% down · 8.5% · 30yr
- Down + closing
- —
- Monthly P&I
- —
- Monthly cashflow
- —
- DSCR
- —
- Eligible?
- —
No personal income docs; deal must DSCR.
Hard money
10% down · 12.0% · 12mo
- Down + closing
- —
- Monthly P&I
- —
- Monthly cashflow
- —
- DSCR
- —
- Eligible?
- —
Short-term bridge; refi at stabilization.
Rent comps 11 comps
| Address | Beds | Baths | Sqft | Rent | $/sqft | DOM | Units | Dist |
|---|---|---|---|---|---|---|---|---|
| 100 McConnell Dr West Lake Hills, TX | 3.0 | 2.5 | 1600 | $3,995 | $2.50 | 19d | 1 | 0.33mi |
| 208 Westhaven Dr West Lake Hills, TX | 3.0 | 2.5 | 2448 | $4,275 | $1.75 | 23d | 1 | 0.38mi |
| 1503 Terrapin Ct Austin, TX | 3.0 | 2.0 | 2238 | $4,975 | $2.22 | 45d | 1 | 0.91mi |
| 6 Sugar Creek Dr West Lake Hills, TX | 3.0 | 2.5 | 2380 | $6,000 | $2.52 | 25d | 1 | 1.02mi |
| 3204 Twinberry Cv Unit A Austin, TX | 3.0 | 2.5 | 1280 | $3,100 | $2.42 | 19d | 1 | 1.21mi |
| 2001 Wychwood Dr Austin, TX | 4.0 | 3.5 | 2300 | $10,500 | $4.57 | 25d | 1 | 1.23mi |
| 405 Ridgewood Rd Austin, TX | 3.0 | 2.0 | 1905 | $5,500 | $2.89 | 23d | 1 | 1.25mi |
| 1430 Redbud Cv West Lake Hills, TX | 3.0 | 2.0 | 1460 | $2,800 | $1.92 | 0d | 1 | 1.30mi |
| 2500 Walsh Tarlton Ln Unit 2533 Austin, TX | 3.0 | 2.0 | 2195 | $6,180 | $2.82 | 0d | 1 | 1.32mi |
| 2500 Walsh Tarlton Ln Unit 3018 Austin, TX | 3.0 | 2.0 | 2194 | $5,259 | $2.40 | 19d | 1 | 1.32mi |
| 1918 Holly Hill Dr Unit A Austin, TX | 3.0 | 2.5 | 1504 | $3,100 | $2.06 | 16d | 1 | 1.44mi |
HOA detail
- Monthly dues
- $40 · $480/yr
Listing history 13 events
-
2026-06-13statusdays on market $344,900 Pending 2 DOM
-
2026-06-09days on market $344,900 Active 171 DOM
-
2026-06-08days on market $344,900 Active 170 DOM
-
2026-06-07days on market $344,900 Active 169 DOM
-
2026-06-03days on market $344,900 Active 165 DOM
-
2026-06-02days on market $344,900 Active 164 DOM
-
2026-06-01days on market $344,900 Active 163 DOM
-
2026-05-31days on market $344,900 Active 162 DOM
-
2026-05-18price $344,900 715-char remark
-
2026-05-13price $345,900 715-char remark
-
2026-02-27price $344,900 715-char remark
-
2026-01-22price $347,900 715-char remark
-
2025-12-20$347,500 Active 715-char remark
ⓘ Source: listings_history table (triggers on properties + properties_extension) + one-shot
backfill from property_details.listing_events for pre-trigger history.
Nearby sold comps map
Loading sold comps map…
Walkable amenities ~0.75 mi
Loading nearby amenities…
Taxation est. · year 1
- Rental income
- $51,953
- − Mortgage interest
- −$19,320
- − Property taxes
- −$5,174
- − Insurance
- −$1,724
- − Repairs & maintenance
- −$4,156
- − Management
- −$4,156
- − HOA
- −$480
- − Depreciation
- −$10,033
- Taxable income
- $6,909
- Est. tax owed @ 24.0%
- −$1,658
- After-tax cash flow
- $10,302/yr
For passive investors: Depreciation is non-cash, so a rental often shows a tax loss while cash-flowing — sheltering income. Rental losses are passive: they offset passive income freely, and up to $25,000/yr can offset ordinary (W-2) income if you actively participate and your MAGI is under $100k (phasing out to $0 by $150k); unused losses carry forward. On sale, claimed depreciation is recaptured at up to 25%, and gains may owe capital-gains tax (a 1031 exchange can defer both). Figures are a year-1 estimate at your 24.0% rate — not tax advice; consult a CPA.
Schools (NCES district)
- District
- Eanes ISD
- NCES district ID
- 4817760
- Math proficiency
- 70% ▼ -11.00%
- Reading proficiency
- 74% ▼ -8.00%
- Median HH income
- $127,896
- Composite
- 68.46/100
- National rank
- #344
- State rank
- #5 of 826 in TX
Livability — West Lake Hills
- Score
- 68/100
- State rank
- #466
- US rank
- #9345
Category grades
Schools grade is shown separately in the Schools card above.
Census & demographics
- Census place
- West Lake Hills, TX
- County
- Williamson County · 680,029 people
- City population
- 28,256
- Metro
- Austin-Round Rock-Georgetown, TX
- Population (ZIP)
- 48,072
- Household income
- $100,431
- Rent vs Own
- Severe rent burden
- 1384.0
Population outlook (Travis County) Hauer SSP2
- Today (2025)
- 1,545,133 people
- By 2030
- 1,729,269 · +11.9%
- By 2040
- 2,097,596 · +35.8%
- By 2050
- 2,463,890 · +59.5%
- By 2075
- 3,249,374 · +110.3%
- By 2100
- 3,801,868 · +146.1%
Race, ethnicity, and origin ACS 2023
- Neighborhood character
- Diverse neighborhood (Simpson 0.61)
- Race & ethnicity
- White 53% Hispanic / Latino 33% Two or more races 18% Black 8% Asian 3%
- Hispanic origin (detail)
- Mexican 26% Puerto Rican 2%
- Common ancestry
- Slovak 2% Lithuanian 2% Italian 2%
- Foreign-born
- 13% · Canada, China, Jamaica
- Languages at home
- 75% English-only · Spanish 18% Other Indo-European 2% French/Haitian/Cajun 1%
Political lean MEDSL · Travis
- 2024 margin
- Solid D (+39.3) · D 68.8% · R 29.4% · Other 1.8%
- 2008→2024 swing
- +9.9pp toward D · 2008: 29.4pp · 2024: 39.3pp
- All cycles
- 2024: D+39.3 2020: D+45.0 2016: D+38.9 2012: D+23.9 2008: D+29.4
Not yet ingested
- Civics
- —
Market trends
- HPI YoY
- ▼ -215.77%
- Current HPI
- 198.0316
- Rent YoY
- ▼ -3.48%
- Metro
- Austin-Round Rock-Georgetown, TX
- State GDP YoY
- ▲ 3.95%
- F500 in state
- 110
Industry mix (Fortune 500 HQ in TX)
| Industry | F500 HQs | Revenue |
|---|---|---|
| Energy | 16 | $1,198B |
|
||
| Technology | 5 | $198B |
|
||
| Engineering / Construction | 4 | $72B |
|
||
| Energy Services | 3 | $60B |
|
||
| Utilities | 3 | $41B |
|
||
| Healthcare | 2 | $330B |
|
||
Cash-flow waterfall
monthlySold comps — $/sqft
last 12 mo · ≤1 miLoading sold comps…