 🏗️ New Construction
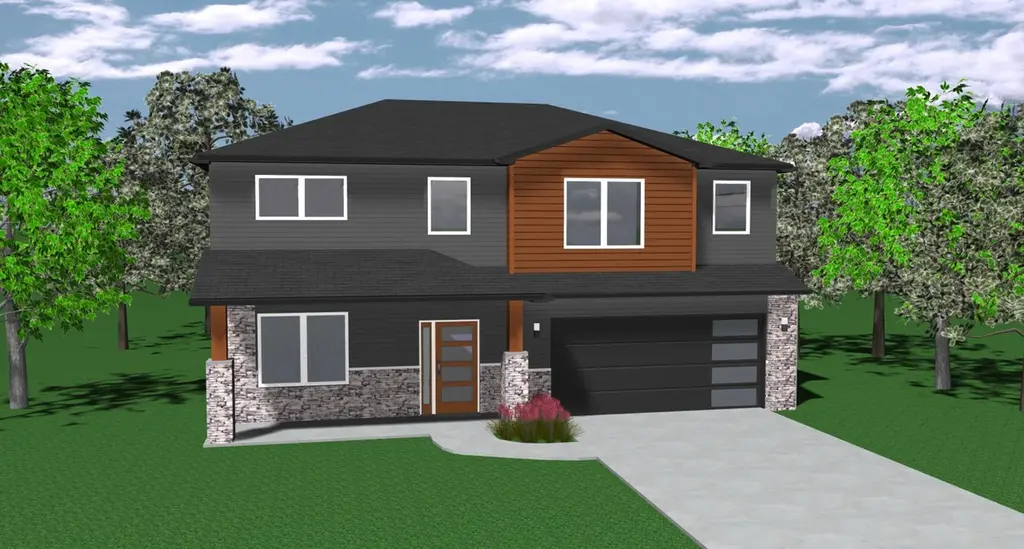
Lancia's Cottage Plan · Fort Wayne, IN
Flood risk 1/10 · Minimal
- FEMA flood zone
- X (shaded)
- Chance of flooding over 30 yrs
- 0.0%
- Est. flood insurance / yr
- $507 – $1,088
Fire risk 1/10 · Minimal
- Est. fire insurance / yr
- $717 – $1,331
Heat risk 3/10 · Minor
- Hot days now (above 100°F)
- 7 days/yr
- Hot days in 30 yrs
- 17 days/yr
Wind risk 2/10 · Minimal
- Chance of severe wind over 30 yrs
- —
Air-quality risk 3/10 · Minor
- Unhealthy air days now
- 2 days/yr
- Unhealthy air days in 30 yrs
- 3 days/yr
Risk factors via First Street. Map © Google.
Why this score? — see what drove the F grade
The composite is a weighted blend of 9 inputs, each scored 0–100. Each bar is that input's sub-score; the figure is the points it added to the 100-point composite (weight × sub-score).
- ARV discount +7.5/15.0
- Cash flow +6.0/30.0
- Rent growth +5.0/5.0
- Schools +4.9/10.0
- Livability +4.2/5.0
- 1% rule +1.5/10.0
- Condition / age +1.0/5.0
- DSCR +0.4/10.0
- Appreciation +0.0/10.0
$303,900
🖨 Deal sheet 📄 Offer letter ✓ Due diligence
Listing remarks MLS
THIS IS A SAMPLE PLAN - THIS IS NOT A HOME FOR SALE. Lancia Homes Cottage floorplan has a Craftsman style or a Modern look! This home with 2,615 sq. ft. 4 Bedroom's, 2.5 Bath's features an open floorplan with an office, Laundry Room and a bonus Loft area for 2nd living. Large owner suite has a cathedral or tray ceiling, walk-in closet and Owner Suite Bath with shower. Lots of room to spread out in. * Base price does not include land
Key facts
- 2 parking spots
- Listed 300 days
Neighborhood map
What this means for you Summary
Snapshot
- This is a 4-bed/2.5-bath single-family listed at $304k. Condition is rated poor.
Deal economics
- At list price, monthly cash flow is $-865 ($-10k/yr) — negative.
- The deal already cash-flows at list — no discount required.
- To meet the 1% rule (rent ≥ 1% of price), the offer needs to be $292k (3.8% below list).
- Recommended offer: $267k (12.0% below list) — sets the bar for market timing.
Location & tenants
- Location reads 84/100 on livability (#6 in IN, #676 nationally) — a professional / high-income tenant draw. Strengths: amenities A+, commute A+, cost of living A+; Watch: crime C-, schools D+, employment D+.
- Northwest Allen County Schools (rural): math 51% / reading 58% proficiency, ranked #25 of 301 in IN (top 8%) — acceptable for families but not a draw, mixed tenant base, ~2y average lease; only 11% free/reduced lunch — higher-income household profile.
- Market conditions: Rents rising fast (+10.5%/yr); 220 active listings in the ZIP; 2 comparable units currently listed for rent nearby; high-income renter base; 1,861 units permitted in Allen County in 2024 (576 in 5+ unit buildings).
- This rent runs 31% of the median local income ($113k/yr) — at the standard rent-burdened threshold; future hikes will face affordability resistance.
Forward outlook
- Local home prices are declining (-3.0%/yr); year-one equity from $3k of loan paydown is wiped out by about $14k of value loss. Plan a longer hold.
- Allen County population projected at +10% by 2050 — modest demand growth; plan on rents tracking national, not racing it.
Negotiation context
- It's been on market 300 days — a 12% lower offer ($267k) is reasonable based on typical stale-listing flexibility.
Questions for the listing agent
- What do current leases actually rent for vs. the listed asking? Can we see a recent rent roll and the last 12 months of T-12 income?
- It's been on market 300 days. Have you received any prior offers? Is the seller open to a 12% concession, seller financing, or rate buy-down credit?
- Have any recent inspections been done? Can we get a copy of the seller's disclosures and any deferred-maintenance estimates?
- What does the HOA fee cover, when was the last increase, and are there any pending special assessments or reserve-fund shortfalls?
- Why hasn't it sold? Are there any deal-killer items the seller is aware of (foundation, flood, title, zoning, code violations)?
- Is there a deadline driving the sale (1031 exchange, divorce, estate, relocation)? That informs how much negotiation room exists.
- Schools are D-rated, which usually means shorter tenancies and higher turnover. Who's the typical renter profile here, and what's been the actual vacancy rate?
- The area grade is low — what's the realistic commute time and amenity access for the typical tenant pool here? Any planned neighborhood developments (good or bad) we should know about?
- What's the average days-on-market for RENTAL listings here right now (not sales)? A rising rental-DOM trend means longer vacancies and softer asking-rent achievability than the comps imply.
- What's the recent tenant-quality profile in this submarket — average credit score on applications, eviction rate, late-payment / NSF rate, and stable-employment percentage? A property-management company in the area should have these aggregated.
- How much new for-sale + rental construction is in the pipeline within 1–3 miles? Heavy new supply typically softens prices + rents 12–24 months out; constrained supply supports both.
Investment metrics
- 1% rule
- 0.65% ✗
- Cap rate
- 4.00%
- Cash-on-cash
- -8.19%
- DSCR
- 0.64
- GRM
- 12.9
CMA / ARV
- ARV (median comp)
- $452,225
- List price
- $303,900
- Delta
- -32.80%
- Verdict
- UNDERPRICED
- Comps
- 20 within 1.0 mi
Show comp detail 12 sales within ~0.75 mi
| Address | Dist | Beds/Ba | Sqft | Sold | Price | $/sf | Match |
|---|---|---|---|---|---|---|---|
| 628 Grantham Psge | 0.11mi | 4/2.5 | 2,917 (+12%) | 2mo | $610,000 | $209 | 74 |
| 377 Carrara Cv | 0.36mi | 4/2.5 | 2,444 (-6%) | 2mo | $449,900 | $184 | 71 |
| 11421 Trails North Dr | 0.49mi | 4/2.5 | 2,678 (+2%) | 4mo | $349,900 | $131 | 70 |
| 1021 Wingate Dr | 0.46mi | 3/3.5 (-1) | 2,661 (+2%) | 1mo | $270,000 | $101 | 66 |
| 12124 Wellingham Ct | 0.50mi | 4/2.5 | 2,452 (-6%) | 3mo | $330,000 | $135 | 64 |
| 516 Grantham Psge | 0.18mi | 3/2.5 (-1) | 2,934 (+12%) | 4mo | $610,000 | $208 | 63 |
| 606 Grantham Psge | 0.12mi | 3/2.0 (-1) | 2,259 (-14%) | 4mo | $557,000 | $247 | 61 |
| 11718 Grand River Dr | 0.27mi | 3/2.5 (-1) | 2,284 (-13%) | 1mo | $371,828 | $163 | 61 |
| 280 Montalcino Run | 0.42mi | 5/2.5 (+1) | 2,340 (-10%) | 1mo | $440,000 | $188 | 57 |
| 12057 Falcatta Dr | 0.40mi | 4/2.5 | 2,241 (-14%) | 1mo | $429,320 | $192 | 56 |
| 210 Dittons Way | 0.39mi | 4/2.5 | 2,264 (-13%) | 4mo | $387,000 | $171 | 56 |
| 11510 Trails North Dr | 0.51mi | 5/3.5 (+1) | 2,716 (+4%) | 7mo | $300,000 | $110 | 55 |
Match score weights: distance 35% · size 25% · config 20% · recency 20%. Top-matched comps best support the ARV.
Projected returns pro-forma
-3.0% appreciation · 8.0% rent growth · sell at horizon
- IRR
- -25.2%
- Equity multiple
- 0.11×
- Total profit
- $-112,823
- Equity at exit
- $67,428
- IRR
- -10.6%
- Equity multiple
- 0.22×
- Total profit
- $-98,508
- Equity at exit
- $39,100
Cash invested: $126,623 (down + closing). Projections, not guarantees.
Landlord ↔ Tenant lean methodology
- Overall (STATE)
- 90 Strongly Landlord-Friendly
- State Indiana
- 90 Strongly Landlord-Friendly · R+11
- County
- — inherits STATE
- City
- — inherits STATE
ZIP-level market 46845
- Home prices YoY
- -34.6%
- Rents YoY
- 10.5%
- Active inventory
- 220
- Price-to-rent
- 8.7×
Monthly cashflow live
- Estimated rent
- $2,925 medium interval (Pro) →
- Mortgage (P&I)
- −$2,372
- Tax est. 1.5%
- −$565 /mo · $6,783/yr
- Insurance
- −$188
- HOA
- −$50
- Vacancy / Maint / Mgmt
- −$614
- Net cashflow
- $-865
Break-even live
UW: 25.0% down · 7.5% · 30yr · 1.5% tax · 5.0% vac · 8.0% maint · 8.0% mgmt
Financing live
Cash to close
- Down payment
- $113,056
- Closing costs
- $13,567
- Reserves months
- —
- Total cash needed
- —
Loan-product check · same deal, 3 products live
Conventional
25% down · 7.5% · 30yr
- Down + closing
- —
- Monthly P&I
- —
- Monthly cashflow
- —
- DSCR
- —
- Eligible?
- —
Personal DTI + credit; lowest rate.
DSCR
20% down · 8.5% · 30yr
- Down + closing
- —
- Monthly P&I
- —
- Monthly cashflow
- —
- DSCR
- —
- Eligible?
- —
No personal income docs; deal must DSCR.
Hard money
10% down · 12.0% · 12mo
- Down + closing
- —
- Monthly P&I
- —
- Monthly cashflow
- —
- DSCR
- —
- Eligible?
- —
Short-term bridge; refi at stabilization.
Rent comps 2 comps
| Address | Beds | Baths | Sqft | Rent | $/sqft | DOM | Units | Dist |
|---|---|---|---|---|---|---|---|---|
| 11111 Kings Xing Fort Wayne, IN | 4.0 | 2.5 | 3700 | $3,600 | $0.97 | 21d | 1 | 0.71mi |
| 562 Highfields Cv Fort Wayne, IN | 4.0 | 2.5 | 2413 | $2,700 | $1.12 | 21d | 1 | 1.44mi |
HOA detail
- Monthly dues
- $50 · $600/yr
Listing history 16 events
-
2026-06-18days on market $303,900 Active 300 DOM
-
2026-06-17days on market $303,900 Active 299 DOM
-
2026-06-16days on market $303,900 Active 298 DOM
-
2026-06-15days on market $303,900 Active 297 DOM
-
2026-06-14days on market $303,900 Active 295 DOM
-
2026-06-13days on market $303,900 Active 294 DOM
-
2026-06-10days on market $303,900 Active 292 DOM
-
2026-06-09days on market $303,900 Active 291 DOM
-
2026-06-08days on market $303,900 Active 290 DOM
-
2026-06-07days on market $303,900 Active 289 DOM
-
2026-06-03days on market $303,900 Active 285 DOM
-
2026-06-02pricedays on market $303,900 Active 284 DOM
-
2026-06-01days on market $298,600 Active 283 DOM
-
2026-05-31days on market $298,600 Active 282 DOM
-
2026-05-30days on market $298,600 Active 281 DOM
-
2025-08-22$298,600 Active 436-char remark
Show marketing remark (436 chars)
THIS IS A SAMPLE PLAN - THIS IS NOT A HOME FOR SALE. Lancia Homes Cottage floorplan has a Craftsman style or a Modern look! This home with 2,615 sq. ft. 4 Bedroom's, 2.5 Bath's features an open floorplan with an office, Laundry Room and a bonus Loft area for 2nd living. Large owner suite has a cathedral or tray ceiling, walk-in closet and Owner Suite Bath with shower. Lots of room to spread out in. * Base price does not include land
ⓘ Source: listings_history table (triggers on properties + properties_extension) + one-shot
backfill from property_details.listing_events for pre-trigger history.
Climate risk First Street
- Flood 1/10 Low FEMA zone X (shaded) · 0% chance over 30 yrs
- Wildfire 1/10 Low
- Heat 3/10 Moderate 7 d/yr ≥100°F today · 17 d/yr by 30 yrs out
- Wind 2/10 Low
- Air quality 3/10 Moderate 2 unhealthy d/yr today · 3 by 30 yrs out
Nearby sold comps map
Loading sold comps map…
Walkable amenities ~0.75 mi
Loading nearby amenities…
Taxation est. · year 1
- Rental income
- $35,096
- − Mortgage interest
- −$25,332
- − Property taxes
- −$6,783
- − Insurance
- −$2,261
- − Repairs & maintenance
- −$2,808
- − Management
- −$2,808
- − HOA
- −$600
- − Depreciation
- −$13,156
- Taxable loss
- −$18,651
- Est. tax savings @ 24.0%
- +$4,476
- After-tax cash flow
- $-5,900/yr
For passive investors: Depreciation is non-cash, so a rental often shows a tax loss while cash-flowing — sheltering income. Rental losses are passive: they offset passive income freely, and up to $25,000/yr can offset ordinary (W-2) income if you actively participate and your MAGI is under $100k (phasing out to $0 by $150k); unused losses carry forward. On sale, claimed depreciation is recaptured at up to 25%, and gains may owe capital-gains tax (a 1031 exchange can defer both). Figures are a year-1 estimate at your 24.0% rate — not tax advice; consult a CPA.
Condition & rehab AI · 2 photos
This home requires extensive repairs and maintenance, including a new roof, fresh siding and paint, and landscaping. Significant investment is needed to bring it up to a good condition.
Repairs flagged
- Major roof — The satellite image suggests significant damage.
- Major exterior siding — The siding appears worn and faded.
- Major exterior paint — The paint is faded and peeling.
- Major landscaping — The landscaping is sparse and in need of maintenance.
Value-add opportunities
- Resale roof replacement — A new roof would significantly improve the home's curb appeal and value.
- Resale exterior siding and paint — Fresh siding and paint would enhance the home's appearance and value.
- Both landscaping — A well-maintained landscape would improve both the home's curb appeal and rental value.
Renovation cost estimate screening
| Repair item | Severity | Est. cost |
|---|---|---|
| roof · The satellite image suggests significant damage. | Major | $15,000–50,000 |
| exterior siding · The siding appears worn and faded. | Major | $15,000–50,000 |
| exterior paint · The paint is faded and peeling. | Major | $15,000–50,000 |
| landscaping · The landscaping is sparse and in need of maintenance. | Major | $15,000–50,000 |
| Total estimated repair cost · 4 items | $60,000–200,000 |
Value-add ROI direction
- Resale roof replacement — A new roof would significantly improve the home's curb appeal and value. ↑
- Resale exterior siding and paint — Fresh siding and paint would enhance the home's appearance and value. ↑
- Both landscaping — A well-maintained landscape would improve both the home's curb appeal and rental value. ↑
ⓘ Cost ranges are severity-bucket heuristics (US national rule-of-thumb). Get contractor quotes + a written scope before underwriting a rehab budget.
Schools (NCES district)
- District
- Northwest Allen County Schools
- NCES district ID
- 1808250
- Math proficiency
- 51% ▼ -6.00%
- Reading proficiency
- 58% ▼ -5.00%
- Median HH income
- $78,952
- Composite
- 49.26/100
- National rank
- #2027
- State rank
- #25 of 301 in IN
Livability — Fort Wayne
- Score
- 84/100
- State rank
- #6
- US rank
- #676
Category grades
Schools grade is shown separately in the Schools card above.
Census & demographics
- County
- Allen County · 326,813 people
- City population
- 326,813
- Metro
- Fort Wayne, IN
- Population (ZIP)
- 29,583
- Household income
- $112,676
- Rent vs Own
- Severe rent burden
- 467.0
Population outlook (Allen County) Hauer SSP2
- Today (2025)
- 394,020 people
- By 2030
- 405,128 · +2.8%
- By 2040
- 423,476 · +7.5%
- By 2050
- 435,137 · +10.4%
- By 2075
- 450,293 · +14.3%
- By 2100
- 424,101 · +7.6%
Race, ethnicity, and origin ACS 2023
- Neighborhood character
- Predominantly White (86%)
- Race & ethnicity
- White 86% Asian 4% Two or more races 4% Hispanic / Latino 3% Black 3%
- Common ancestry
- Italian 4% Romanian 3% Lithuanian 3%
- Foreign-born
- 5% · Vietnam, Canada, China
- Languages at home
- 93% English-only · Spanish 2% Chinese 1% Vietnamese 1%
Political lean MEDSL · Allen
- 2024 margin
- R (+12.5) · D 42.9% · R 55.4% · Other 1.7%
- 2008→2024 swing
- -8.1pp toward R · 2008: -4.3pp · 2024: -12.5pp
- All cycles
- 2024: R+12.5 2020: R+11.2 2016: R+19.6 2012: R+16.8 2008: R+4.3
Not yet ingested
- Civics
- —
Market trends
- HPI YoY
- ▼ -112.27%
- Current HPI
- 212.3516
- Rent YoY
- ▲ 10.47%
- Metro
- Fort Wayne, IN
- State GDP YoY
- ▲ 2.90%
- F500 in state
- 18
Industry mix (Fortune 500 HQ in IN)
| Industry | F500 HQs | Revenue |
|---|---|---|
| Industrial Machinery | 2 | $37B |
|
||
| Healthcare | 1 | $177B |
|
||
| Pharmaceuticals | 1 | $45B |
|
||
| Metals / Steel | 1 | $18B |
|
||
| Agriculture | 1 | $17B |
|
||
| Packaging | 1 | $12B |
|
||
Price history
1 event — show timeline
- 2025-08-22 Listed $298,600 Zillow
Cash-flow waterfall
monthlySold comps — $/sqft
last 12 mo · ≤1 miLoading sold comps…