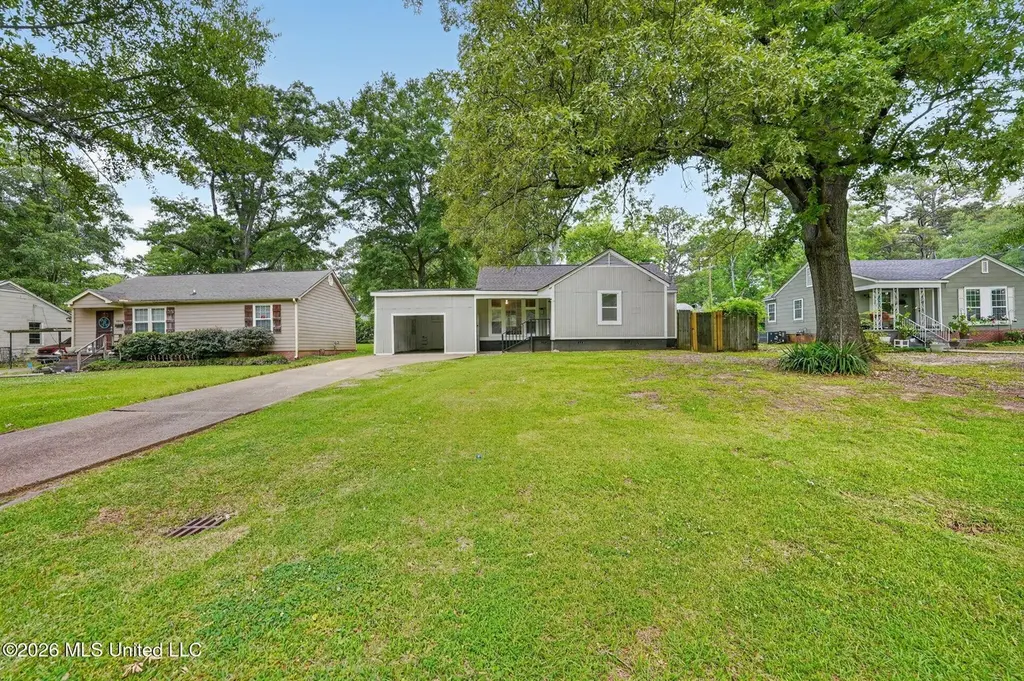
4875 Sheridan Dr · Jackson, MS
Flood risk 1/10 · Minimal
- FEMA flood zone
- X (unshaded)
- Chance of flooding over 30 yrs
- 0.0%
- Est. flood insurance / yr
- $507 – $1,088
Fire risk 1/10 · Minimal
- Est. fire insurance / yr
- $1,241 – $2,305
Heat risk 7/10 · Major
- Hot days now (above 108°F)
- 7 days/yr
- Hot days in 30 yrs
- 18 days/yr
Wind risk 8/10 · Major
- Chance of severe wind over 30 yrs
- 80.0%
Air-quality risk 2/10 · Minimal
- Unhealthy air days now
- 0 days/yr
- Unhealthy air days in 30 yrs
- 1 days/yr
Risk factors via First Street. Map © Google.
Why this score? — see what drove the B+ grade
The composite is a weighted blend of 9 inputs, each scored 0–100. Each bar is that input's sub-score; the figure is the points it added to the 100-point composite (weight × sub-score).
- Cash flow +30.0/30.0
- ARV discount +15.0/15.0
- 1% rule +10.0/10.0
- DSCR +10.0/10.0
- Livability +3.4/5.0
- Rent growth +3.2/5.0
- Condition / age +2.5/5.0
- Schools +1.1/10.0
- Appreciation +0.0/10.0
$74,900
🖨 Deal sheet 📄 Offer letter ✓ Due diligence
Listing remarks
This updated 2-bedroom, 2-bath home blends comfort, charm, and modern style. Inside, you'll find a bright, refreshed interior featuring contemporary finishes, a welcoming layout, and abundant natural light throughout. The updated kitchen and living areas create a warm and functional space perfect for everyday living and entertaining. Step outside to enjoy the spacious yard—ideal for relaxing, gardening, or hosting gatherings. Property is being offered in its current condition.
Key facts
- Spacious yard
- Updated kitchen
- 0.23 acre lot
Tags
Property features AI
Finance
- HOA & community: Other community features
Exterior
- Parking: Attached garage (1 car)
- Security: Smoke detector(s)
- Utilities: Public water; Public sewer; Electricity available; Natural gas available
- Home design: Single family residence; House; One level
- Construction: Asphalt shingle roof; Conventional foundation
- Exterior features: Back yard fencing
Interior
- Kitchen: Electric range; Freestanding refrigerator; Gas water heater
- Flooring: Vinyl flooring; Wood flooring
- Bathrooms: 1 full bathroom; 1 half bathroom
- Heating & cooling: Natural gas heating; Window air conditioning units
- Interior features: Smoke detectors installed; Wood window frames
- Laundry & utility: Washer hookup; Electric dryer hookup
Neighborhood map
What this means for you Summary
Snapshot
- This is a 2-bed/1.5-bath single-family listed at $75k.
Deal economics
- At list price, monthly cash flow is $627 ($8k/yr) — positive.
- The deal already cash-flows at list — no discount required.
- Meets the 1% rule at list price ($1k rent vs $75k).
- Recommended offer: $74k (1.5% below list) — sets the bar for market timing.
- Cap rate 16.3% vs local median 9.9% in Jackson — top-decile yield for the area; either an underpriced asset or a hidden risk that comps aren't pricing in. Stress-test before assuming the spread holds.
Location & tenants
- Location reads 68/100 on livability (#66 in MS) — a middle-class / working-renter tenant base. Strengths: commute A+, cost of living A+, housing A+; Watch: amenities F, employment F, health & safety F.
- Jackson Public School District (urban): math 9% / reading 18% proficiency, ranked #112 of 130 in MS (top 86%) — low school quality limits family demand, transient renter base, plan for 1-2y turnover; 88% free/reduced lunch — lower-income household profile, screen leases tightly.
- Zoned schools: Casey Elementary School (math 17% / reading 42%, grade F, #188 of 375 statewide, top 51%, 279 students, 100% FRL); Murrah High School (math 12% / reading 27%, grade F, #130 of 197 statewide, top 68%, 1,326 students, 100% FRL).
- Market conditions: Rents rising (+2.8%/yr); 119 active listings in the ZIP; 22 comparable units currently listed for rent nearby; rentals at typical pace (median 23d on market — plan ~3-4 weeks tenant-placement turnaround); lower-income renter base — watch delinquency; 167 units permitted in Hinds County in 2024 (0 in 5+ unit buildings).
- This rent runs 41% of the median local income ($43k/yr) — at the standard rent-burdened threshold; future hikes will face affordability resistance.
Forward outlook
- Local home prices are declining (-3.0%/yr); year-one equity from $518 of loan paydown is wiped out by about $2k of value loss. Plan a longer hold.
- Hinds County population projected to shrink 6% by 2050 — rents likely to lag national; underwrite the cash flow, not the appreciation.
- At projected returns (-3.0% appreciation + 2.8% rent growth), your $21k cash investment doubles in ~4 years — after that, you're playing with house money.
Negotiation context
- It's been on market 16 days — a 2% lower offer ($74k) is reasonable based on typical stale-listing flexibility.
- 5 sale attempts since 20y ago with the ask held roughly flat each time — persistent listings suggest the price (not the market) is what's stuck; bring a comps-based counter.
Risks & watch-outs
- Watch-outs: built in 1950 — expect roof / HVAC / electrical / plumbing capex.
- Climate carrying-cost: severe wind risk, 80% chance of damaging wind over 30y; extreme-heat days projected 7→18/yr by 2055 (HVAC capex compounding) — expect insurance premiums to compound above CPI over the hold.
Questions for the listing agent
- Built in 1950 — when were the roof, HVAC, electrical panel, plumbing, and water heater last replaced?
- Is there a deadline driving the sale (1031 exchange, divorce, estate, relocation)? That informs how much negotiation room exists.
- Schools are F-rated, which usually means shorter tenancies and higher turnover. Who's the typical renter profile here, and what's been the actual vacancy rate?
- What's the average days-on-market for RENTAL listings here right now (not sales)? A rising rental-DOM trend means longer vacancies and softer asking-rent achievability than the comps imply.
- What's the recent tenant-quality profile in this submarket — average credit score on applications, eviction rate, late-payment / NSF rate, and stable-employment percentage? A property-management company in the area should have these aggregated.
- How much new for-sale + rental construction is in the pipeline within 1–3 miles? Heavy new supply typically softens prices + rents 12–24 months out; constrained supply supports both.
Investment metrics
- 1% rule
- 1.93% ✓
- Cap rate
- 16.34%
- Cash-on-cash
- 35.87%
- DSCR
- 2.60
- GRM
- 4.3
CMA / ARV
- ARV (on-the-fly)
- $94,850
- Comps found
- 12
Show comp detail 12 sales within ~0.75 mi
| Address | Dist | Beds/Ba | Sqft | Sold | Price | $/sf | Match |
|---|---|---|---|---|---|---|---|
| 4858 Sheridan Dr | 0.05mi | 3/2.0 (+1) | 1,264 (-7%) | 2mo | $123,000 | $97 | 78 |
| 632 Woodbury Rd | 0.28mi | 2/2.0 | 1,416 (+4%) | 2mo | $115,000 | $81 | 75 |
| 610 Lawrence Rd | 0.28mi | 3/1.0 (+1) | 1,302 (-4%) | 4mo | $69,900 | $54 | 70 |
| 216 Pine Ridge Rd | 0.35mi | 3/1.5 (+1) | 1,421 (+5%) | 5mo | $124,900 | $88 | 67 |
| 130 Wacker Dr | 0.41mi | 3/1.0 (+1) | 1,302 (-4%) | 1mo | $35,000 | $27 | 67 |
| 506 Broadmoor Dr | 0.16mi | 3/2.0 (+1) | 1,187 (-12%) | 2mo | $79,900 | $67 | 63 |
| 4816 Maplewood Dr | 0.14mi | 3/2.0 (+1) | 1,510 (+11%) | 6mo | $76,720 | $51 | 62 |
| 421 Benning Rd | 0.18mi | 3/1.0 (+1) | 1,155 (-15%) | 3mo | $74,900 | $65 | 58 |
| 805 Serville Dr | 0.65mi | 3/2.0 (+1) | 1,332 (-2%) | 3mo | $150,000 | $113 | 57 |
| 764 Avalon Rd | 0.60mi | 3/2.0 (+1) | 1,287 (-5%) | 0mo | $89,900 | $70 | 56 |
| 134 Wacker Dr | 0.43mi | 3/1.0 (+1) | 1,218 (-10%) | 6mo | $70,000 | $57 | 51 |
| 214 Melbourne Rd Rd | 0.65mi | 2/1.0 | 1,207 (-11%) | 6mo | $85,000 | $70 | 45 |
Match score weights: distance 35% · size 25% · config 20% · recency 20%. Top-matched comps best support the ARV.
Projected returns pro-forma
-3.0% appreciation · 2.83% rent growth · sell at horizon
- IRR
- 31.4%
- Equity multiple
- 2.31×
- Total profit
- $27,568
- Equity at exit
- $11,168
- IRR
- 38.4%
- Equity multiple
- 4.55×
- Total profit
- $74,495
- Equity at exit
- $6,476
Cash invested: $20,972 (down + closing). Projections, not guarantees.
Landlord ↔ Tenant lean methodology
- Overall (STATE)
- 90 Strongly Landlord-Friendly
- State Mississippi
- 90 Strongly Landlord-Friendly · R+11
- County
- — inherits STATE
- City
- — inherits STATE
ZIP-level market 39206
- Home prices YoY
- -10.3%
- Rents YoY
- 2.8%
- Active inventory
- 119
- Price-to-rent
- 4.3×
Monthly cashflow live
- Estimated rent
- $1,444 high interval (Pro) →
- Mortgage (P&I)
- −$393
- Tax from tax record
- −$90 /mo · $1,074/yr
- Insurance
- −$31
- HOA
- −$0
- Vacancy / Maint / Mgmt
- −$303
- Net cashflow
- $627
Break-even live
UW: 25.0% down · 7.5% · 30yr · 1.5% tax · 5.0% vac · 8.0% maint · 8.0% mgmt
Financing live
Cash to close
- Down payment
- $18,725
- Closing costs
- $2,247
- Reserves months
- —
- Total cash needed
- —
Loan-product check · same deal, 3 products live
Conventional
25% down · 7.5% · 30yr
- Down + closing
- —
- Monthly P&I
- —
- Monthly cashflow
- —
- DSCR
- —
- Eligible?
- —
Personal DTI + credit; lowest rate.
DSCR
20% down · 8.5% · 30yr
- Down + closing
- —
- Monthly P&I
- —
- Monthly cashflow
- —
- DSCR
- —
- Eligible?
- —
No personal income docs; deal must DSCR.
Hard money
10% down · 12.0% · 12mo
- Down + closing
- —
- Monthly P&I
- —
- Monthly cashflow
- —
- DSCR
- —
- Eligible?
- —
Short-term bridge; refi at stabilization.
Rent comps 22 comps
| Address | Beds | Baths | Sqft | Rent | $/sqft | DOM | Units | Dist |
|---|---|---|---|---|---|---|---|---|
| 4858 Sheridan Dr Jackson, MS | 3.0 | 2.0 | 1300 | $1,550 | $1.19 | 23d | 1 | 0.04mi |
| 521 Launcelot Rd Jackson, MS | 3.0 | 2.0 | 1346 | $1,423 | $1.06 | 43d | 1 | 0.11mi |
| 4833 N State St Jackson, MS | 3.0 | 2.0 | 994 | $1,195 | $1.20 | 43d | 1 | 0.31mi |
| 4627 Estelle Dr Jackson, MS | 3.0 | 2.0 | 1489 | $1,475 | $0.99 | 23d | 1 | 0.52mi |
| 5255 Manhattan Rd Jackson, MS | 1.0–2.0 | 1.0–2.0 | 813 | $1,100 | $1.35 | 13d | 1 | 0.63mi |
| 214 Melbourne Rd Jackson, MS | 3.0 | 2.0 | 1207 | $1,500 | $1.24 | 43d | 1 | 0.65mi |
| 4901 McWillie Cir Jackson, MS | 1.0–2.0 | 1.0–2.0 | 806 | $1,150 | $1.43 | 13d | 1 | 0.67mi |
| 20 N Hill Pkwy Jackson, MS | 1.0–3.0 | 1.0–2.5 | 1046 | $900 | $0.86 | 13d | 31 | 0.79mi |
| 724 Meadowbrook Rd Jackson, MS | 3.0 | 2.0 | 1593 | $2,150 | $1.35 | 43d | 1 | 0.79mi |
| 200 Stillwood Dr Jackson, MS | 3.0 | 2.0 | 1088 | $1,300 | $1.19 | 43d | 1 | 0.96mi |
| 200 Stillwood Dr Jackson, MS | 3.0 | 2.0 | 1088 | $1,300 | $1.19 | 13d | 1 | 0.96mi |
| 3718 Northbrook Dr Jackson, MS | 2.0 | 1.0 | 942 | $1,050 | $1.11 | 23d | 1 | 0.99mi |
| 4426 Desoto St Jackson, MS | 3.0 | 1.0 | 1079 | $1,250 | $1.16 | 13d | 1 | 1.04mi |
| 4426 Desoto St Jackson, MS | 3.0 | 1.0 | 1079 | $1,250 | $1.16 | 23d | 1 | 1.04mi |
| 4220 Council Cir Jackson, MS | 3.0 | 2.5 | 1780 | $1,850 | $1.04 | 23d | 1 | 1.10mi |
| 4091 Pine Hill Dr Jackson, MS | 3.0 | 2.0 | 1551 | $3,000 | $1.93 | 23d | 1 | 1.12mi |
| 4056 Redwing Ave Jackson, MS | 3.0 | 2.0 | 1678 | $1,850 | $1.10 | 43d | 1 | 1.18mi |
| 815 Berwood Dr Jackson, MS | 3.0 | 2.0 | 1248 | $1,300 | $1.04 | 43d | 1 | 1.26mi |
| 5155 Wayneland Dr Jackson, MS | 1.0–2.0 | 1.0–2.0 | 905 | $1,500 | $1.66 | 23d | 1 | 1.31mi |
| 533 Stillwood Dr Jackson, MS | 2.0 | 1.0 | 906 | $820 | $0.91 | 13d | 1 | 1.38mi |
| 3811 Mosley Ave Jackson, MS | 2.0 | 1.0 | 1000 | $1,095 | $1.09 | 21d | 1 | 1.38mi |
| 212 Pimlico Pl Jackson, MS | 3.0 | 2.0 | 1600 | $900 | $0.56 | 13d | 1 | 1.48mi |
Listing history 14 events
-
2026-06-15statusdays on market $74,900 Pending 16 DOM
-
2026-06-14days on market $74,900 Active 15 DOM
-
2026-06-13days on market $74,900 Active 14 DOM
-
2026-06-10days on market $74,900 Active 12 DOM
-
2026-06-09days on market $74,900 Active 11 DOM
-
2026-06-08days on market $74,900 Active 10 DOM
-
2026-06-07days on market $74,900 Active 9 DOM
-
2026-06-05days on market $74,900 Active 6 DOM
-
2026-06-03days on market $74,900 Active 5 DOM
-
2026-06-02days on market $74,900 Active 4 DOM
-
2026-06-01days on market $74,900 Active 3 DOM
-
2026-05-31days on market $74,900 Active 2 DOM
-
2026-05-30remarks 481-char remark
-
2026-05-30$74,900 Active 1 DOM
ⓘ Source: listings_history table (triggers on properties + properties_extension) + one-shot
backfill from property_details.listing_events for pre-trigger history.
Tax reassessment forecast MS · Resets to sale price
- Current annual tax
- $1,074 · $90/mo
- Projected year-2 tax
- $1,074 · $90/mo
- Expected delta
- $0/yr ($0/mo · 0.0%)
ⓘ Screening estimate from a state-policy table — verify with the county assessor before closing.
Climate risk First Street
- Flood 1/10 Low FEMA zone X (unshaded) · 0% chance over 30 yrs
- Wildfire 1/10 Low
- Heat 7/10 Severe 7 d/yr ≥108°F today · 18 d/yr by 30 yrs out
- Wind 8/10 Severe 80% chance of damaging wind over 30 yrs
- Air quality 2/10 Low 0 unhealthy d/yr today · 1 by 30 yrs out
Nearby sold comps map
Loading sold comps map…
Walkable amenities ~0.75 mi
Loading nearby amenities…
Taxation est. · year 1
- Rental income
- $17,324
- − Mortgage interest
- −$4,196
- − Property taxes
- −$1,074
- − Insurance
- −$374
- − Repairs & maintenance
- −$1,386
- − Management
- −$1,386
- − Depreciation
- −$2,179
- Taxable income
- $6,729
- Est. tax owed @ 24.0%
- −$1,615
- After-tax cash flow
- $5,909/yr
For passive investors: Depreciation is non-cash, so a rental often shows a tax loss while cash-flowing — sheltering income. Rental losses are passive: they offset passive income freely, and up to $25,000/yr can offset ordinary (W-2) income if you actively participate and your MAGI is under $100k (phasing out to $0 by $150k); unused losses carry forward. On sale, claimed depreciation is recaptured at up to 25%, and gains may owe capital-gains tax (a 1031 exchange can defer both). Figures are a year-1 estimate at your 24.0% rate — not tax advice; consult a CPA.
Schools (NCES district)
- District
- Jackson Public School District
- NCES district ID
- 2802190
- Math proficiency
- 9% ▼ -14.00%
- Reading proficiency
- 18% ▼ -7.00%
- Median HH income
- $33,234
- Composite
- 10.89/100
- National rank
- #9755
- State rank
- #112 of 130 in MS
Livability — Jackson
- Score
- 68/100
- State rank
- #66
- US rank
- #9695
Category grades
Schools grade is shown separately in the Schools card above.
Census & demographics
- Census place
- Jackson, MS
- County
- Hinds County · 167,040 people
- City population
- 140,204
- Metro
- Jackson, MS
- Population (ZIP)
- 23,257
- Household income
- $42,686
- Rent vs Own
- Severe rent burden
- 1554.0
Population outlook (Hinds County) Hauer SSP2
- Today (2025)
- 242,528 people
- By 2030
- 241,113 · -0.6%
- By 2040
- 235,557 · -2.9%
- By 2050
- 226,946 · -6.4%
- By 2075
- 199,995 · -17.5%
- By 2100
- 164,165 · -32.3%
Race, ethnicity, and origin ACS 2023
- Neighborhood character
- Predominantly Black (85%)
- Race & ethnicity
- Black 85% White 9% Hispanic / Latino 3% Two or more races 3%
- Common ancestry
- Italian 1%
- Foreign-born
- 2% · Canada
- Languages at home
- 96% English-only · Spanish 3%
Political lean MEDSL · Hinds
- 2024 margin
- Solid D (+46.1) · D 72.4% · R 26.3% · Other 1.4%
- 2008→2024 swing
- +7.1pp toward D · 2008: 39.0pp · 2024: 46.1pp
- All cycles
- 2024: D+46.1 2020: D+48.3 2016: D+43.7 2012: D+45.1 2008: D+39.0
Not yet ingested
- Civics
- —
Market trends
- HPI YoY
- ▼ -22.38%
- Current HPI
- 194.5873
- Rent YoY
- ▲ 2.83%
- Metro
- Jackson, MS
- State GDP YoY
- —
- F500 in state
- 0
Price history
+7.2% since first listed13 events — show timeline
- 2026-05-29 Listed $74,900 MLSU
- 2021-10-03 Listing Removed — MLSU
- 2021-10-02 Listing Removed — MLSU
- 2020-07-23 Sold (Public Records) — Public Records
- 2020-04-17 Listed $55,000 MLSU
- 2012-10-09 Listed $76,500 MLSU
- 2008-08-20 Sold (Public Records) — Public Records
- 2008-08-04 Sold (MLS) — MLSU
- 2008-06-04 Listed $36,900 MLSU
- 2006-12-05 Sold (Public Records) — Public Records
- 2006-12-05 Sold (MLS) — MLSU
- 2006-07-24 Listed $69,900 MLSU
- 1983-05-05 Sold (Public Records) — Public Records
Property tax history
+1.0%/yrLatest (2025): $1,074 · +2.0% YoY. Source: county tax records.
Cash-flow waterfall
monthlySold comps — $/sqft
last 12 mo · ≤1 miLoading sold comps…