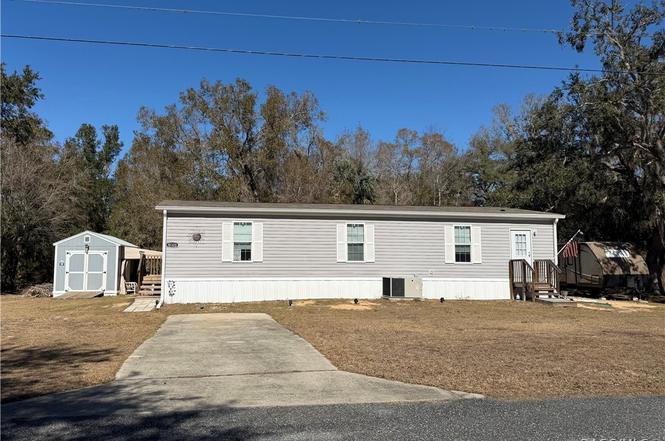
10320 W Pamondeho Cir · Crystal River, FL
Flood risk 9/10 · Severe
- FEMA flood zone
- X (shaded)
- Chance of flooding over 30 yrs
- 0.99%
- Est. flood insurance / yr
- $507 – $1,088
Fire risk 7/10 · Major
- Est. fire insurance / yr
- $947 – $1,759
Heat risk 9/10 · Severe
- Hot days now (above 109°F)
- 7 days/yr
- Hot days in 30 yrs
- 25 days/yr
Wind risk 9/10 · Severe
- Chance of severe wind over 30 yrs
- 99.0%
Air-quality risk 1/10 · Minimal
- Unhealthy air days now
- 0 days/yr
- Unhealthy air days in 30 yrs
- 0 days/yr
Risk factors via First Street. Map © Google.
Why this score? — see what drove the D grade
The composite is a weighted blend of 9 inputs, each scored 0–100. Each bar is that input's sub-score; the figure is the points it added to the 100-point composite (weight × sub-score).
- Cash flow +14.8/30.0
- ARV discount +7.5/15.0
- DSCR +4.5/10.0
- Schools +4.1/10.0
- 1% rule +3.6/10.0
- Livability +3.3/5.0
- Rent growth +2.5/5.0
- Condition / age +2.5/5.0
- Appreciation +0.0/10.0
$224,900
🖨 Deal sheet (PDF) 📄 Offer letter ✓ Due diligence
Listing remarks
Enjoy modern living in this like-new 2022 3-bed, 2-bath home in Crystal River’s Spring Run. Set on a spacious . 68-acre lot, this property offers privacy, peace, and plenty of room for your toys. Key Features: • Modern Interior: Open-concept floor plan with 2022 energy-efficient upgrades. • Bonus Storage: Large 10x16 shed for tools, hobbies, or gear. • Low Costs: Private well and septic; low $175/year POA for road maintenance. • Prime Location: Minutes from Three Sisters Springs and world-class fishing. Move-in ready and perfectly located for the Nature Coast lifestyle!
Key facts
- Private well
- Spacious lot
- Bonus storage
Tags
Property features AI
Finance
- Other: Property size approximately 0.68 acres; No pool
- HOA & community: Homeowners association with an annual fee of $175 (about $14.58/month)
Exterior
- Parking: Concrete driveway; Private parking
- Utilities: Shared well water
- Home design: Manufactured home (double wide); Residential property; Located in Spring Run of Crystal River subdivision; Zoned RURMH
- Construction: Asphalt shingle roof; Double wide manufactured construction
- Exterior features: Asphalt shingle roof; Shed(s); Cleared and wooded lot; Private maintained road / private road
Interior
- Kitchen: Dishwasher; Electric oven; Electric range; Refrigerator
- Bathrooms: 2 full bathrooms
- Heating & cooling: Central heating (electric); Central air conditioning (electric)
- Interior features: Dishwasher; Electric oven; Electric range; Refrigerator
Neighborhood map
What this means for you Summary
Snapshot
- This is a 2-bed/2.0-bath manufactured listed at $225k.
Deal economics
- At list price, monthly cash flow is $-5 ($-56/yr) — negative.
- To cash-flow at today's rent, offer at most $224k (0.4% below list).
- To meet the 1% rule (rent ≥ 1% of price), the offer needs to be $192k (14.5% below list).
- Recommended offer: $192k (14.5% below list) — sets the bar for 1% rule.
- Cap rate 6.6% vs local median 2.5% in Crystal River — top-decile yield for the area; either an underpriced asset or a hidden risk that comps aren't pricing in. Stress-test before assuming the spread holds.
Location & tenants
- Location reads 66/100 on livability (#603 in FL) — a middle-class / working-renter tenant base. Strengths: crime A+, cost of living A+; Watch: health & safety C-, amenities F, commute F.
- Citrus (rural): math 49% / reading 50% proficiency, ranked #44 of 73 in FL (top 60%) — families likely to look elsewhere, expect single-tenant / working-renter base with shorter leases.
- Zoned schools: Crystal River Primary School (math 45% / reading 55%, grade D+, #1,070 of 2,144 statewide, top 51%, 654 students, 70% FRL); Crystal River Middle School (math 49% / reading 47%, grade C-, #286 of 571 statewide, top 50%, 900 students, 64% FRL); Crystal River High School (math 31% / reading 44%, grade F, #336 of 667 statewide, top 51%, 1,249 students, 56% FRL).
- Market conditions: 322 active listings in the ZIP; 2,443 units permitted in Citrus County in 2024 (0 in 5+ unit buildings).
- At $1,924/mo this rent would consume 45% of the median local household income ($51k/yr) (locally 264% of renters already pay >50% of income on rent) — very limited rent-growth headroom before tenants either downsize or default.
Forward outlook
- Local home prices are declining (-3.0%/yr); year-one equity from $2k of loan paydown is wiped out by about $7k of value loss. Plan a longer hold.
- Citrus County population projected to shrink 10% by 2050 — rents likely to lag national; underwrite the cash flow, not the appreciation.
Negotiation context
- It's been on market 133 days — a 12% lower offer ($198k) is reasonable based on typical stale-listing flexibility.
- Current owner paid $15k; list at $225k implies a 1399% gain — meaningful room to come down on a strong offer.
Risks & watch-outs
- Watch-outs: flood insurance adds $66/mo.
- Climate carrying-cost: severe flood risk; severe wind risk, 99% chance of damaging wind over 30y; major wildfire risk; extreme-heat days projected 7→25/yr by 2055 (HVAC capex compounding) — expect insurance premiums to compound above CPI over the hold.
Questions for the listing agent
- What do current leases actually rent for vs. the listed asking? Can we see a recent rent roll and the last 12 months of T-12 income?
- It's been on market 133 days. Have you received any prior offers? Is the seller open to a 14% concession, seller financing, or rate buy-down credit?
- What's the actual annual flood-insurance premium (NFIP or private), and is the property in a SFHA with mandatory coverage?
- What does the HOA fee cover, when was the last increase, and are there any pending special assessments or reserve-fund shortfalls?
- Why hasn't it sold? Are there any deal-killer items the seller is aware of (foundation, flood, title, zoning, code violations)?
- Is there a deadline driving the sale (1031 exchange, divorce, estate, relocation)? That informs how much negotiation room exists.
- Schools are D-rated, which usually means shorter tenancies and higher turnover. Who's the typical renter profile here, and what's been the actual vacancy rate?
- The area grade is low — what's the realistic commute time and amenity access for the typical tenant pool here? Any planned neighborhood developments (good or bad) we should know about?
- What's the average days-on-market for RENTAL listings here right now (not sales)? A rising rental-DOM trend means longer vacancies and softer asking-rent achievability than the comps imply.
- What's the recent tenant-quality profile in this submarket — average credit score on applications, eviction rate, late-payment / NSF rate, and stable-employment percentage? A property-management company in the area should have these aggregated.
- How much new for-sale + rental construction is in the pipeline within 1–3 miles? Heavy new supply typically softens prices + rents 12–24 months out; constrained supply supports both.
Investment metrics
- 1% rule
- 0.86% ✗
- Cap rate
- 6.62%
- Cash-on-cash
- 1.18%
- DSCR
- 1.05
- GRM
- 9.7
CMA / ARV
No comps found within radius.
Projected returns pro-forma
-3.0% appreciation · 3.0% rent growth · sell at horizon
- IRR
- -16.4%
- Equity multiple
- 0.42×
- Total profit
- $-36,729
- Equity at exit
- $33,533
- IRR
- -8.2%
- Equity multiple
- 0.49×
- Total profit
- $-32,321
- Equity at exit
- $19,445
Cash invested: $62,972 (down + closing). Projections, not guarantees.
Landlord ↔ Tenant lean methodology
- Overall (STATE)
- 87 Strongly Landlord-Friendly
- State Florida
- 87 Strongly Landlord-Friendly · R+3
- County
- — inherits STATE
- City
- — inherits STATE
ZIP-level market 34428
- Home prices YoY
- -15.3%
- Active inventory
- 322
- Price-to-rent
- 9.7×
Monthly cashflow live
- Estimated rent
- $1,924 medium interval (Pro) →
- Mortgage (P&I)
- −$1,179
- Tax from tax record
- −$170 /mo · $2,036/yr
- Insurance
- −$94
- Flood insurance flood zone
- −$66 /mo · $798/yr
- HOA
- −$15
- Vacancy / Maint / Mgmt
- −$404
- Net cashflow
- $-5
Break-even live
Sensitivity live
| Price | -10% $123 | -5% $59 | +0% $-5 | +5% $-68 | +10% $-132 |
|---|---|---|---|---|---|
| Rent | -10% $-157 | -5% $-81 | +0% $-5 | +5% $71 | +10% $147 |
| Rate | -1.0pp $109 | -0.5pp $53 | base $-5 | +0.5pp $-63 | +1.0pp $-122 |
UW: 25.0% down · 7.5% · 30yr · 1.5% tax · 5.0% vac · 8.0% maint · 8.0% mgmt
Financing live
Cash to close
- Down payment
- $56,225
- Closing costs
- $6,747
- Reserves months
- —
- Total cash needed
- —
Loan-product check · same deal, 3 products live
Conventional
25% down · 7.5% · 30yr
- Down + closing
- —
- Monthly P&I
- —
- Monthly cashflow
- —
- DSCR
- —
- Eligible?
- —
Personal DTI + credit; lowest rate.
DSCR
20% down · 8.5% · 30yr
- Down + closing
- —
- Monthly P&I
- —
- Monthly cashflow
- —
- DSCR
- —
- Eligible?
- —
No personal income docs; deal must DSCR.
Hard money
10% down · 12.0% · 12mo
- Down + closing
- —
- Monthly P&I
- —
- Monthly cashflow
- —
- DSCR
- —
- Eligible?
- —
Short-term bridge; refi at stabilization.
HOA detail
- Monthly dues
- $15 · $180/yr
Listing history 20 events
-
2026-06-21days on market $224,900 Active 133 DOM
-
2026-06-19days on market $224,900 Active 131 DOM
-
2026-06-18days on market $224,900 Active 130 DOM
-
2026-06-18price $224,900 Active 129 DOM
-
2026-06-17days on market $229,900 Active 129 DOM
-
2026-06-16days on market $229,900 Active 128 DOM
-
2026-06-15days on market $229,900 Active 127 DOM
-
2026-06-14days on market $229,900 Active 125 DOM
-
2026-06-13days on market $229,900 Active 124 DOM
-
2026-06-09days on market $229,900 Active 121 DOM
-
2026-06-08days on market $229,900 Active 120 DOM
-
2026-06-03days on market $229,900 Active 115 DOM
-
2026-06-02days on market $229,900 Active 114 DOM
-
2026-06-01days on market $229,900 Active 113 DOM
-
2026-05-31days on market $229,900 Active 112 DOM
-
2026-05-30days on market $229,900 Active 111 DOM
-
2026-03-12price $229,900
-
2026-02-09$239,900 Active
-
1997-02-01soldstatus $15,000
-
1987-09-01soldstatus $47,000
ⓘ Source: listings_history table (triggers on properties + properties_extension) + one-shot
backfill from property_details.listing_events for pre-trigger history.
Tax reassessment forecast FL · Resets to sale price
- Current annual tax
- $2,036 · $170/mo
- Projected year-2 tax
- $2,036 · $170/mo
- Expected delta
- $0/yr ($0/mo · -0.0%)
ⓘ Screening estimate from a state-policy table — verify with the county assessor before closing.
Climate risk First Street
- Flood 9/10 Extreme FEMA zone X (shaded) · 99% chance over 30 yrs
- Wildfire 7/10 Severe
- Heat 9/10 Extreme 7 d/yr ≥109°F today · 25 d/yr by 30 yrs out
- Wind 9/10 Extreme 99% chance of damaging wind over 30 yrs
- Air quality 1/10 Low 0 unhealthy d/yr today · 0 by 30 yrs out
Nearby sold comps map
Loading sold comps map…
Walkable amenities ~0.75 mi
Loading nearby amenities…
Taxation est. · year 1
- Rental income
- $23,083
- − Mortgage interest
- −$12,598
- − Property taxes
- −$2,036
- − Insurance
- −$1,922
- − Repairs & maintenance
- −$1,847
- − Management
- −$1,847
- − HOA
- −$180
- − Depreciation
- −$6,543
- Taxable loss
- −$3,889
- Est. tax savings @ 24.0%
- +$933
- After-tax cash flow
- $878/yr
For passive investors: Depreciation is non-cash, so a rental often shows a tax loss while cash-flowing — sheltering income. Rental losses are passive: they offset passive income freely, and up to $25,000/yr can offset ordinary (W-2) income if you actively participate and your MAGI is under $100k (phasing out to $0 by $150k); unused losses carry forward. On sale, claimed depreciation is recaptured at up to 25%, and gains may owe capital-gains tax (a 1031 exchange can defer both). Figures are a year-1 estimate at your 24.0% rate — not tax advice; consult a CPA.
Schools (NCES district)
- District
- Citrus
- NCES district ID
- 1200270
- Math proficiency
- 49% ▼ -10.00%
- Reading proficiency
- 50% ▼ -6.00%
- Median HH income
- $38,618
- Composite
- 41.28/100
- National rank
- #3519
- State rank
- #44 of 73 in FL
Livability — Crystal River
- Score
- 66/100
- State rank
- #603
- US rank
- #11564
Category grades
Schools grade is shown separately in the Schools card above.
Census & demographics
- County
- Citrus County · 111,314 people
- City population
- 10,163
- Metro
- Homosassa Springs, FL
- Population (ZIP)
- 10,163
- Household income
- $50,779
- Rent vs Own
- Severe rent burden
- 264.0
Population outlook (Citrus County) Hauer SSP2
- Today (2025)
- 138,622 people
- By 2030
- 136,886 · -1.3%
- By 2040
- 132,009 · -4.8%
- By 2050
- 125,196 · -9.7%
- By 2075
- 108,570 · -21.7%
- By 2100
- 84,454 · -39.1%
Race, ethnicity, and origin ACS 2023
- Neighborhood character
- Predominantly White (88%)
- Race & ethnicity
- White 88% Two or more races 6% Hispanic / Latino 5% Asian 2%
- Common ancestry
- Lithuanian 3% Romanian 3% Slovak 2%
- Foreign-born
- 5% · Canada, Jamaica, South Korea
- Languages at home
- 96% English-only · Spanish 3%
Political lean MEDSL · Citrus
- 2024 margin
- Solid R (+45.9) · D 26.8% · R 72.6%
- 2008→2024 swing
- -29.8pp toward R · 2008: -16.1pp · 2024: -45.9pp
- All cycles
- 2024: R+45.9 2020: R+41.0 2016: R+39.7 2012: R+21.9 2008: R+16.1
Not yet ingested
- Civics
- —
Market trends
- HPI YoY
- ▼ -57.32%
- Current HPI
- 317.7637
- Rent YoY
- —
- Metro
- Homosassa Springs, FL
- State GDP YoY
- ▲ 3.28%
- F500 in state
- 36
Industry mix (Fortune 500 HQ in FL)
| Industry | F500 HQs | Revenue |
|---|---|---|
| Industrial Technology | 2 | $29B |
|
||
| Insurance | 2 | $17B |
|
||
| Retail | 1 | $60B |
|
||
| Technology Distribution | 1 | $58B |
|
||
| Homebuilding | 1 | $35B |
|
||
| Technology Manufacturing | 1 | $35B |
|
||
Price history
+389.1% since first listed4 events — show timeline
- 2026-03-12 Price Changed $229,900 RACC
- 2026-02-09 Listed $239,900 RACC
- 1997-02-01 Sold (Public Records) $15,000 Public Records
- 1987-09-01 Sold (Public Records) $47,000 Public Records
Property tax history
+12.9%/yrLatest (2025): $2,036 · +5.6% YoY. Source: county tax records.
Cash-flow waterfall
monthlySold comps — $/sqft
last 12 mo · ≤1 miLoading sold comps…