 Triplex
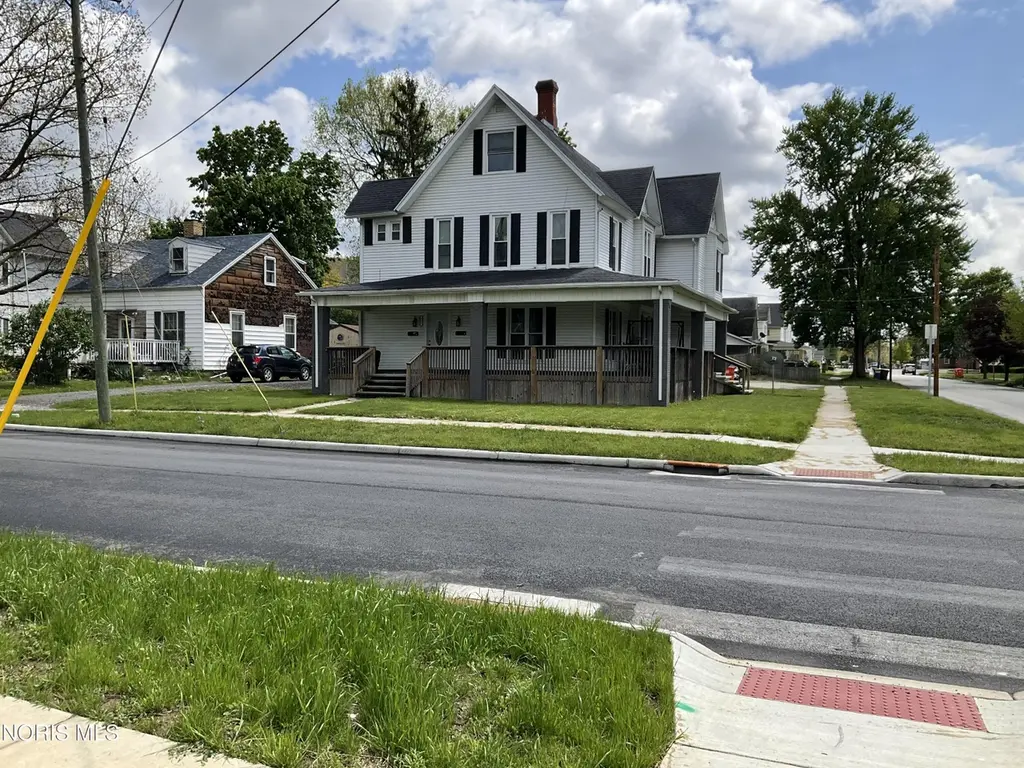
201 E Broadway St · North Baltimore, OH
Flood risk 1/10 · Minimal
- FEMA flood zone
- X (unshaded)
- Chance of flooding over 30 yrs
- 0.0%
- Est. flood insurance / yr
- $473 – $860
Fire risk 1/10 · Minimal
- Est. fire insurance / yr
- $713 – $1,323
Heat risk 3/10 · Minor
- Hot days now (above 99°F)
- 7 days/yr
- Hot days in 30 yrs
- 17 days/yr
Wind risk 2/10 · Minimal
- Chance of severe wind over 30 yrs
- —
Air-quality risk 2/10 · Minimal
- Unhealthy air days now
- 1 days/yr
- Unhealthy air days in 30 yrs
- 2 days/yr
Risk factors via First Street. Map © Google.
Why this score? — see what drove the B grade
The composite is a weighted blend of 9 inputs, each scored 0–100. Each bar is that input's sub-score; the figure is the points it added to the 100-point composite (weight × sub-score).
- Cash flow +30.0/30.0
- DSCR +10.0/10.0
- 1% rule +9.9/10.0
- ARV discount +7.5/15.0
- Schools +4.4/10.0
- Livability +3.9/5.0
- Rent growth +2.5/5.0
- Condition / age +2.5/5.0
- Appreciation +0.0/10.0
$249,900
🖨 Deal sheet 📄 Offer letter ✓ Due diligence
Multi-family units
County records classify this as Multi-Family (2-4 Unit). Listing-text estimate: 3 units. confirmed
Listing remarks
Investment opportunity on a fully rented triplex in North Baltimore, OH! Roof, windows, furnace/AC all new with total monthly income of $3,145 a month. Owner pays trash. Tenant pays water, gas, and electric. This property is an option as well in a multi-family income producing portfolio of properties. Contact listing agent directly if interested. Owner is a licensed real estate agent in the state of Ohio.
Key facts
- New furnace
- Fully rented triplex
- New ac
Tags
Property features AI
Finance
- Financial info: Three-unit building, all units currently leased; Tenants pay electricity, gas, internet and water; Owner pays exterior maintenance, trash collection and snow removal
Exterior
- Parking: Parking for 8 vehicles; Additional parking; Driveway; Gravel parking; Off-street parking; Parking lot
- Utilities: Electricity connected; Natural gas connected; Public sewer; Public water
- Home design: Residential income property (Triplex); Tri-level layout; 3 stories
- Construction: Aluminum siding; Block foundation
- Exterior features: Corner lot; City street frontage; Paved road; Asphalt shingle roof
Interior
- Kitchen: Dishwasher; Electric oven; Microwave; Refrigerator
- Flooring: Carpet; Luxury vinyl
- Heating & cooling: Baseboard heating; Central heating; Forced air heating; Wall furnace; Central air conditioning; Window units
- Interior features: Other
- Laundry & utility: Stacked washer/dryer in unit
Neighborhood map
What this means for you Summary
Snapshot
- This is a 3 × 2-bed/1.0-bath units multifamily listed at $250k.
Deal economics
- At list price, monthly cash flow is $1k ($16k/yr) — positive. Per door: $447/mo.
- The deal already cash-flows at list — no discount required.
- Meets the 1% rule at list price ($4k rent vs $250k).
- Cap rate 12.7% vs local median 5.9% in North Baltimore — top-decile yield for the area; either an underpriced asset or a hidden risk that comps aren't pricing in. Stress-test before assuming the spread holds.
Location & tenants
- Location reads 78/100 on livability (#159 in OH, #2,395 nationally) — a middle-class / working-renter tenant base. Strengths: cost of living A+, housing A+, health & safety A+; Watch: amenities F, commute F.
- North Baltimore Local (town): math 45% / reading 58% proficiency, ranked #424 of 656 in OH (top 65%) — acceptable for families but not a draw, mixed tenant base, ~2y average lease.
- Zoned schools: E A Powell Elementary School (math 47% / reading 57%, grade C-, #851 of 1,584 statewide, top 56%, 367 students, 46% FRL); North Baltimore Middle School (math 52% / reading 57%, grade B-, #342 of 654 statewide, top 54%, 95 students, 0% FRL); North Baltimore High School (math 34% / reading 74%, grade C-, #303 of 781 statewide, top 42%, 136 students, 84% FRL) — zoned schools at 43% FRL track the district average.
- Market conditions: 32 active listings in the ZIP; 493 units permitted in Wood County in 2024 (48 in 5+ unit buildings).
- At $3,726/mo this rent would consume 72% of the median local household income ($62k/yr) — very limited rent-growth headroom before tenants either downsize or default.
Forward outlook
- Local home prices are declining (-3.0%/yr); year-one equity from $2k of loan paydown is wiped out by about $7k of value loss. Plan a longer hold.
- Wood County population projected at +14% by 2050 — modest demand growth; plan on rents tracking national, not racing it.
- At projected returns (-3.0% appreciation + 3.0% rent growth), your $70k cash investment doubles in ~6 years — after that, you're playing with house money.
Negotiation context
- Only 7 days on market — expect competitive offers; lowballing is unlikely to land.
- 5 sale attempts since 23y ago with the ask held roughly flat each time — persistent listings suggest the price (not the market) is what's stuck; bring a comps-based counter.
- Current owner paid $75k; list at $250k implies a 233% gain — meaningful room to come down on a strong offer.
Risks & watch-outs
- Watch-outs: built in 1900 — expect roof / HVAC / electrical / plumbing capex.
Questions for the listing agent
- Can we see the unit-by-unit rent roll, current vacancy, and any below-market leases? What's the average tenancy length?
- What capital expenditures (roof, boiler, parking lot, exteriors) have been made in the last 5 years, and what's planned in the next 2?
- Built in 1900 — when were the roof, HVAC, electrical panel, plumbing, and water heater last replaced?
- Is there a deadline driving the sale (1031 exchange, divorce, estate, relocation)? That informs how much negotiation room exists.
- Schools are B-rated — typically a magnet for longer-tenancy family renters. What's the average tenant stay here, and is there a school-zone premium baked into asking?
- What's the average days-on-market for RENTAL listings here right now (not sales)? A rising rental-DOM trend means longer vacancies and softer asking-rent achievability than the comps imply.
- What's the recent tenant-quality profile in this submarket — average credit score on applications, eviction rate, late-payment / NSF rate, and stable-employment percentage? A property-management company in the area should have these aggregated.
- How much new apartment / multifamily construction is in the pipeline within 1–3 miles? Heavy new supply (>2% of stock underway) typically softens rents 12–24 months out; light construction supports rent growth.
Investment metrics
- 1% rule
- 1.49% ✓
- Cap rate
- 12.73%
- Cash-on-cash
- 22.98%
- DSCR
- 2.02
- GRM
- 5.6
CMA / ARV
No comps found within radius.
Projected returns pro-forma
-3.0% appreciation · 3.0% rent growth · sell at horizon
- IRR
- 15.9%
- Equity multiple
- 1.64×
- Total profit
- $44,845
- Equity at exit
- $37,261
- IRR
- 24.5%
- Equity multiple
- 3.13×
- Total profit
- $148,884
- Equity at exit
- $21,607
Cash invested: $69,972 (down + closing). Projections, not guarantees.
Landlord ↔ Tenant lean methodology
- Overall (STATE)
- 73 Landlord-Friendly
- State Ohio
- 73 Landlord-Friendly · R+6
- County
- — inherits STATE
- City
- — inherits STATE
ZIP-level market 45872
- Home prices YoY
- -11.5%
- Active inventory
- 32
- Price-to-rent
- 16.8×
Monthly cashflow live
- Estimated rent
- $3,726 medium interval (Pro) →
- Mortgage (P&I)
- −$1,311
- Tax from tax record
- −$189 /mo · $2,264/yr
- Insurance
- −$104
- HOA
- −$0
- Vacancy / Maint / Mgmt
- −$782
- Net cashflow
- $1,340
Break-even live
3-unit breakdown (identical units grouped — click to expand)
| Units | Beds | Baths | Est. rent |
|---|---|---|---|
| 3× units | 2 | 1 | $3,726 |
| #1 | 2 | 1 | $1,242 |
| #2 | 2 | 1 | $1,242 |
| #3 | 2 | 1 | $1,242 |
| Total (3 units) | $3,726 | ||
UW: 25.0% down · 7.5% · 30yr · 1.5% tax · 5.0% vac · 8.0% maint · 8.0% mgmt
Financing live
Cash to close
- Down payment
- $62,475
- Closing costs
- $7,497
- Reserves months
- —
- Total cash needed
- —
Loan-product check · same deal, 3 products live
Conventional
25% down · 7.5% · 30yr
- Down + closing
- —
- Monthly P&I
- —
- Monthly cashflow
- —
- DSCR
- —
- Eligible?
- —
Personal DTI + credit; lowest rate.
DSCR
20% down · 8.5% · 30yr
- Down + closing
- —
- Monthly P&I
- —
- Monthly cashflow
- —
- DSCR
- —
- Eligible?
- —
No personal income docs; deal must DSCR.
Hard money
10% down · 12.0% · 12mo
- Down + closing
- —
- Monthly P&I
- —
- Monthly cashflow
- —
- DSCR
- —
- Eligible?
- —
Short-term bridge; refi at stabilization.
Listing history 5 events
-
2026-06-15statusdays on market $249,900 Pending 7 DOM
-
2026-06-13days on market $249,900 Active 5 DOM
-
2026-06-12days on market $249,900 Active 4 DOM
-
2026-06-09remarks 409-char remark
-
2026-06-09$249,900 Active 1 DOM
ⓘ Source: listings_history table (triggers on properties + properties_extension) + one-shot
backfill from property_details.listing_events for pre-trigger history.
Tax reassessment forecast OH · Partial reset (capped growth)
- Current annual tax
- $2,264 · $189/mo
- Projected year-2 tax
- $3,081 · $257/mo
- Expected delta
- +$817/yr (+$68/mo · 36.1%)
ⓘ Screening estimate from a state-policy table — verify with the county assessor before closing.
Climate risk First Street
- Flood 1/10 Low FEMA zone X (unshaded) · 0% chance over 30 yrs
- Wildfire 1/10 Low
- Heat 3/10 Moderate 7 d/yr ≥99°F today · 17 d/yr by 30 yrs out
- Wind 2/10 Low
- Air quality 2/10 Low 1 unhealthy d/yr today · 2 by 30 yrs out
Nearby sold comps map
Loading sold comps map…
Walkable amenities ~0.75 mi
Loading nearby amenities…
Taxation est. · year 1
- Rental income
- $44,712
- − Mortgage interest
- −$13,998
- − Property taxes
- −$2,264
- − Insurance
- −$1,250
- − Repairs & maintenance
- −$3,577
- − Management
- −$3,577
- − Depreciation
- −$7,270
- Taxable income
- $12,776
- Est. tax owed @ 24.0%
- −$3,066
- After-tax cash flow
- $13,016/yr
For passive investors: Depreciation is non-cash, so a rental often shows a tax loss while cash-flowing — sheltering income. Rental losses are passive: they offset passive income freely, and up to $25,000/yr can offset ordinary (W-2) income if you actively participate and your MAGI is under $100k (phasing out to $0 by $150k); unused losses carry forward. On sale, claimed depreciation is recaptured at up to 25%, and gains may owe capital-gains tax (a 1031 exchange can defer both). Figures are a year-1 estimate at your 24.0% rate — not tax advice; consult a CPA.
Schools (NCES district)
- District
- North Baltimore Local
- NCES district ID
- 3905070
- Math proficiency
- 45% ▼ -21.00%
- Reading proficiency
- 58% ▼ -12.00%
- Median HH income
- $47,242
- Composite
- 43.72/100
- National rank
- #2951
- State rank
- #424 of 656 in OH
Livability — North Baltimore
- Score
- 78/100
- State rank
- #159
- US rank
- #2395
Category grades
Schools grade is shown separately in the Schools card above.
Census & demographics
- Census place
- North Baltimore, OH
- County
- Wood · 127,168 people
- City population
- 4,572
- Metro
- Toledo, OH
- Population (ZIP)
- 4,572
- Household income
- $62,380
- Rent vs Own
- Severe rent burden
- 3.8
Population outlook (Wood County) Hauer SSP2
- Today (2025)
- 138,744 people
- By 2030
- 143,189 · +3.2%
- By 2040
- 150,896 · +8.8%
- By 2050
- 158,589 · +14.3%
- By 2075
- 182,166 · +31.3%
- By 2100
- 196,533 · +41.7%
Race, ethnicity, and origin ACS 2023
- Neighborhood character
- Predominantly White (94%)
- Race & ethnicity
- White 94% Hispanic / Latino 4% Two or more races 2% Black 2%
- Common ancestry
- Iranian 4% Romanian 2% Slovak 1%
- Foreign-born
- 0%
- Languages at home
- 98% English-only · Spanish 2%
Political lean MEDSL · Wood
- 2024 margin
- R (+10.2) · D 44.4% · R 54.6%
- 2008→2024 swing
- -17.3pp toward R · 2008: 7.1pp · 2024: -10.2pp
- All cycles
- 2024: R+10.2 2020: R+7.6 2016: R+8.5 2012: D+4.2 2008: D+7.1
Not yet ingested
- Civics
- —
Market trends
- HPI YoY
- ▼ -29.19%
- Current HPI
- 225.1072
- Rent YoY
- —
- Metro
- —
- State GDP YoY
- ▲ 1.98%
- F500 in state
- 48
Industry mix (Fortune 500 HQ in OH)
| Industry | F500 HQs | Revenue |
|---|---|---|
| Insurance | 3 | $145B |
|
||
| Industrial Machinery | 3 | $49B |
|
||
| Financial Services | 3 | $24B |
|
||
| Consumer Goods | 2 | $93B |
|
||
| Aerospace / Defense | 2 | $47B |
|
||
| Utilities | 2 | $33B |
|
||
Price history
+262.2% since first listed12 events — show timeline
- 2026-06-08 Listed $249,900 NORIS
- 2011-12-11 Listing Removed — NORIS
- 2011-07-18 Listed $55,000 NORIS
- 2009-08-31 Listing Removed — NORIS
- 2008-03-10 Listing Removed — NORIS
- 2008-01-22 Listed $77,000 NORIS
- 2004-10-01 Listed $95,900 NORIS
- 2004-09-30 Listing Removed — NORIS
- 2003-01-30 Listed $135,000 NORIS
- 1995-09-01 Sold (Public Records) $75,000 Public Records
- 1992-06-09 Sold (Public Records) $67,000 Public Records
- 1989-11-29 Sold (Public Records) $69,000 Public Records
Property tax history
+1.3%/yrLatest (2025): $2,264 · +0.9% YoY. Source: county tax records.
Cash-flow waterfall
monthlySold comps — $/sqft
last 12 mo · ≤1 miLoading sold comps…