113 Elizabeth Dr · Double Horn, TX
Flood risk 1/10 · Minimal
- FEMA flood zone
- X (unshaded)
- Chance of flooding over 30 yrs
- 0.0%
- Est. flood insurance / yr
- $507 – $1,088
Fire risk 4/10 · Minor
- Est. fire insurance / yr
- $1,222 – $2,270
Heat risk 8/10 · Major
- Hot days now (above 107°F)
- 7 days/yr
- Hot days in 30 yrs
- 23 days/yr
Wind risk 6/10 · Moderate
- Chance of severe wind over 30 yrs
- 59.0%
Air-quality risk 1/10 · Minimal
- Unhealthy air days now
- 0 days/yr
- Unhealthy air days in 30 yrs
- 0 days/yr
Risk factors via First Street. Map © Google.
Why this score? — see what drove the C- grade
The composite is a weighted blend of 9 inputs, each scored 0–100. Each bar is that input's sub-score; the figure is the points it added to the 100-point composite (weight × sub-score).
- Cash flow +22.9/30.0
- DSCR +7.3/10.0
- ARV discount +6.4/15.0
- 1% rule +5.8/10.0
- Rent growth +3.3/5.0
- Schools +3.0/10.0
- Livability +2.5/5.0
- Condition / age +2.5/5.0
- Appreciation +0.0/10.0
$184,500
🖨 Deal sheet (PDF) 📄 Offer letter ✓ Due diligence
Listing remarks MLS
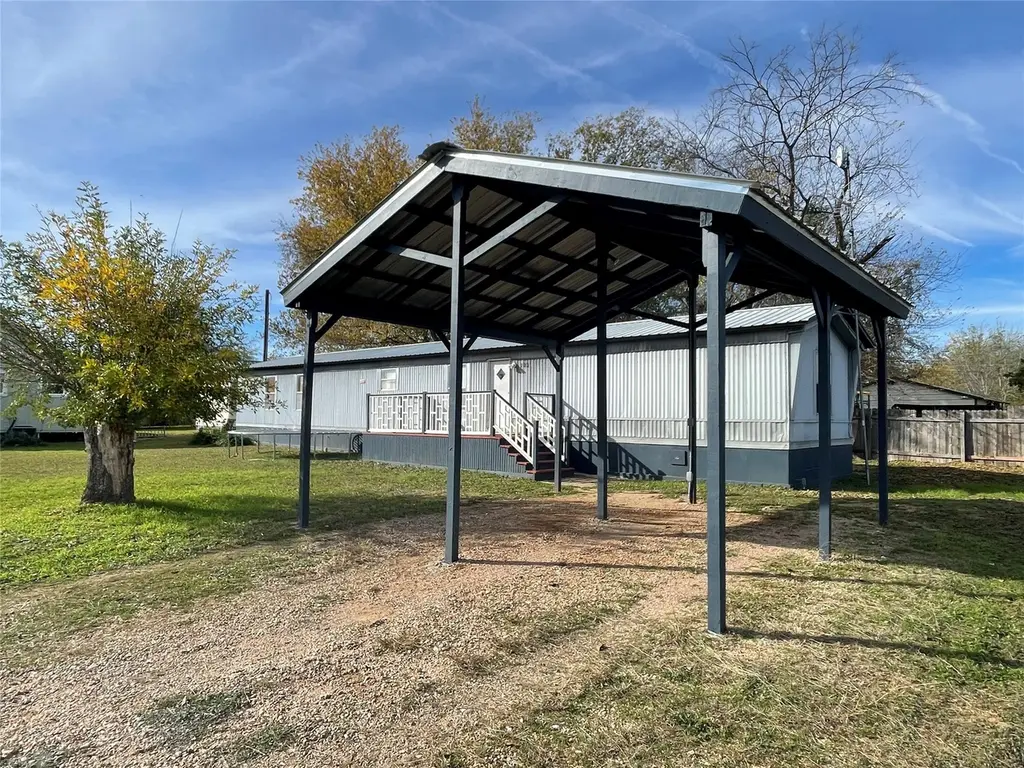
Lakeside Community on Lake Travis! Remodeled mobile home on 2 lots in the Spicewood Beach Subdivision. New appliances and fixtures. New 2 car carport. Subdivision ammenities include a private 9 hole golf course, boat ramp, beach and picnic area, and a fishing dock.
Key facts
- Fishing dock
- Boat ramp
- 0.23 acre lot
Tags
Neighborhood map
What this means for you Summary
Snapshot
- This is a 3-bed/2.0-bath manufactured listed at $184k.
Deal economics
- At list price, monthly cash flow is $323 ($4k/yr) — positive.
- The deal already cash-flows at list — no discount required.
- Meets the 1% rule at list price ($2k rent vs $184k).
- Recommended offer: $162k (12.0% below list) — sets the bar for market timing.
- Cap rate 8.4% vs local median 1.3% in Double Horn — top-decile yield for the area; either an underpriced asset or a hidden risk that comps aren't pricing in. Stress-test before assuming the spread holds.
Location & tenants
- Location reads: area grade C — affects rentability + tenant quality, not the cash-flow math above.
- Marble Falls ISD (town): math 32% / reading 38% proficiency, ranked #511 of 826 in TX (top 62%) — families likely to look elsewhere, expect single-tenant / working-renter base with shorter leases.
- Zoned schools: Spicewood El (math 52% / reading 62%, grade C+, #505 of 4,322 statewide, top 13%, 202 students, 49% FRL); Marble Falls Middle (math 32% / reading 37%, grade F, #858 of 1,662 statewide, top 54%, 911 students, 67% FRL); Marble Falls H S (math 29% / reading 47%, grade F, #880 of 1,632 statewide, top 54%, 1,145 students, 61% FRL).
- Market conditions: Rents rising (+3.4%/yr); 654 active listings in the ZIP; 1 comparable units currently listed for rent nearby; high-income renter base; 891 units permitted in Burnet County in 2024 (76 in 5+ unit buildings).
Forward outlook
- Local home prices are declining (-3.0%/yr); year-one equity from $1k of loan paydown is wiped out by about $6k of value loss. Plan a longer hold.
- Burnet County population projected at +22% by 2050 — long-run rental-demand tailwind backs the buy-and-hold thesis.
Negotiation context
- It's been on market 598 days — a 12% lower offer ($162k) is reasonable based on typical stale-listing flexibility.
- 13 sale attempts since 27y ago; this cycle's ask has dropped $34k (16%) from the opening price — seller is motivated, your offer sets the floor, not the list.
- Current owner paid $47k; list at $184k implies a 293% gain — meaningful room to come down on a strong offer.
Risks & watch-outs
- Climate carrying-cost: major wind risk, 59% chance of damaging wind over 30y; extreme-heat days projected 7→23/yr by 2055 (HVAC capex compounding) — expect insurance premiums to compound above CPI over the hold.
Questions for the listing agent
- It's been on market 598 days. Have you received any prior offers? Is the seller open to a 12% concession, seller financing, or rate buy-down credit?
- What does the HOA fee cover, when was the last increase, and are there any pending special assessments or reserve-fund shortfalls?
- Why hasn't it sold? Are there any deal-killer items the seller is aware of (foundation, flood, title, zoning, code violations)?
- Is there a deadline driving the sale (1031 exchange, divorce, estate, relocation)? That informs how much negotiation room exists.
- What's the average days-on-market for RENTAL listings here right now (not sales)? A rising rental-DOM trend means longer vacancies and softer asking-rent achievability than the comps imply.
- What's the recent tenant-quality profile in this submarket — average credit score on applications, eviction rate, late-payment / NSF rate, and stable-employment percentage? A property-management company in the area should have these aggregated.
- How much new for-sale + rental construction is in the pipeline within 1–3 miles? Heavy new supply typically softens prices + rents 12–24 months out; constrained supply supports both.
Investment metrics
- 1% rule
- 1.08% ✓
- Cap rate
- 8.39%
- Cash-on-cash
- 7.49%
- DSCR
- 1.33
- GRM
- 7.7
CMA / ARV
- ARV (on-the-fly)
- $179,968
- Comps found
- 1
Show comp detail 1 sale within ~0.75 mi
| Address | Dist | Beds/Ba | Sqft | Sold | Price | $/sf | Match |
|---|---|---|---|---|---|---|---|
| 4218 County Road 410 | 0.40mi | 3/2.0 | 1,344 (+10%) | 14mo | $199,000 | $148 | 53 |
Match score weights: distance 35% · size 25% · config 20% · recency 20%. Top-matched comps best support the ARV.
Projected returns pro-forma
-3.0% appreciation · 3.36% rent growth · sell at horizon
- IRR
- -4.4%
- Equity multiple
- 0.83×
- Total profit
- $-8,614
- Equity at exit
- $27,510
- IRR
- 5.7%
- Equity multiple
- 1.43×
- Total profit
- $22,005
- Equity at exit
- $15,952
Cash invested: $51,660 (down + closing). Projections, not guarantees.
Landlord ↔ Tenant lean methodology
- Overall (STATE)
- 87 Strongly Landlord-Friendly
- State Texas
- 87 Strongly Landlord-Friendly · R+5
- County
- — inherits STATE
- City
- — inherits STATE
ZIP-level market 78669
- Home prices YoY
- -16.6%
- Rents YoY
- 3.4%
- Active inventory
- 654
- Price-to-rent
- 7.7×
Monthly cashflow live
- Estimated rent
- $1,990 medium interval (Pro) →
- Mortgage (P&I)
- −$968
- Tax from tax record
- −$184 /mo · $2,214/yr
- Insurance
- −$77
- HOA
- −$21
- Lot rent leased land?
- −$0
- Vacancy / Maint / Mgmt
- −$418
- Net cashflow
- $323
Break-even live
Sensitivity live
| Price | -10% $427 | -5% $375 | +0% $323 | +5% $270 | +10% $218 |
|---|---|---|---|---|---|
| Rent | -10% $165 | -5% $244 | +0% $323 | +5% $401 | +10% $480 |
| Rate | -1.0pp $415 | -0.5pp $370 | base $323 | +0.5pp $275 | +1.0pp $226 |
UW: 25.0% down · 7.5% · 30yr · 1.5% tax · 5.0% vac · 8.0% maint · 8.0% mgmt
Financing live
Cash to close
- Down payment
- $46,125
- Closing costs
- $5,535
- Reserves months
- —
- Total cash needed
- —
Loan-product check · same deal, 3 products live
Conventional
25% down · 7.5% · 30yr
- Down + closing
- —
- Monthly P&I
- —
- Monthly cashflow
- —
- DSCR
- —
- Eligible?
- —
Personal DTI + credit; lowest rate.
DSCR
20% down · 8.5% · 30yr
- Down + closing
- —
- Monthly P&I
- —
- Monthly cashflow
- —
- DSCR
- —
- Eligible?
- —
No personal income docs; deal must DSCR.
Hard money
10% down · 12.0% · 12mo
- Down + closing
- —
- Monthly P&I
- —
- Monthly cashflow
- —
- DSCR
- —
- Eligible?
- —
Short-term bridge; refi at stabilization.
Rent comps 1 comps
| Address | Beds | Baths | Sqft | Rent | $/sqft | DOM | Units | Dist |
|---|---|---|---|---|---|---|---|---|
| 408 Breezing Ln Spicewood, TX | 3.0 | 2.0 | 1232 | $2,200 | $1.79 | 18d | 1 | 0.45mi |
HOA detail
- Monthly dues
- $21 · $252/yr
Listing history 50 events
-
2026-06-22days on market $184,500 Active 598 DOM
-
2026-06-21days on market $184,500 Active 597 DOM
-
2026-06-18days on market $184,500 Active 594 DOM
-
2026-06-17remarks 291-char remark
-
2026-06-17days on market $184,500 Active 593 DOM
-
2026-06-16days on market $184,500 Active 592 DOM
-
2026-06-15days on market $184,500 Active 591 DOM
-
2026-06-13days on market $184,500 Active 589 DOM
-
2026-06-13days on market $184,500 Active 588 DOM
-
2026-06-10price $184,500 Active 585 DOM
-
2026-06-09days on market $189,500 Active 585 DOM
-
2026-06-08days on market $189,500 Active 584 DOM
-
2026-06-07days on market $189,500 Active 583 DOM
-
2026-06-05days on market $189,500 Active 580 DOM
-
2026-06-03days on market $189,500 Active 579 DOM
-
2026-06-01days on market $189,500 Active 577 DOM
-
2026-05-31days on market $189,500 Active 576 DOM
-
2025-12-08price $189,500 265-char remark
Show marketing remark (265 chars)
Lakeside Community on Lake Travis! Remodeled mobile home on 2 lots in the Spicewood Beach Subdivision. New appliances and fixtures. New 2 car carport. Subdivision ammenities include a private 9 hole golf course, boat ramp, beach and picnic area, and a fishing dock.
-
2025-08-20price $194,500 265-char remark
Show marketing remark (265 chars)
Lakeside Community on Lake Travis! Remodeled mobile home on 2 lots in the Spicewood Beach Subdivision. New appliances and fixtures. New 2 car carport. Subdivision ammenities include a private 9 hole golf course, boat ramp, beach and picnic area, and a fishing dock.
-
2025-06-16price $199,900 265-char remark
Show marketing remark (265 chars)
Lakeside Community on Lake Travis! Remodeled mobile home on 2 lots in the Spicewood Beach Subdivision. New appliances and fixtures. New 2 car carport. Subdivision ammenities include a private 9 hole golf course, boat ramp, beach and picnic area, and a fishing dock.
-
2025-03-24price $209,000 265-char remark
Show marketing remark (265 chars)
Lakeside Community on Lake Travis! Remodeled mobile home on 2 lots in the Spicewood Beach Subdivision. New appliances and fixtures. New 2 car carport. Subdivision ammenities include a private 9 hole golf course, boat ramp, beach and picnic area, and a fishing dock.
-
2024-11-13historical $1,950
-
2024-11-02$219,000 Active 265-char remark
Show marketing remark (265 chars)
Lakeside Community on Lake Travis! Remodeled mobile home on 2 lots in the Spicewood Beach Subdivision. New appliances and fixtures. New 2 car carport. Subdivision ammenities include a private 9 hole golf course, boat ramp, beach and picnic area, and a fishing dock.
-
2024-11-01$219,000 Active 265-char remark
Show marketing remark (265 chars)
Lakeside Community on Lake Travis! Remodeled mobile home on 2 lots in the Spicewood Beach Subdivision. New appliances and fixtures. New 2 car carport. Subdivision ammenities include a private 9 hole golf course, boat ramp, beach and picnic area, and a fishing dock.
-
2024-10-24price $1,950
-
2024-10-03$1,995
-
2024-09-12historical
-
2024-06-06$250,000
-
2024-06-06Active
-
2024-04-24status Active
-
2024-04-24historical
-
2023-12-14$275,000
-
2023-12-14Active
-
2023-07-26historical
-
2023-07-13
-
2022-08-24soldstatus
-
2020-03-02status Pending
-
2020-03-02historical Withdrawn
-
2020-02-20price
-
2020-01-20Active
-
2007-11-13soldstatus
-
2006-10-05soldstatus $47,000
-
2005-06-30soldstatus
-
2004-04-26$45,000
-
2001-07-17historical
-
2000-08-07
ⓘ Source: listings_history table (triggers on properties + properties_extension) + one-shot
backfill from property_details.listing_events for pre-trigger history.
Tax reassessment forecast TX · Resets to sale price
- Current annual tax
- $2,214 · $184/mo
- Projected year-2 tax
- $3,376 · $281/mo
- Expected delta
- +$1,163/yr (+$97/mo · 52.5%)
ⓘ Screening estimate from a state-policy table — verify with the county assessor before closing.
Climate risk First Street
- Flood 1/10 Low FEMA zone X (unshaded) · 0% chance over 30 yrs
- Wildfire 4/10 Moderate
- Heat 8/10 Severe 7 d/yr ≥107°F today · 23 d/yr by 30 yrs out
- Wind 6/10 Major 59% chance of damaging wind over 30 yrs
- Air quality 1/10 Low 0 unhealthy d/yr today · 0 by 30 yrs out
Nearby sold comps map
Loading sold comps map…
Walkable amenities ~0.75 mi
Loading nearby amenities…
Taxation est. · year 1
- Rental income
- $23,886
- − Mortgage interest
- −$10,335
- − Property taxes
- −$2,214
- − Insurance
- −$922
- − Repairs & maintenance
- −$1,911
- − Management
- −$1,911
- − HOA
- −$252
- − Depreciation
- −$5,367
- Taxable income
- $974
- Est. tax owed @ 24.0%
- −$234
- After-tax cash flow
- $3,637/yr
For passive investors: Depreciation is non-cash, so a rental often shows a tax loss while cash-flowing — sheltering income. Rental losses are passive: they offset passive income freely, and up to $25,000/yr can offset ordinary (W-2) income if you actively participate and your MAGI is under $100k (phasing out to $0 by $150k); unused losses carry forward. On sale, claimed depreciation is recaptured at up to 25%, and gains may owe capital-gains tax (a 1031 exchange can defer both). Figures are a year-1 estimate at your 24.0% rate — not tax advice; consult a CPA.
Schools (NCES district)
- District
- Marble Falls ISD
- NCES district ID
- 4829010
- Math proficiency
- 32% ▼ -8.00%
- Reading proficiency
- 38% ▼ -4.00%
- Median HH income
- $49,663
- Composite
- 30.3/100
- National rank
- #6278
- State rank
- #511 of 826 in TX
Livability — Double Horn
No livability data for this city. (Only ~50 U.S. cities are tracked.)
Census & demographics
- County
- Travis County · 1,299,254 people
- Metro
- Austin-Round Rock-Georgetown, TX
- Population (ZIP)
- 12,592
- Household income
- $128,000
- Rent vs Own
- Severe rent burden
- 45.0
Population outlook (Burnet County) Hauer SSP2
- Today (2025)
- 50,492 people
- By 2030
- 52,995 · +5.0%
- By 2040
- 57,528 · +13.9%
- By 2050
- 61,444 · +21.7%
- By 2075
- 71,098 · +40.8%
- By 2100
- 74,634 · +47.8%
Race, ethnicity, and origin ACS 2023
- Neighborhood character
- Predominantly White (81%)
- Race & ethnicity
- White 81% Hispanic / Latino 13% Two or more races 8% Black 1% Asian 1%
- Hispanic origin (detail)
- Mexican 9%
- Common ancestry
- Italian 5% Slovak 3% Lithuanian 3%
- Foreign-born
- 5% · Canada
- Languages at home
- 93% English-only · Spanish 5% Other Asian/Pacific 1%
Political lean MEDSL · Burnet
- 2024 margin
- Solid R (+55.7) · D 21.7% · R 77.4%
- 2008→2024 swing
- -11.6pp toward R · 2008: -44.1pp · 2024: -55.7pp
- All cycles
- 2024: R+55.7 2020: R+53.1 2016: R+56.8 2012: R+54.6 2008: R+44.1
Not yet ingested
- Civics
- —
Market trends
- HPI YoY
- ▼ -50.06%
- Current HPI
- 251.3551
- Rent YoY
- ▲ 3.36%
- Metro
- Austin-Round Rock-Georgetown, TX
- State GDP YoY
- ▲ 3.95%
- F500 in state
- 110
Industry mix (Fortune 500 HQ in TX)
| Industry | F500 HQs | Revenue |
|---|---|---|
| Energy | 16 | $1,198B |
|
||
| Technology | 5 | $198B |
|
||
| Engineering / Construction | 4 | $72B |
|
||
| Energy Services | 3 | $60B |
|
||
| Utilities | 3 | $41B |
|
||
| Healthcare | 2 | $330B |
|
||
Price history
+321.1% since first listed35 events — show timeline
- 2025-12-08 Price Changed $189,500 HLMLS as distributed by MLS GRID
- 2025-12-08 Price Changed $189,500 Unlock MLS
- 2025-08-20 Price Changed $194,500 HLMLS as distributed by MLS GRID
- 2025-08-20 Price Changed $194,500 Unlock MLS
- 2025-06-16 Price Changed $199,900 HLMLS as distributed by MLS GRID
- 2025-06-16 Price Changed $199,900 Unlock MLS
- 2025-03-24 Price Changed $209,000 HLMLS as distributed by MLS GRID
- 2025-03-24 Price Changed $209,000 Unlock MLS
- 2024-11-13 Rental Removed $1,950 RENTALBEAST
- 2024-11-02 Listed $219,000 HLMLS as distributed by MLS GRID
- 2024-11-01 Listed $219,000 Unlock MLS
- 2024-10-24 Price Changed $1,950 RENTALBEAST
- 2024-10-03 Listed for Rent $1,995 RENTALBEAST
- 2024-09-12 Listing Removed — LERA
- 2024-06-06 Listed $250,000 LERA
- 2024-06-06 Listed — Unlock MLS
- 2024-04-24 Relisted — Unlock MLS
- 2024-04-24 Listing Removed — LERA
- 2023-12-14 Listed $275,000 LERA
- 2023-12-14 Listed — Unlock MLS
- 2023-07-26 Rental Removed — ACTRIS
- 2023-07-13 Listed for Rent — ACTRIS
- 2022-08-24 Sold (Public Records) — Public Records
- 2020-03-02 Pending — Unlock MLS
- 2020-03-02 Delisted — Unlock MLS
- 2020-02-20 Price Changed — Unlock MLS
- 2020-01-20 Listed — Unlock MLS
- 2007-11-13 Sold (Public Records) — Public Records
- 2006-10-05 Sold (Public Records) $47,000 Public Records
- 2005-06-30 Sold (MLS) — Unlock MLS
- 2004-04-26 Listed $45,000 Unlock MLS
- 2001-07-17 Delisted — Unlock MLS
- 2000-08-07 Listed — Unlock MLS
- 1999-07-29 Delisted — Unlock MLS
- 1999-03-25 Listed — Unlock MLS
Property tax history
+9.0%/yrLatest (2026): $2,214 · +0.0% YoY. Source: county tax records.
Cash-flow waterfall
monthlySold comps — $/sqft
last 12 mo · ≤1 miLoading sold comps…