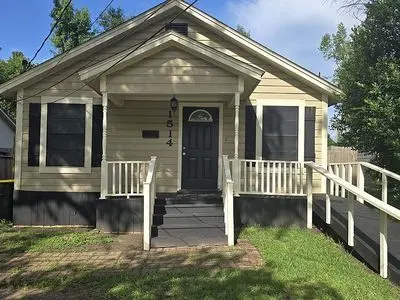
1514 N Thompson St · Conroe, TX
Flood risk 1/10 · Minimal
- FEMA flood zone
- X (unshaded)
- Chance of flooding over 30 yrs
- 0.0%
- Est. flood insurance / yr
- $507 – $1,088
Fire risk 1/10 · Minimal
- Est. fire insurance / yr
- $1,222 – $2,270
Heat risk 8/10 · Major
- Hot days now (above 111°F)
- 7 days/yr
- Hot days in 30 yrs
- 24 days/yr
Wind risk 8/10 · Major
- Chance of severe wind over 30 yrs
- 99.0%
Air-quality risk 2/10 · Minimal
- Unhealthy air days now
- 2 days/yr
- Unhealthy air days in 30 yrs
- 2 days/yr
Risk factors via First Street. Map © Google.
Why this score? — see what drove the D+ grade
The composite is a weighted blend of 9 inputs, each scored 0–100. Each bar is that input's sub-score; the figure is the points it added to the 100-point composite (weight × sub-score).
- Cash flow +14.8/30.0
- ARV discount +10.8/15.0
- Schools +5.1/10.0
- DSCR +4.5/10.0
- 1% rule +3.7/10.0
- Livability +3.7/5.0
- Rent growth +2.9/5.0
- Condition / age +2.5/5.0
- Appreciation +0.0/10.0
$145,000
🖨 Deal sheet (PDF) 📄 Offer letter ✓ Due diligence
Listing remarks
Precious single family home located approximately eight blocks from the county courthouse on the beautiful North Thompson street of Conroe. .. waiting for someone to love. It was my grandmother& apos; s home and she passed several years ago. Has a brand new three ton central a/c unit. Fresh paint and new laminate flooring throughout. Needs some work in the playroom and utility room. This is why we have it priced so reasonable. Has a work shop/ garage in the back. With its rustic charm would be a precious home for a new family or retired couple! Any offer will be considered. Please call Rachel.
Key facts
- Work shop garage
- Central ac unit
- Built 1940
Tags
Neighborhood map
What this means for you Summary
Snapshot
- This is a 2-bed/1.0-bath single-family listed at $145k.
Deal economics
- At list price, monthly cash flow is $39 ($467/yr) — positive.
- The deal already cash-flows at list — no discount required.
- To meet the 1% rule (rent ≥ 1% of price), the offer needs to be $126k (12.8% below list).
- Recommended offer: $126k (12.8% below list) — sets the bar for 1% rule.
- Cap rate 6.6% vs local median 3.1% in Conroe — top-decile yield for the area; either an underpriced asset or a hidden risk that comps aren't pricing in. Stress-test before assuming the spread holds.
Location & tenants
- Location reads 74/100 on livability (#169 in TX, #4,447 nationally) — a middle-class / working-renter tenant base. Strengths: cost of living A+, housing A+, amenities B; Watch: commute F, health & safety F.
- Conroe ISD (other): math 57% / reading 57% proficiency, ranked #69 of 826 in TX (top 8%) — acceptable for families but not a draw, mixed tenant base, ~2y average lease.
- Zoned schools: Houston El (math 22% / reading 27%, grade F, #3,052 of 4,322 statewide, top 74%, 608 students, 95% FRL); Peet J H (math 45% / reading 50%, grade C-, #408 of 1,662 statewide, top 25%, 1,289 students, 58% FRL); Conroe H S (math 32% / reading 51%, grade F, #767 of 1,632 statewide, top 47%, 4,915 students, 61% FRL) — zoned schools average 72% FRL vs 34% district-wide (37 pts higher); higher-poverty schools than district average — tighter screening recommended.
- Zoned-school proficiency averages 38% at this address vs 57% district-wide (-19 pts) — the specific schools serving this property underperform the Conroe ISD average; the district grade overstates school quality for this exact location.
- Market conditions: Rents rising (+1.4%/yr); 487 active listings in the ZIP; 40 comparable units currently listed for rent nearby; rentals leasing fast (median 13d on market — plan ~1-2 weeks tenant-placement turnaround); 13,259 units permitted in Montgomery County in 2024 (1,402 in 5+ unit buildings).
Forward outlook
- Local home prices are declining (-3.0%/yr); year-one equity from $1k of loan paydown is wiped out by about $4k of value loss. Plan a longer hold.
- Montgomery County population projected at +65% by 2050 — long-run rental-demand tailwind backs the buy-and-hold thesis.
Negotiation context
- It's been on market 18 days — a 2% lower offer ($143k) is reasonable based on typical stale-listing flexibility.
Risks & watch-outs
- Watch-outs: built in 1940 — expect roof / HVAC / electrical / plumbing capex.
- Climate carrying-cost: severe wind risk, 99% chance of damaging wind over 30y; extreme-heat days projected 7→24/yr by 2055 (HVAC capex compounding) — expect insurance premiums to compound above CPI over the hold.
Questions for the listing agent
- Built in 1940 — when were the roof, HVAC, electrical panel, plumbing, and water heater last replaced?
- Is there a deadline driving the sale (1031 exchange, divorce, estate, relocation)? That informs how much negotiation room exists.
- Schools are D-rated, which usually means shorter tenancies and higher turnover. Who's the typical renter profile here, and what's been the actual vacancy rate?
- The area grade is low — what's the realistic commute time and amenity access for the typical tenant pool here? Any planned neighborhood developments (good or bad) we should know about?
- What's the average days-on-market for RENTAL listings here right now (not sales)? A rising rental-DOM trend means longer vacancies and softer asking-rent achievability than the comps imply.
- What's the recent tenant-quality profile in this submarket — average credit score on applications, eviction rate, late-payment / NSF rate, and stable-employment percentage? A property-management company in the area should have these aggregated.
- How much new for-sale + rental construction is in the pipeline within 1–3 miles? Heavy new supply typically softens prices + rents 12–24 months out; constrained supply supports both.
Investment metrics
- 1% rule
- 0.87% ✗
- Cap rate
- 6.62%
- Cash-on-cash
- 1.15%
- DSCR
- 1.05
- GRM
- 9.6
CMA / ARV
- ARV (on-the-fly)
- $156,600
- Comps found
- 2
Show comp detail 2 sales within ~0.75 mi
| Address | Dist | Beds/Ba | Sqft | Sold | Price | $/sf | Match |
|---|---|---|---|---|---|---|---|
| 1315 N Roberson St | 0.17mi | 3/1.0 (+1) | 861 (-4%) | 8mo | $150,000 | $174 | 73 |
| 1017 W Austin St | 0.72mi | 2/1.0 | 920 (+2%) | 2mo | $112,500 | $122 | 61 |
Match score weights: distance 35% · size 25% · config 20% · recency 20%. Top-matched comps best support the ARV.
Projected returns pro-forma
-3.0% appreciation · 1.43% rent growth · sell at horizon
- IRR
- -16.2%
- Equity multiple
- 0.43×
- Total profit
- $-22,989
- Equity at exit
- $21,620
- IRR
- -10.8%
- Equity multiple
- 0.39×
- Total profit
- $-24,672
- Equity at exit
- $12,537
Cash invested: $40,600 (down + closing). Projections, not guarantees.
Landlord ↔ Tenant lean methodology
- Overall (STATE)
- 87 Strongly Landlord-Friendly
- State Texas
- 87 Strongly Landlord-Friendly · R+5
- County
- — inherits STATE
- City
- — inherits STATE
ZIP-level market 77301
- Home prices YoY
- -8.4%
- Rents YoY
- 1.4%
- Active inventory
- 487
- Price-to-rent
- 9.6×
Monthly cashflow live
- Estimated rent
- $1,265 high interval (Pro) →
- Mortgage (P&I)
- −$760
- Tax from tax record
- −$139 /mo · $1,674/yr
- Insurance
- −$60
- HOA
- −$0
- Vacancy / Maint / Mgmt
- −$266
- Net cashflow
- $39
Break-even live
Sensitivity live
| Price | -10% $121 | -5% $80 | +0% $39 | +5% $-2 | +10% $-43 |
|---|---|---|---|---|---|
| Rent | -10% $-61 | -5% $-11 | +0% $39 | +5% $89 | +10% $139 |
| Rate | -1.0pp $112 | -0.5pp $76 | base $39 | +0.5pp $1 | +1.0pp $-37 |
UW: 25.0% down · 7.5% · 30yr · 1.5% tax · 5.0% vac · 8.0% maint · 8.0% mgmt
Financing live
Cash to close
- Down payment
- $36,250
- Closing costs
- $4,350
- Reserves months
- —
- Total cash needed
- —
Loan-product check · same deal, 3 products live
Conventional
25% down · 7.5% · 30yr
- Down + closing
- —
- Monthly P&I
- —
- Monthly cashflow
- —
- DSCR
- —
- Eligible?
- —
Personal DTI + credit; lowest rate.
DSCR
20% down · 8.5% · 30yr
- Down + closing
- —
- Monthly P&I
- —
- Monthly cashflow
- —
- DSCR
- —
- Eligible?
- —
No personal income docs; deal must DSCR.
Hard money
10% down · 12.0% · 12mo
- Down + closing
- —
- Monthly P&I
- —
- Monthly cashflow
- —
- DSCR
- —
- Eligible?
- —
Short-term bridge; refi at stabilization.
Rent comps 40 comps
| Address | Beds | Baths | Sqft | Rent | $/sqft | DOM | Units | Dist |
|---|---|---|---|---|---|---|---|---|
| 115 Lillian St Unit LL115 Conroe, TX | 3.0 | 2.0 | 1120 | $1,399 | $1.25 | 7d | 1 | 0.21mi |
| 1619 N Frazier St Unit 104 Conroe, TX | 1.0 | 1.0 | 669 | $1,495 | $2.23 | 0d | 1 | 0.48mi |
| 1619 N Frazier St Unit FHH1 Conroe, TX | 1.0 | 1.0 | 779 | $1,299 | $1.67 | 7d | 1 | 0.48mi |
| 1619 N Frazier St Unit 339 Conroe, TX | 1.0 | 1.0 | 779 | $1,365 | $1.75 | 0d | 1 | 0.48mi |
| 1619 N Frazier St Conroe, TX | 1.0 | 1.0 | 779 | $1,299 | $1.67 | 26d | 1 | 0.48mi |
| 1619 N Frazier St Conroe, TX | 1.0–2.0 | 1.0–2.0 | 824 | $1,895 | $2.30 | 9d | 10 | 0.48mi |
| 1619 N Frazier St Conroe, TX | 2.0 | 2.0 | 980 | $1,309 | $1.34 | 45d | 1 | 0.48mi |
| 901 Wilson Rd Unit 1047 Conroe, TX | 1.0 | 1.0 | 683 | $909 | $1.33 | 0d | 1 | 0.53mi |
| 901 Wilson Rd Unit 2047 Conroe, TX | 2.0 | 2.0 | 917 | $1,103 | $1.20 | 13d | 1 | 0.53mi |
| 901 Wilson Rd Unit 952 Conroe, TX | 1.0 | 1.0 | 683 | $905 | $1.33 | 45d | 1 | 0.55mi |
| 901 Wilson Rd Unit 958 Conroe, TX | 2.0 | 2.0 | 917 | $1,103 | $1.20 | 0d | 1 | 0.55mi |
| 901 Wilson Rd Unit 2228 Conroe, TX | 2.0 | 2.0 | 917 | $1,144 | $1.25 | 0d | 1 | 0.55mi |
| 901 Wilson Rd Unit 1228 Conroe, TX | 1.0 | 1.0 | 683 | $868 | $1.27 | 0d | 1 | 0.55mi |
| 901 Wilson Rd Unit 1162 Conroe, TX | 1.0 | 1.0 | 683 | $879 | $1.29 | 7d | 1 | 0.55mi |
| 901 Wilson Rd Unit 2162 Conroe, TX | 2.0 | 2.0 | 917 | $1,119 | $1.22 | 9d | 1 | 0.55mi |
| 901 Wilson Rd Unit 975 Conroe, TX | 1.0 | 1.0 | 683 | $918 | $1.34 | 12d | 1 | 0.55mi |
| 901 Wilson Rd Unit 320 Conroe, TX | 1.0 | 1.0 | 683 | $879 | $1.29 | 9d | 1 | 0.55mi |
| 901 Wilson Rd Unit 922 Conroe, TX | 1.0 | 1.0 | 581 | $945 | $1.63 | 15d | 1 | 0.55mi |
| 510 Billie Bess Ln Unit 214 Conroe, TX | 1.0 | 1.0 | 634 | $1,070 | $1.69 | 45d | 1 | 0.56mi |
| 901 Wilson Rd Conroe, TX | 1.0 | 1.0 | 683 | $868 | $1.27 | 14d | 1 | 0.57mi |
| 511 N 3rd St Conroe, TX | 3.0 | 1.0 | 1100 | $1,695 | $1.54 | 5d | 1 | 0.66mi |
| 1101 Wilson Rd Conroe, TX | 1.0–2.0 | 1.0 | 720 | $1,190 | $1.65 | 17d | 13 | 0.71mi |
| 1107 Wilson Rd Conroe, TX | 1.0 | 1.0 | 703 | $860 | $1.22 | 45d | 1 | 0.75mi |
| 1206 Wilson Rd Conroe, TX | 1.0 | 1.0 | 779 | $1,299 | $1.67 | 45d | 1 | 0.90mi |
| 900 Holly Dr Conroe, TX | 2.0 | 1.0 | 850 | $1,095 | $1.29 | 15d | 3 | 0.99mi |
| 900 Holly Dr Unit 16 Conroe, TX | 2.0 | 1.0 | 850 | $1,095 | $1.29 | 45d | 1 | 0.99mi |
| 241 Interstate 45 S Conroe, TX | 2.0 | 2.0 | 979 | $1,250 | $1.28 | 45d | 1 | 1.02mi |
| 2007 Cedar Ln Conroe, TX | 1.0 | 1.0 | 607 | $875 | $1.44 | 45d | 1 | 1.05mi |
| 2020 Plantation Dr Conroe, TX | 1.0–2.0 | 1.0–2.0 | 779 | $1,180 | $1.51 | 0d | 18 | 1.12mi |
| 1900 Westview Blvd Conroe, TX | 1.0 | 1.0 | 724 | $943 | $1.30 | 14d | 1 | 1.21mi |
| 1900 Westview Blvd Conroe, TX | 2.0 | 2.0 | 1016 | $1,320 | $1.30 | 9d | 1 | 1.21mi |
| 1900 Westview Blvd Unit 2047 Conroe, TX | 2.0 | 2.0 | 1016 | $1,076 | $1.06 | 13d | 1 | 1.24mi |
| 1900 Westview Blvd Unit 2047 Conroe, TX | 2.0 | 2.0 | 1016 | $1,025 | $1.01 | 0d | 1 | 1.24mi |
| 1900 Westview Blvd Unit 1957 Conroe, TX | 2.0 | 2.0 | 1016 | $1,247 | $1.23 | 15d | 1 | 1.24mi |
| 1900 Westview Blvd Unit 320 Conroe, TX | 1.0 | 1.0 | 724 | $954 | $1.32 | 9d | 1 | 1.24mi |
| 1900 Westview Blvd Unit 1921 Conroe, TX | 1.0 | 1.0 | 724 | $993 | $1.37 | 12d | 1 | 1.24mi |
| 1900 Westview Blvd Unit 420 Conroe, TX | 2.0 | 2.0 | 1016 | $1,065 | $1.05 | 12d | 1 | 1.24mi |
| 1900 Westview Blvd Unit 1921 Conroe, TX | 1.0 | 1.0 | 724 | $1,163 | $1.61 | 15d | 1 | 1.24mi |
| 1900 Westview Blvd Unit 1951 Conroe, TX | 1.0 | 1.0 | 724 | $1,106 | $1.53 | 45d | 1 | 1.24mi |
| 2219 N Frazier St Conroe, TX | 2.0 | 2.0 | 1023 | $1,100 | $1.08 | 45d | 1 | 1.24mi |
Listing history 11 events
-
2026-06-21days on market $145,000 Active 18 DOM
-
2026-06-18days on market $145,000 Active 15 DOM
-
2026-06-17days on market $145,000 Active 14 DOM
-
2026-06-16days on market $145,000 Active 13 DOM
-
2026-06-15days on market $145,000 Active 12 DOM
-
2026-06-13days on market $145,000 Active 10 DOM
-
2026-06-09days on market $145,000 Active 6 DOM
-
2026-06-08days on market $145,000 Active 5 DOM
-
2026-06-07days on market $145,000 Active 4 DOM
-
2026-06-04remarks 601-char remark
-
2026-06-04$145,000 Active 1 DOM
ⓘ Source: listings_history table (triggers on properties + properties_extension) + one-shot
backfill from property_details.listing_events for pre-trigger history.
Tax reassessment forecast TX · Resets to sale price
- Current annual tax
- $1,674 · $139/mo
- Projected year-2 tax
- $2,654 · $221/mo
- Expected delta
- +$980/yr (+$82/mo · 58.5%)
ⓘ Screening estimate from a state-policy table — verify with the county assessor before closing.
Climate risk First Street
- Flood 1/10 Low FEMA zone X (unshaded) · 0% chance over 30 yrs
- Wildfire 1/10 Low
- Heat 8/10 Severe 7 d/yr ≥111°F today · 24 d/yr by 30 yrs out
- Wind 8/10 Severe 99% chance of damaging wind over 30 yrs
- Air quality 2/10 Low 2 unhealthy d/yr today · 2 by 30 yrs out
Nearby sold comps map
Loading sold comps map…
Walkable amenities ~0.75 mi
Loading nearby amenities…
Taxation est. · year 1
- Rental income
- $15,179
- − Mortgage interest
- −$8,122
- − Property taxes
- −$1,674
- − Insurance
- −$725
- − Repairs & maintenance
- −$1,214
- − Management
- −$1,214
- − Depreciation
- −$4,218
- Taxable loss
- −$1,989
- Est. tax savings @ 24.0%
- +$477
- After-tax cash flow
- $945/yr
For passive investors: Depreciation is non-cash, so a rental often shows a tax loss while cash-flowing — sheltering income. Rental losses are passive: they offset passive income freely, and up to $25,000/yr can offset ordinary (W-2) income if you actively participate and your MAGI is under $100k (phasing out to $0 by $150k); unused losses carry forward. On sale, claimed depreciation is recaptured at up to 25%, and gains may owe capital-gains tax (a 1031 exchange can defer both). Figures are a year-1 estimate at your 24.0% rate — not tax advice; consult a CPA.
Schools (NCES district)
- District
- Conroe ISD
- NCES district ID
- 4815000
- Math proficiency
- 57% ▼ -6.00%
- Reading proficiency
- 57% ▼ -1.00%
- Median HH income
- $71,541
- Composite
- 50.65/100
- National rank
- #1833
- State rank
- #69 of 826 in TX
Livability — Conroe
- Score
- 74/100
- State rank
- #169
- US rank
- #4447
Category grades
Schools grade is shown separately in the Schools card above.
Census & demographics
- Census place
- Conroe, TX
- County
- Montgomery County · 663,713 people
- City population
- 205,417
- Metro
- Houston-The Woodlands-Sugar Land, TX
- Population (ZIP)
- 37,769
- Household income
- $66,475
- Rent vs Own
- Severe rent burden
- 1256.0
Population outlook (Montgomery County) Hauer SSP2
- Today (2025)
- 713,896 people
- By 2030
- 805,263 · +12.8%
- By 2040
- 992,708 · +39.1%
- By 2050
- 1,179,590 · +65.2%
- By 2075
- 1,628,084 · +128.1%
- By 2100
- 1,937,880 · +171.5%
Race, ethnicity, and origin ACS 2023
- Neighborhood character
- Diverse neighborhood (Simpson 0.62)
- Race & ethnicity
- Hispanic / Latino 52% White 31% Two or more races 19% Black 13% Asian 2% Native American 2%
- Hispanic origin (detail)
- Mexican 37%
- Common ancestry
- Lithuanian 2% Slovak 1% Romanian 1%
- Foreign-born
- 27% · Canada, Jamaica
- Languages at home
- 51% English-only · Spanish 45% Other Asian/Pacific 2%
Political lean MEDSL · Montgomery
- 2024 margin
- Solid R (+45.5) · D 26.8% · R 72.3%
- 2008→2024 swing
- +7.2pp toward D · 2008: -52.7pp · 2024: -45.5pp
- All cycles
- 2024: R+45.5 2020: R+43.8 2016: R+51.4 2012: R+60.7 2008: R+52.7
Not yet ingested
- Civics
- —
Market trends
- HPI YoY
- ▼ -25.51%
- Current HPI
- 278.6662
- Rent YoY
- ▲ 1.43%
- Metro
- Houston-The Woodlands-Sugar Land, TX
- State GDP YoY
- ▲ 3.95%
- F500 in state
- 110
Industry mix (Fortune 500 HQ in TX)
| Industry | F500 HQs | Revenue |
|---|---|---|
| Energy | 16 | $1,198B |
|
||
| Technology | 5 | $198B |
|
||
| Engineering / Construction | 4 | $72B |
|
||
| Energy Services | 3 | $60B |
|
||
| Utilities | 3 | $41B |
|
||
| Healthcare | 2 | $330B |
|
||
Price history
1 event — show timeline
- 2026-06-04 Listed $145,000 FSBO.com
Property tax history
+8.3%/yrLatest (2025): $1,674 · -15.4% YoY. Source: county tax records.
Cash-flow waterfall
monthlySold comps — $/sqft
last 12 mo · ≤1 miLoading sold comps…