11272 E Applehill Rd · Prairie Grove, AR
Flood risk 1/10 · Minimal
- FEMA flood zone
- X (unshaded)
- Chance of flooding over 30 yrs
- 0.0%
- Est. flood insurance / yr
- $507 – $1,088
Fire risk 5/10 · Moderate
- Est. fire insurance / yr
- $1,499 – $2,785
Heat risk 5/10 · Moderate
- Hot days now (above 105°F)
- 7 days/yr
- Hot days in 30 yrs
- 20 days/yr
Wind risk 2/10 · Minimal
- Chance of severe wind over 30 yrs
- 3.0%
Air-quality risk 2/10 · Minimal
- Unhealthy air days now
- 1 days/yr
- Unhealthy air days in 30 yrs
- 1 days/yr
Risk factors via First Street. Map © Google.
Why this score? — see what drove the B- grade
The composite is a weighted blend of 9 inputs, each scored 0–100. Each bar is that input's sub-score; the figure is the points it added to the 100-point composite (weight × sub-score).
- Cash flow +30.0/30.0
- 1% rule +10.0/10.0
- DSCR +10.0/10.0
- ARV discount +7.5/15.0
- Schools +3.6/10.0
- Livability +3.4/5.0
- Rent growth +2.5/5.0
- Condition / age +1.0/5.0
- Appreciation +0.0/10.0
$100,000
🖨 Deal sheet 📄 Offer letter ✓ Due diligence
Listing remarks
Great potential in this property on bypass and a nice residential house. Agent owned
Key facts
- 1.88 acre lot
- Parking
- Built 1994
Neighborhood map
What this means for you Summary
Snapshot
- This is a 4-bed/1.0-bath single-family listed at $100k. Condition is rated poor.
Deal economics
- At list price, monthly cash flow is $819 ($10k/yr) — positive.
- The deal already cash-flows at list — no discount required.
- Meets the 1% rule at list price ($2k rent vs $100k).
- Cap rate 16.1% vs local median 3.7% in Prairie Grove — top-decile yield for the area; either an underpriced asset or a hidden risk that comps aren't pricing in. Stress-test before assuming the spread holds.
Location & tenants
- Location reads 67/100 on livability (#99 in AR) — a middle-class / working-renter tenant base. Strengths: crime A+, cost of living A+, housing A+; Watch: amenities F, commute F, health & safety F.
- Prairie Grove School District (town): math 43% / reading 39% proficiency, ranked #50 of 238 in AR (top 21%) — families likely to look elsewhere, expect single-tenant / working-renter base with shorter leases.
- Market conditions: 283 active listings in the ZIP; 3 comparable units currently listed for rent nearby; rentals at typical pace (median 14d on market — plan ~3-4 weeks tenant-placement turnaround); 3,494 units permitted in Washington County in 2024 (1,497 in 5+ unit buildings).
- This rent runs 32% of the median local income ($71k/yr) — at the standard rent-burdened threshold; future hikes will face affordability resistance.
Forward outlook
- Local home prices are declining (-3.0%/yr); year-one equity from $691 of loan paydown is wiped out by about $3k of value loss. Plan a longer hold.
- Washington County population projected at +47% by 2050 — long-run rental-demand tailwind backs the buy-and-hold thesis.
- At projected returns (-3.0% appreciation + 3.0% rent growth), your $28k cash investment doubles in ~4 years — after that, you're playing with house money.
Negotiation context
- Only 1 days on market — expect competitive offers; lowballing is unlikely to land.
Risks & watch-outs
- Climate carrying-cost: moderate wildfire risk; extreme-heat days projected 7→20/yr by 2055 (HVAC capex compounding) — expect insurance premiums to compound above CPI over the hold.
Questions for the listing agent
- Have any recent inspections been done? Can we get a copy of the seller's disclosures and any deferred-maintenance estimates?
- Is there a deadline driving the sale (1031 exchange, divorce, estate, relocation)? That informs how much negotiation room exists.
- What's the average days-on-market for RENTAL listings here right now (not sales)? A rising rental-DOM trend means longer vacancies and softer asking-rent achievability than the comps imply.
- What's the recent tenant-quality profile in this submarket — average credit score on applications, eviction rate, late-payment / NSF rate, and stable-employment percentage? A property-management company in the area should have these aggregated.
- How much new for-sale + rental construction is in the pipeline within 1–3 miles? Heavy new supply typically softens prices + rents 12–24 months out; constrained supply supports both.
Investment metrics
- 1% rule
- 1.91% ✓
- Cap rate
- 16.12%
- Cash-on-cash
- 35.11%
- DSCR
- 2.56
- GRM
- 4.4
CMA / ARV
- ARV (on-the-fly)
- $400,302
- Comps found
- 12
Show comp detail 12 sales within ~0.75 mi
| Address | Dist | Beds/Ba | Sqft | Sold | Price | $/sf | Match |
|---|---|---|---|---|---|---|---|
| 11272 E Applehill Rd | 0.00mi | 4/1.0 | 2,118 (0%) | 1mo | $100,000 | $47 | 99 |
| 605 Chamberlain Rd | 0.67mi | 4/2.0 | 2,095 (-1%) | 0mo | $380,000 | $181 | 63 |
| 606 Hindman Dr | 0.51mi | 4/2.5 | 2,168 (+2%) | 8mo | $415,000 | $191 | 60 |
| 607 Chamberlain | 0.66mi | 4/2.0 | 2,162 (+2%) | 12mo | $440,000 | $204 | 52 |
| 11185 E Applehill Rd | 0.17mi | 3/2.0 (-1) | 1,821 (-14%) | 17mo | $250,000 | $137 | 46 |
| 807 Sedgwick Dr | 0.72mi | 4/2.0 | 1,941 (-8%) | 6mo | $380,000 | $196 | 44 |
| 901 Sedgwick Dr | 0.65mi | 4/2.5 | 1,931 (-9%) | 11mo | $369,000 | $191 | 40 |
| 809 Sedgwick Dr | 0.71mi | 4/2.0 | 1,929 (-9%) | 11mo | $330,000 | $171 | 39 |
| 815 Custer St | 0.66mi | 3/2.0 (-1) | 1,804 (-15%) | 2mo | $334,000 | $185 | 34 |
| 611 Chamberlain Rd | 0.65mi | 3/2.5 (-1) | 2,299 (+8%) | 15mo | $450,000 | $196 | 32 |
| 805 Sedgwick Dr | 0.74mi | 3/2.0 (-1) | 1,889 (-11%) | 8mo | $357,500 | $189 | 32 |
| 613 Chamberlain Rd | 0.65mi | 4/2.0 | 1,900 (-10%) | 22mo | $360,000 | $189 | 30 |
Match score weights: distance 35% · size 25% · config 20% · recency 20%. Top-matched comps best support the ARV.
Projected returns pro-forma
-3.0% appreciation · 3.0% rent growth · sell at horizon
- IRR
- 30.7%
- Equity multiple
- 2.29×
- Total profit
- $36,002
- Equity at exit
- $14,910
- IRR
- 37.9%
- Equity multiple
- 4.52×
- Total profit
- $98,653
- Equity at exit
- $8,646
Cash invested: $28,000 (down + closing). Projections, not guarantees.
Landlord ↔ Tenant lean methodology
- Overall (STATE)
- 92 Strongly Landlord-Friendly
- State Arkansas
- 92 Strongly Landlord-Friendly · R+14
- County
- — inherits STATE
- City
- — inherits STATE
ZIP-level market 72753
- Home prices YoY
- -15.1%
- Active inventory
- 283
- Price-to-rent
- 4.4×
Monthly cashflow live
- Estimated rent
- $1,912 medium interval (Pro) →
- Mortgage (P&I)
- −$524
- Tax est. 1.5%
- −$125 /mo · $1,500/yr
- Insurance
- −$42
- HOA
- −$0
- Vacancy / Maint / Mgmt
- −$401
- Net cashflow
- $819
Break-even live
UW: 25.0% down · 7.5% · 30yr · 1.5% tax · 5.0% vac · 8.0% maint · 8.0% mgmt
Financing live
Cash to close
- Down payment
- $25,000
- Closing costs
- $3,000
- Reserves months
- —
- Total cash needed
- —
Loan-product check · same deal, 3 products live
Conventional
25% down · 7.5% · 30yr
- Down + closing
- —
- Monthly P&I
- —
- Monthly cashflow
- —
- DSCR
- —
- Eligible?
- —
Personal DTI + credit; lowest rate.
DSCR
20% down · 8.5% · 30yr
- Down + closing
- —
- Monthly P&I
- —
- Monthly cashflow
- —
- DSCR
- —
- Eligible?
- —
No personal income docs; deal must DSCR.
Hard money
10% down · 12.0% · 12mo
- Down + closing
- —
- Monthly P&I
- —
- Monthly cashflow
- —
- DSCR
- —
- Eligible?
- —
Short-term bridge; refi at stabilization.
Rent comps 3 comps
| Address | Beds | Baths | Sqft | Rent | $/sqft | DOM | Units | Dist |
|---|---|---|---|---|---|---|---|---|
| 1032 PEBBLE Dr Prairie Grove, AR | 3.0 | 2.0 | 1637 | $1,825 | $1.11 | 14d | 1 | 1.29mi |
| 1071 Emerald St Prairie Grove, AR | 3.0 | 2.0 | 1589 | $1,800 | $1.13 | 14d | 1 | 1.31mi |
| 681 Kendra St Prairie Grove, AR | 4.0 | 2.0 | 1550 | $1,695 | $1.09 | 14d | 1 | 1.37mi |
Listing history 6 events
-
2026-04-17status Pending
-
2026-04-15$100,000 Active
-
2022-12-03price $319,900
-
2022-12-03price $219,900
-
2022-10-18price $229,900
-
2022-10-18price $329,900
ⓘ Source: listings_history table (triggers on properties + properties_extension) + one-shot
backfill from property_details.listing_events for pre-trigger history.
Climate risk First Street
- Flood 1/10 Low FEMA zone X (unshaded) · 0% chance over 30 yrs
- Wildfire 5/10 Major
- Heat 5/10 Major 7 d/yr ≥105°F today · 20 d/yr by 30 yrs out
- Wind 2/10 Low 3% chance of damaging wind over 30 yrs
- Air quality 2/10 Low 1 unhealthy d/yr today · 1 by 30 yrs out
Nearby sold comps map
Loading sold comps map…
Walkable amenities ~0.75 mi
Loading nearby amenities…
Taxation est. · year 1
- Rental income
- $22,941
- − Mortgage interest
- −$5,602
- − Property taxes
- −$1,500
- − Insurance
- −$500
- − Repairs & maintenance
- −$1,835
- − Management
- −$1,835
- − Depreciation
- −$2,909
- Taxable income
- $8,760
- Est. tax owed @ 24.0%
- −$2,102
- After-tax cash flow
- $7,728/yr
For passive investors: Depreciation is non-cash, so a rental often shows a tax loss while cash-flowing — sheltering income. Rental losses are passive: they offset passive income freely, and up to $25,000/yr can offset ordinary (W-2) income if you actively participate and your MAGI is under $100k (phasing out to $0 by $150k); unused losses carry forward. On sale, claimed depreciation is recaptured at up to 25%, and gains may owe capital-gains tax (a 1031 exchange can defer both). Figures are a year-1 estimate at your 24.0% rate — not tax advice; consult a CPA.
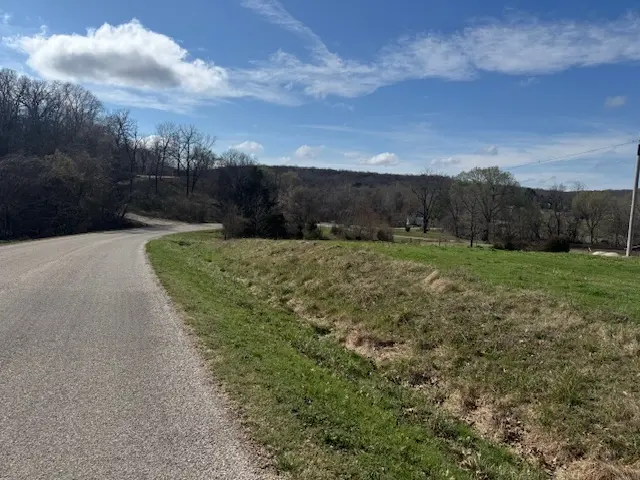
Condition & rehab AI · 2 photos
This property requires extensive work, including landscaping and building a house, to become livable and marketable.
Repairs flagged
- Major Grassy area — Uneven ground and overgrown grass
- Major Foundation/structure — No visible structures
Value-add opportunities
- Both Landscaping and grading — Improves curb appeal and functionality
- Both Building a house — Creates a livable space
Renovation cost estimate screening
| Repair item | Severity | Est. cost |
|---|---|---|
| Grassy area · Uneven ground and overgrown grass | Major | $15,000–50,000 |
| Foundation/structure · No visible structures | Major | $15,000–50,000 |
| Total estimated repair cost · 2 items | $30,000–100,000 |
Value-add ROI direction
- Both Landscaping and grading — Improves curb appeal and functionality ↑
- Both Building a house — Creates a livable space ↑
ⓘ Cost ranges are severity-bucket heuristics (US national rule-of-thumb). Get contractor quotes + a written scope before underwriting a rehab budget.
Schools (NCES district)
- District
- Prairie Grove School District
- NCES district ID
- 0511760
- Math proficiency
- 43% ▼ -13.00%
- Reading proficiency
- 39% ▼ -10.00%
- Median HH income
- $55,896
- Composite
- 35.91/100
- National rank
- #4808
- State rank
- #50 of 238 in AR
Livability — Prairie Grove
- Score
- 67/100
- State rank
- #99
- US rank
- #10475
Category grades
Schools grade is shown separately in the Schools card above.
Census & demographics
- Census place
- Prairie Grove, AR
- County
- Washington County · 252,056 people
- City population
- 10,744
- Metro
- Fayetteville-Springdale-Rogers, AR
- Population (ZIP)
- 10,744
- Household income
- $70,985
- Rent vs Own
- Severe rent burden
- 94.0
Population outlook (Washington County) Hauer SSP2
- Today (2025)
- 271,748 people
- By 2030
- 296,414 · +9.1%
- By 2040
- 346,874 · +27.6%
- By 2050
- 398,552 · +46.7%
- By 2075
- 523,309 · +92.6%
- By 2100
- 615,280 · +126.4%
Race, ethnicity, and origin ACS 2023
- Neighborhood character
- Predominantly White (74%)
- Race & ethnicity
- White 74% Two or more races 20% Hispanic / Latino 5% Native American 1%
- Hispanic origin (detail)
- Mexican 5%
- Common ancestry
- Italian 3% Portuguese 3% Iranian 2%
- Foreign-born
- 2% · Canada
- Languages at home
- 97% English-only · Spanish 2%
Political lean MEDSL · Washington
- 2024 margin
- Lean R (+6.7) · D 45.1% · R 51.7% · Other 3.2%
- 2008→2024 swing
- +6.4pp toward D · 2008: -13.1pp · 2024: -6.7pp
- All cycles
- 2024: R+6.7 2020: R+3.9 2016: R+10.4 2012: R+16.3 2008: R+13.1
Not yet ingested
- Civics
- —
Market trends
- HPI YoY
- ▼ -58.17%
- Current HPI
- 326.3868
- Rent YoY
- —
- Metro
- Fayetteville-Springdale-Rogers, AR
- State GDP YoY
- ▲ 3.80%
- F500 in state
- 10
Industry mix (Fortune 500 HQ in AR)
| Industry | F500 HQs | Revenue |
|---|---|---|
| Retail | 1 | $681B |
|
||
| Food / Agriculture | 1 | $53B |
|
||
| Retail / Energy | 1 | $22B |
|
||
| Transportation / Logistics | 1 | $12B |
|
||
| Energy | 1 | $4B |
|
||
Price history
-69.7% since first listed6 events — show timeline
- 2026-04-17 Pending — NWARMLS
- 2026-04-15 Listed $100,000 NWARMLS
- 2022-12-03 Price Changed $319,900 NWARMLS
- 2022-12-03 Price Changed $219,900 NWARMLS
- 2022-10-18 Price Changed $229,900 NWARMLS
- 2022-10-18 Price Changed $329,900 NWARMLS
Cash-flow waterfall
monthlySold comps — $/sqft
last 12 mo · ≤1 miLoading sold comps…