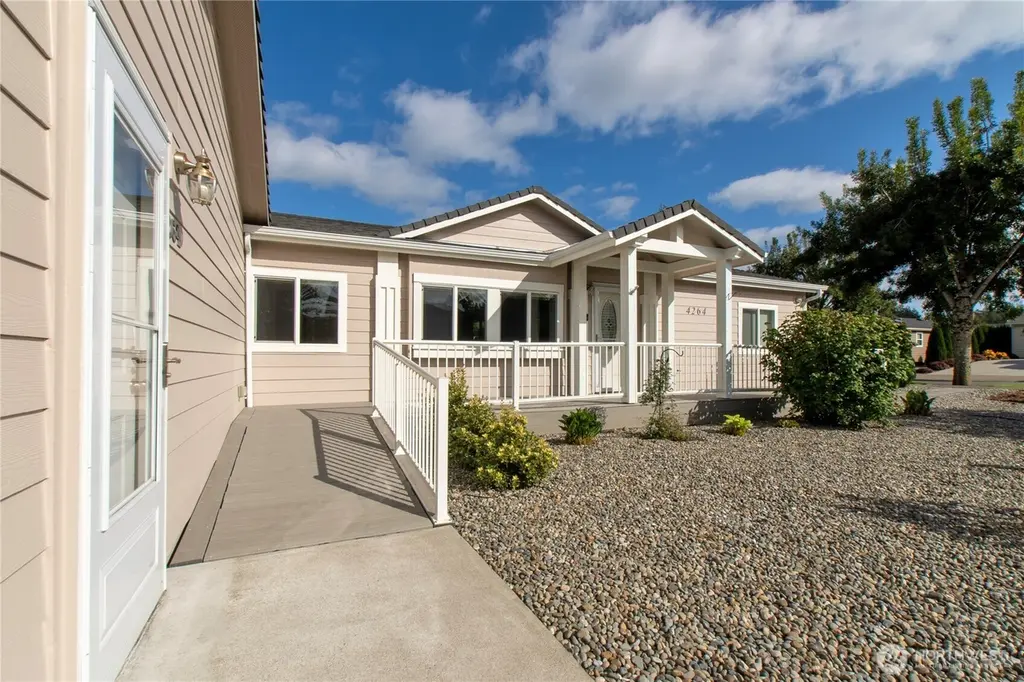
4264 Lakeview Ln SE · Lacey, WA
Flood risk 1/10 · Minimal
- FEMA flood zone
- X (unshaded)
- Chance of flooding over 30 yrs
- 0.0%
- Est. flood insurance / yr
- $507 – $1,088
Fire risk 1/10 · Minimal
- Est. fire insurance / yr
- $604 – $1,122
Heat risk 3/10 · Minor
- Hot days now (above 88°F)
- 7 days/yr
- Hot days in 30 yrs
- 14 days/yr
Wind risk 1/10 · Minimal
- Chance of severe wind over 30 yrs
- —
Air-quality risk 6/10 · Moderate
- Unhealthy air days now
- 7 days/yr
- Unhealthy air days in 30 yrs
- 8 days/yr
Risk factors via First Street. Map © Google.
Why this score? — see what drove the D+ grade
The composite is a weighted blend of 9 inputs, each scored 0–100. Each bar is that input's sub-score; the figure is the points it added to the 100-point composite (weight × sub-score).
- ARV discount +15.0/15.0
- Cash flow +11.7/30.0
- Schools +5.1/10.0
- Livability +4.2/5.0
- DSCR +3.4/10.0
- Rent growth +3.4/5.0
- 1% rule +2.9/10.0
- Condition / age +2.5/5.0
- Appreciation +0.0/10.0
$329,000
🖨 Deal sheet (PDF) 📄 Offer letter ✓ Due diligence
Listing remarks
Beautiful Lakeview Estates 55+ Community. This 3 bedroom 2 bathroom home has been well maintained. With an open concept kitchen featuring an island, eat at bar, an abundance of cabinets for storage, a full tile backsplash, and pantry. The spacious living area has large windows & vaulted ceilings that make the home feel open & bright. New heat pump and water heater recently installed. in The primary bedroom has a walk in closet & an attached bath with walk in shower, 2 sinks, & linen cabinets. Large utility room featuring a washer & dryer that convey as well as heating cooling for the whole house. Enjoy the low maintenance backyard from the covered deck or sit on
Key facts
- Open concept kitchen
- Full tile backsplash
- Walk in closet
Tags
Property features AI
Finance
- Other: Listing is in a land-lease park (land lease amount applies)
- Financial info: Acceptable financing: Cash, Conventional, FHA
- HOA & community: Senior community; Lakeview Meadows Park with clubhouse, common area, exercise room, pool, and spa/hot tub; Land lease fee applies
Exterior
- Parking: Individual garage; Has garage
- Utilities: Electric energy source; Public water; Public sewer; Puget Sound Energy power; Electric water heater
- Home design: Manufactured home (double wide); Palm Harbor Santiam model; One level
- Construction: Cement plank construction; Composition roof; Concrete ribbon foundation with tie downs; Manufactured after 6/15/1976; Very good condition
- Exterior features: Cement-planked exterior; Paved lot; Has view; Spa/Hot tub (community)
Interior
- Kitchen: Dishwasher; Microwave; Refrigerator; Stove/Range
- Bedrooms: 3 bedrooms
- Flooring: Laminate flooring; Vinyl flooring
- Bathrooms: 2 full bathrooms; 1 bathtub; 2 showers
- Heating & cooling: Forced air heating; No cooling
- Interior features: Water heater; Utility room
- Laundry & utility: Washer; Dryer; Utility room with electric water heater
Neighborhood map
What this means for you Summary
Snapshot
- This is a 3-bed/2.0-bath manufactured listed at $329k.
Deal economics
- At list price, monthly cash flow is $-98 ($-1k/yr) — negative.
- To cash-flow at today's rent, offer at most $312k (5.3% below list).
- To meet the 1% rule (rent ≥ 1% of price), the offer needs to be $259k (21.4% below list).
- Recommended offer: $259k (21.4% below list) — sets the bar for 1% rule.
- Cap rate 5.9% vs local median 3.0% in Lacey — top-decile yield for the area; either an underpriced asset or a hidden risk that comps aren't pricing in. Stress-test before assuming the spread holds.
Location & tenants
- Location reads 85/100 on livability (#33 in WA, #581 nationally) — a professional / high-income tenant draw. Strengths: amenities A+, commute A+, housing A+; Watch: cost of living D+.
- North Thurston Public Schools (suburban): math 51% / reading 62% proficiency, ranked #80 of 291 in WA (top 28%) — acceptable for families but not a draw, mixed tenant base, ~2y average lease.
- Zoned schools: Mountain View Elementary (625 students, 65% FRL); Komachin Middle School (643 students, 50% FRL); North Thurston High School (1,440 students, 47% FRL) — zoned schools average 54% FRL vs 31% district-wide (23 pts higher); higher-poverty schools than district average — tighter screening recommended.
- Market conditions: Rents rising (+3.6%/yr); 192 active listings in the ZIP; 18 comparable units currently listed for rent nearby; rentals at typical pace (median 23d on market — plan ~3-4 weeks tenant-placement turnaround); solid renter incomes; 1,222 units permitted in Thurston County in 2024 (508 in 5+ unit buildings).
- This rent runs 35% of the median local income ($89k/yr) — at the standard rent-burdened threshold; future hikes will face affordability resistance.
Forward outlook
- Local home prices are declining (-3.0%/yr); year-one equity from $2k of loan paydown is wiped out by about $10k of value loss. Plan a longer hold.
- Thurston County population projected at +27% by 2050 — long-run rental-demand tailwind backs the buy-and-hold thesis.
Negotiation context
- It's been on market 32 days — a 3% lower offer ($319k) is reasonable based on typical stale-listing flexibility.
- 4 sale attempts since 4y ago with the ask held roughly flat each time — persistent listings suggest the price (not the market) is what's stuck; bring a comps-based counter.
Questions for the listing agent
- What do current leases actually rent for vs. the listed asking? Can we see a recent rent roll and the last 12 months of T-12 income?
- It's been on market 32 days. Have you received any prior offers? Is the seller open to a 21% concession, seller financing, or rate buy-down credit?
- Is there a deadline driving the sale (1031 exchange, divorce, estate, relocation)? That informs how much negotiation room exists.
- Schools are B-rated — typically a magnet for longer-tenancy family renters. What's the average tenant stay here, and is there a school-zone premium baked into asking?
- The area grade is low — what's the realistic commute time and amenity access for the typical tenant pool here? Any planned neighborhood developments (good or bad) we should know about?
- What's the average days-on-market for RENTAL listings here right now (not sales)? A rising rental-DOM trend means longer vacancies and softer asking-rent achievability than the comps imply.
- What's the recent tenant-quality profile in this submarket — average credit score on applications, eviction rate, late-payment / NSF rate, and stable-employment percentage? A property-management company in the area should have these aggregated.
- How much new for-sale + rental construction is in the pipeline within 1–3 miles? Heavy new supply typically softens prices + rents 12–24 months out; constrained supply supports both.
Investment metrics
- 1% rule
- 0.79% ✗
- Cap rate
- 5.93%
- Cash-on-cash
- -1.28%
- DSCR
- 0.94
- GRM
- 10.6
CMA / ARV
- ARV (on-the-fly)
- $400,140
- Comps found
- 6
Show comp detail 6 sales within ~0.75 mi
| Address | Dist | Beds/Ba | Sqft | Sold | Price | $/sf | Match |
|---|---|---|---|---|---|---|---|
| 3805 College St SE #16 | 0.25mi | 3/2.0 | 1,680 (+4%) | 5mo | $130,000 | $77 | 78 |
| 4304 Lakeview Ct SE | 0.11mi | 3/2.0 | 1,560 (-4%) | 15mo | $385,999 | $247 | 76 |
| 4508 36TH Ct SE | 0.29mi | 3/2.0 | 1,680 (+4%) | 10mo | $415,000 | $247 | 72 |
| 4291 Lakeview Ln SE #5 | 0.08mi | 3/2.0 | 1,404 (-13%) | 11mo | $330,000 | $235 | 65 |
| 4262 Meade Ln SE | 0.07mi | 2/2.0 (-1) | 1,458 (-10%) | 19mo | $375,000 | $257 | 59 |
| 4243 Lakeview Ln SE | 0.07mi | 2/1.5 (-1) | 1,782 (+10%) | 20mo | $399,000 | $224 | 56 |
Match score weights: distance 35% · size 25% · config 20% · recency 20%. Top-matched comps best support the ARV.
Projected returns pro-forma
-3.0% appreciation · 3.56% rent growth · sell at horizon
- IRR
- -17.8%
- Equity multiple
- 0.37×
- Total profit
- $-58,145
- Equity at exit
- $49,055
- IRR
- -9.0%
- Equity multiple
- 0.43×
- Total profit
- $-52,775
- Equity at exit
- $28,446
Cash invested: $92,120 (down + closing). Projections, not guarantees.
Landlord ↔ Tenant lean methodology
- Overall (STATE)
- 28 Tenant-Leaning
- State Washington
- 28 Tenant-Leaning · D+8
- County
- — inherits STATE
- City
- — inherits STATE
ZIP-level market 98503
- Rents YoY
- 3.6%
- Active inventory
- 192
- Price-to-rent
- 10.6×
Monthly cashflow live
- Estimated rent
- $2,587 high interval (Pro) →
- Mortgage (P&I)
- −$1,725
- Tax from tax record
- −$279 /mo · $3,352/yr
- Insurance
- −$137
- HOA
- −$0
- Vacancy / Maint / Mgmt
- −$543
- Net cashflow
- $-98
Break-even live
Sensitivity live
| Price | -10% $88 | -5% $-5 | +0% $-98 | +5% $-191 | +10% $-284 |
|---|---|---|---|---|---|
| Rent | -10% $-303 | -5% $-200 | +0% $-98 | +5% $4 | +10% $106 |
| Rate | -1.0pp $67 | -0.5pp $-15 | base $-98 | +0.5pp $-183 | +1.0pp $-270 |
UW: 25.0% down · 7.5% · 30yr · 1.5% tax · 5.0% vac · 8.0% maint · 8.0% mgmt
Financing live
Cash to close
- Down payment
- $82,250
- Closing costs
- $9,870
- Reserves months
- —
- Total cash needed
- —
Loan-product check · same deal, 3 products live
Conventional
25% down · 7.5% · 30yr
- Down + closing
- —
- Monthly P&I
- —
- Monthly cashflow
- —
- DSCR
- —
- Eligible?
- —
Personal DTI + credit; lowest rate.
DSCR
20% down · 8.5% · 30yr
- Down + closing
- —
- Monthly P&I
- —
- Monthly cashflow
- —
- DSCR
- —
- Eligible?
- —
No personal income docs; deal must DSCR.
Hard money
10% down · 12.0% · 12mo
- Down + closing
- —
- Monthly P&I
- —
- Monthly cashflow
- —
- DSCR
- —
- Eligible?
- —
Short-term bridge; refi at stabilization.
Rent comps 18 comps
| Address | Beds | Baths | Sqft | Rent | $/sqft | DOM | Units | Dist |
|---|---|---|---|---|---|---|---|---|
| 3725 Wildspitz Ln SE Lacey, WA | 3.0–4.0 | 3.0 | 1774 | $2,695 | $1.52 | 45d | 4 | 0.12mi |
| 4820 41st Ln SE Lacey, WA | 3.0 | 2.5 | 1716 | $2,395 | $1.40 | 15d | 1 | 0.52mi |
| 4533 Stonegate St SE Lacey, WA | 3.0 | 2.5 | 1868 | $2,695 | $1.44 | 45d | 1 | 0.62mi |
| 4821 27th Ln SE Lacey, WA | 3.0 | 2.0 | 1718 | $2,625 | $1.53 | 45d | 1 | 0.70mi |
| 4625 45th Ave SE Lacey, WA | 1.0–3.0 | 1.0–3.0 | 975 | $2,485 | $2.55 | 15d | 21 | 0.71mi |
| 5208 43rd Ct SE Lacey, WA | 4.0 | 2.5 | 2036 | $2,700 | $1.33 | 45d | 1 | 0.80mi |
| 2700 Ruddell Rd SE Unit 2740-B Lacey, WA | 2.0 | 1.5 | 1054 | $1,695 | $1.61 | 45d | 1 | 1.10mi |
| 5241 52nd Way SE Lacey, WA | 4.0 | 2.5 | 2204 | $3,100 | $1.41 | 23d | 1 | 1.14mi |
| 3702 30th Ave SE Olympia, WA | 4.0 | 2.5 | 2104 | $2,900 | $1.38 | 15d | 1 | 1.15mi |
| 5649 46th Ln SE Lacey, WA | 3.0 | 3.0 | 1100 | $2,300 | $2.09 | 23d | 1 | 1.17mi |
| 3539 Landview Dr SE Olympia, WA | 1.0–3.0 | 1.0–2.0 | 1314 | $2,895 | $2.20 | 15d | 19 | 1.22mi |
| 3425 Polo Club Ln SE Olympia, WA | 1.0–3.0 | 1.0–2.0 | 934 | $2,329 | $2.49 | 15d | 9 | 1.36mi |
| 3622 57th Ln SE Olympia, WA | 2.0 | 2.0 | 1156 | $1,999 | $1.73 | 15d | 1 | 1.40mi |
| 3308 41st Way SE Olympia, WA | 3.0 | 2.0 | 1917 | $2,795 | $1.46 | 15d | 1 | 1.45mi |
| 4566 Beckonridge Loop SE Lacey, WA | 3.0 | 2.5 | 1648 | $2,595 | $1.57 | 45d | 1 | 1.45mi |
| 5216 Ivy Hill Ln SE Lacey, WA | 2.0 | 2.0 | 1361 | $2,595 | $1.91 | 15d | 1 | 1.47mi |
| 5301 Ivy Hill Ln SE Lacey, WA | 2.0 | 2.0 | 1361 | $2,495 | $1.83 | 45d | 1 | 1.47mi |
| 1606 Sulky Dr SE Lacey, WA | 3.0 | 1.5 | 1319 | $2,495 | $1.89 | 23d | 1 | 1.49mi |
Listing history 24 events
-
2026-06-21days on market $329,000 Active 32 DOM
-
2026-06-18days on market $329,000 Active 29 DOM
-
2026-06-17days on market $329,000 Active 28 DOM
-
2026-06-16days on market $329,000 Active 27 DOM
-
2026-06-15days on market $329,000 Active 26 DOM
-
2026-06-14days on market $329,000 Active 24 DOM
-
2026-06-13days on market $329,000 Active 23 DOM
-
2026-06-10days on market $329,000 Active 21 DOM
-
2026-06-09days on market $329,000 Active 20 DOM
-
2026-06-08days on market $329,000 Active 19 DOM
-
2026-06-07pricedays on market $329,000 Active 18 DOM
-
2026-06-03days on market $345,000 Active 14 DOM
-
2026-06-02days on market $345,000 Active 13 DOM
-
2026-06-01days on market $345,000 Active 12 DOM
-
2026-05-31days on market $345,000 Active 11 DOM
-
2026-05-30days on market $345,000 Active 10 DOM
-
2026-05-20$345,000 Active
-
2022-05-12soldstatus $299,000 Closed
-
2022-04-20status Pending
-
2022-04-09status Active
-
2022-03-24historical Active Under Contract
-
2022-03-21status Active
-
2022-03-20status Pending - Backup Offer Requested
-
2022-03-17$299,900 Active
ⓘ Source: listings_history table (triggers on properties + properties_extension) + one-shot
backfill from property_details.listing_events for pre-trigger history.
Tax reassessment forecast WA · Resets to sale price
- Current annual tax
- $3,352 · $279/mo
- Projected year-2 tax
- $3,352 · $279/mo
- Expected delta
- $0/yr ($0/mo · 0.0%)
ⓘ Screening estimate from a state-policy table — verify with the county assessor before closing.
Climate risk First Street
- Flood 1/10 Low FEMA zone X (unshaded) · 0% chance over 30 yrs
- Wildfire 1/10 Low
- Heat 3/10 Moderate 7 d/yr ≥88°F today · 14 d/yr by 30 yrs out
- Wind 1/10 Low
- Air quality 6/10 Major 7 unhealthy d/yr today · 8 by 30 yrs out
Nearby sold comps map
Loading sold comps map…
Walkable amenities ~0.75 mi
Loading nearby amenities…
Taxation est. · year 1
- Rental income
- $31,040
- − Mortgage interest
- −$18,429
- − Property taxes
- −$3,352
- − Insurance
- −$1,645
- − Repairs & maintenance
- −$2,483
- − Management
- −$2,483
- − Depreciation
- −$9,571
- Taxable loss
- −$6,923
- Est. tax savings @ 24.0%
- +$1,662
- After-tax cash flow
- $483/yr
For passive investors: Depreciation is non-cash, so a rental often shows a tax loss while cash-flowing — sheltering income. Rental losses are passive: they offset passive income freely, and up to $25,000/yr can offset ordinary (W-2) income if you actively participate and your MAGI is under $100k (phasing out to $0 by $150k); unused losses carry forward. On sale, claimed depreciation is recaptured at up to 25%, and gains may owe capital-gains tax (a 1031 exchange can defer both). Figures are a year-1 estimate at your 24.0% rate — not tax advice; consult a CPA.
Schools (NCES district)
- District
- North Thurston Public Schools
- NCES district ID
- 5305850
- Math proficiency
- 51% ▬ 0.00%
- Reading proficiency
- 62% ▬ 0.00%
- Median HH income
- $62,338
- Composite
- 51.09/100
- National rank
- #3798
- State rank
- #80 of 291 in WA
Livability — Lacey
- Score
- 85/100
- State rank
- #33
- US rank
- #581
Category grades
Schools grade is shown separately in the Schools card above.
Census & demographics
- Census place
- Lacey, WA
- County
- Thurston County · 269,345 people
- City population
- 108,850
- Metro
- Olympia-Lacey-Tumwater, WA
- Population (ZIP)
- 41,656
- Household income
- $89,002
- Rent vs Own
- Severe rent burden
- 2195.0
Population outlook (Thurston County) Hauer SSP2
- Today (2025)
- 308,239 people
- By 2030
- 326,483 · +5.9%
- By 2040
- 359,890 · +16.8%
- By 2050
- 391,800 · +27.1%
- By 2075
- 468,024 · +51.8%
- By 2100
- 519,890 · +68.7%
Race, ethnicity, and origin ACS 2023
- Neighborhood character
- Diverse neighborhood (Simpson 0.56)
- Race & ethnicity
- White 65% Two or more races 12% Hispanic / Latino 12% Asian 7% Black 5% Pacific Islander 2% Native American 1%
- Hispanic origin (detail)
- Mexican 8% Puerto Rican 1%
- Common ancestry
- Portuguese 4% Slovak 3% Lithuanian 3%
- Foreign-born
- 10% · Canada, Vietnam, South Korea
- Languages at home
- 82% English-only · Spanish 6% German/W. Germanic 3% Other Asian/Pacific 2%
Political lean MEDSL · Thurston
- 2024 margin
- Strong D (+20.4) · D 58.5% · R 38.1% · Other 3.5%
- 2008→2024 swing
- -1.3pp toward R · 2008: 21.7pp · 2024: 20.4pp
- All cycles
- 2024: D+20.4 2020: D+18.6 2016: D+15.4 2012: D+19.0 2008: D+21.7
Not yet ingested
- Civics
- —
Market trends
- HPI YoY
- ▼ -385.93%
- Current HPI
- 361.0974
- Rent YoY
- ▲ 3.56%
- Metro
- Olympia-Lacey-Tumwater, WA
- State GDP YoY
- ▲ 4.65%
- F500 in state
- 22
Industry mix (Fortune 500 HQ in WA)
| Industry | F500 HQs | Revenue |
|---|---|---|
| Retail | 2 | $269B |
|
||
| Technology / Retail | 1 | $638B |
|
||
| Technology | 1 | $245B |
|
||
| Telecommunications | 1 | $38B |
|
||
| Food / Beverage | 1 | $36B |
|
||
| Automotive / Trucks | 1 | $34B |
|
||
Price history
+15.0% since first listed8 events — show timeline
- 2026-05-20 Listed $345,000 NWMLS as Distributed by MLS Grid
- 2022-05-12 Sold (MLS) $299,000 NWMLS as Distributed by MLS Grid
- 2022-04-20 Pending — NWMLS as Distributed by MLS Grid
- 2022-04-09 Relisted — NWMLS as Distributed by MLS Grid
- 2022-03-24 Contingent — NWMLS as Distributed by MLS Grid
- 2022-03-21 Relisted — NWMLS as Distributed by MLS Grid
- 2022-03-20 Pending — NWMLS as Distributed by MLS Grid
- 2022-03-17 Listed $299,900 NWMLS as Distributed by MLS Grid
Property tax history
+6.4%/yrLatest (2026): $3,352 · -2.8% YoY. Source: county tax records.
Cash-flow waterfall
monthlySold comps — $/sqft
last 12 mo · ≤1 miLoading sold comps…