15325-Ave. Orange Ave Unit B-29 · Paramount, CA
Flood risk 5/10 · Moderate
- FEMA flood zone
- X
- Chance of flooding over 30 yrs
- 0.24%
- Est. flood insurance / yr
- $507 – $1,088
Fire risk 1/10 · Minimal
- Est. fire insurance / yr
- $659 – $1,223
Heat risk 5/10 · Moderate
- Hot days now (above 90°F)
- 7 days/yr
- Hot days in 30 yrs
- 21 days/yr
Wind risk 1/10 · Minimal
- Chance of severe wind over 30 yrs
- —
Air-quality risk 6/10 · Moderate
- Unhealthy air days now
- 10 days/yr
- Unhealthy air days in 30 yrs
- 10 days/yr
Risk factors via First Street. Map © Google.
Why this score? — see what drove the B grade
The composite is a weighted blend of 9 inputs, each scored 0–100. Each bar is that input's sub-score; the figure is the points it added to the 100-point composite (weight × sub-score).
- Cash flow +30.0/30.0
- ARV discount +11.7/15.0
- 1% rule +10.0/10.0
- DSCR +10.0/10.0
- Livability +3.2/5.0
- Rent growth +2.3/5.0
- Condition / age +2.2/5.0
- Schools +2.1/10.0
- Appreciation +0.0/10.0
$139,000
🖨 Deal sheet 📄 Offer letter ✓ Due diligence
Listing remarks
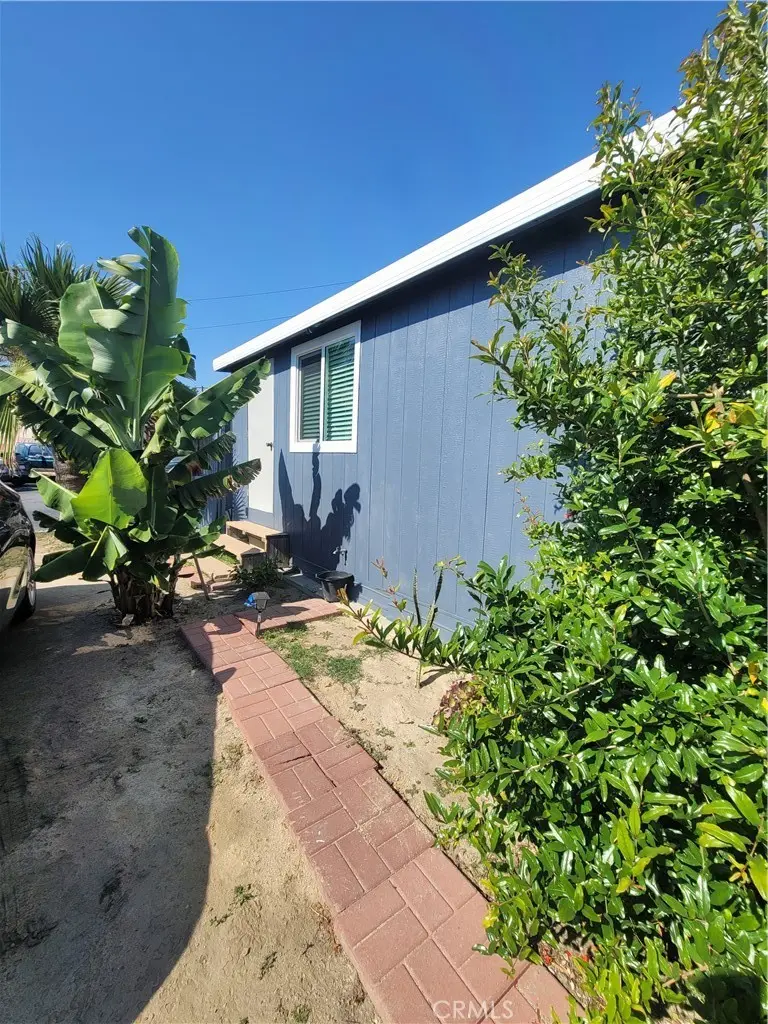
Great potential and comfortable living in an all ages community park. Built in 1964, this 2-bedroom, 1-bath home features approximately 720 sq. ft. of living space with a bright and open layout. The spacious kitchen flows seamlessly into the living and dining areas, creating an inviting atmosphere perfect for everyday living and entertaining. The property also offers ample parking space for multiple vehicles. Conveniently located near shopping, dining, and local amenities, this is a wonderful opportunity to make it your own. The home also includes an additional small bonus room that can be utilized as a small bedroom, office, or extra storage space to fit your needs. Outside, you’ll f
Key facts
- Spacious kitchen
- 2 garage spots
- Built 1964
Tags
Property features AI
Finance
- Other: Living area per public records; Lot features: over 40 units per acre
- HOA & community: Land lease community (Orange Ave Mobilhome Park) with manager approval required; Land lease $1,300 per month; rent includes water and trash
Exterior
- Parking: Two assigned garage spaces; Two uncovered parking spaces (four total)
- Utilities: Public sewer; Public/district water
- Home design: Single-story mobile home (model ABI9978); Entry on the first level; Mobile home remains on site
- Construction: Mobile home 12 ft by 60 ft
- Exterior features: No pool; Street lighting in the community
Interior
- Kitchen: Formica counters
- Bathrooms: One full bathroom with shower and low-flow fixtures
- Interior features: Open floor plan; Storage space; Blinds
- Laundry & utility: Indoor laundry area
Neighborhood map
What this means for you Summary
Snapshot
- This is a 3-bed/1.0-bath manufactured listed at $139k. Condition is rated fair.
Deal economics
- At list price, monthly cash flow is $1k ($16k/yr) — positive.
- The deal already cash-flows at list — no discount required.
- Meets the 1% rule at list price ($3k rent vs $139k).
- Recommended offer: $137k (1.5% below list) — sets the bar for market timing.
- Cap rate 17.7% vs local median 3.2% in Paramount — top-decile yield for the area; either an underpriced asset or a hidden risk that comps aren't pricing in. Stress-test before assuming the spread holds.
Location & tenants
- Location reads 64/100 on livability (#432 in CA) — a middle-class / working-renter tenant base. Strengths: commute A+; Watch: schools D, crime F, amenities F.
- Paramount Unified (suburban): math 15% / reading 34% proficiency, ranked #416 of 517 in CA (top 80%) — low school quality limits family demand, transient renter base, plan for 1-2y turnover; 76% free/reduced lunch — lower-income household profile, screen leases tightly.
- Market conditions: Rents soft (-1.0%/yr); 51 active listings in the ZIP; 2 comparable units currently listed for rent nearby; solid renter incomes; 19,697 units permitted in Los Angeles County in 2024 (9,426 in 5+ unit buildings).
- At $2,887/mo this rent would consume 46% of the median local household income ($75k/yr) (locally 2420% of renters already pay >50% of income on rent) — very limited rent-growth headroom before tenants either downsize or default.
Forward outlook
- Local home prices are declining (-3.0%/yr); year-one equity from $961 of loan paydown is wiped out by about $4k of value loss. Plan a longer hold.
- Los Angeles County population projected at +9% by 2050 — modest demand growth; plan on rents tracking national, not racing it.
- At projected returns (-3.0% appreciation + 0.0% rent growth), your $39k cash investment doubles in ~4 years — after that, you're playing with house money.
Negotiation context
- It's been on market 28 days — a 2% lower offer ($137k) is reasonable based on typical stale-listing flexibility.
Risks & watch-outs
- Climate carrying-cost: moderate flood risk; extreme-heat days projected 7→21/yr by 2055 (HVAC capex compounding) — expect insurance premiums to compound above CPI over the hold.
Questions for the listing agent
- Have any recent inspections been done? Can we get a copy of the seller's disclosures and any deferred-maintenance estimates?
- Built in 1964 — when were the roof, HVAC, electrical panel, plumbing, and water heater last replaced?
- Is there a deadline driving the sale (1031 exchange, divorce, estate, relocation)? That informs how much negotiation room exists.
- Schools are D-rated, which usually means shorter tenancies and higher turnover. Who's the typical renter profile here, and what's been the actual vacancy rate?
- Crime grade is F in this area — have there been break-ins, vandalism, or insurance claims at this property in the last 3 years? What carrier currently insures it and at what premium?
- What's the average days-on-market for RENTAL listings here right now (not sales)? A rising rental-DOM trend means longer vacancies and softer asking-rent achievability than the comps imply.
- What's the recent tenant-quality profile in this submarket — average credit score on applications, eviction rate, late-payment / NSF rate, and stable-employment percentage? A property-management company in the area should have these aggregated.
- How much new for-sale + rental construction is in the pipeline within 1–3 miles? Heavy new supply typically softens prices + rents 12–24 months out; constrained supply supports both.
Investment metrics
- 1% rule
- 2.08% ✓
- Cap rate
- 17.69%
- Cash-on-cash
- 40.70%
- DSCR
- 2.81
- GRM
- 4.0
CMA / ARV
- ARV (on-the-fly)
- $153,360
- Comps found
- 1
Show comp detail 1 sale within ~0.75 mi
| Address | Dist | Beds/Ba | Sqft | Sold | Price | $/sf | Match |
|---|---|---|---|---|---|---|---|
| 15325 Orange Ave Unit F16 | 0.01mi | 2/2.0 (-1) | 800 (+11%) | 9mo | $170,000 | $213 | 65 |
Match score weights: distance 35% · size 25% · config 20% · recency 20%. Top-matched comps best support the ARV.
Projected returns pro-forma
-3.0% appreciation · 0.0% rent growth · sell at horizon
- IRR
- 33.7%
- Equity multiple
- 2.36×
- Total profit
- $53,126
- Equity at exit
- $20,725
- IRR
- 39.0%
- Equity multiple
- 4.13×
- Total profit
- $121,992
- Equity at exit
- $12,018
Cash invested: $38,920 (down + closing). Projections, not guarantees.
Landlord ↔ Tenant lean methodology
- Overall (STATE)
- 18 Strongly Tenant-Friendly
- State California
- 18 Strongly Tenant-Friendly · D+13
- County
- — inherits STATE
- City
- — inherits STATE
ZIP-level market 90723
- Rents YoY
- -1.0%
- Active inventory
- 51
- Price-to-rent
- 4.0×
Monthly cashflow live
- Estimated rent
- $2,887 medium interval (Pro) →
- Mortgage (P&I)
- −$729
- Tax est. 1.5%
- −$174 /mo · $2,085/yr
- Insurance
- −$58
- HOA
- −$0
- Vacancy / Maint / Mgmt
- −$606
- Net cashflow
- $1,320
Break-even live
UW: 25.0% down · 7.5% · 30yr · 1.5% tax · 5.0% vac · 8.0% maint · 8.0% mgmt
Financing live
Cash to close
- Down payment
- $34,750
- Closing costs
- $4,170
- Reserves months
- —
- Total cash needed
- —
Loan-product check · same deal, 3 products live
Conventional
25% down · 7.5% · 30yr
- Down + closing
- —
- Monthly P&I
- —
- Monthly cashflow
- —
- DSCR
- —
- Eligible?
- —
Personal DTI + credit; lowest rate.
DSCR
20% down · 8.5% · 30yr
- Down + closing
- —
- Monthly P&I
- —
- Monthly cashflow
- —
- DSCR
- —
- Eligible?
- —
No personal income docs; deal must DSCR.
Hard money
10% down · 12.0% · 12mo
- Down + closing
- —
- Monthly P&I
- —
- Monthly cashflow
- —
- DSCR
- —
- Eligible?
- —
Short-term bridge; refi at stabilization.
Rent comps 2 comps
| Address | Beds | Baths | Sqft | Rent | $/sqft | DOM | Units | Dist |
|---|---|---|---|---|---|---|---|---|
| 7029 Orange Ave Long Beach, CA | 2.0 | 1.0 | 700 | $2,519 | $3.60 | 43d | 1 | 0.79mi |
| 15327 S Butler Ave Compton, CA | 2.0 | 1.0 | 716 | $2,875 | $4.02 | 2d | 1 | 1.12mi |
Listing history 15 events
-
2026-06-18days on market $139,000 Active 28 DOM
-
2026-06-17days on market $139,000 Active 27 DOM
-
2026-06-16days on market $139,000 Active 26 DOM
-
2026-06-15days on market $139,000 Active 25 DOM
-
2026-06-13days on market $139,000 Active 23 DOM
-
2026-06-13days on market $139,000 Active 22 DOM
-
2026-06-09days on market $139,000 Active 19 DOM
-
2026-06-08days on market $139,000 Active 18 DOM
-
2026-06-07days on market $139,000 Active 17 DOM
-
2026-06-04days on market $139,000 Active 14 DOM
-
2026-06-03days on market $139,000 Active 13 DOM
-
2026-06-02days on market $139,000 Active 12 DOM
-
2026-06-01days on market $139,000 Active 11 DOM
-
2026-05-31days on market $139,000 Active 10 DOM
-
2026-05-21$139,000 Active
ⓘ Source: listings_history table (triggers on properties + properties_extension) + one-shot
backfill from property_details.listing_events for pre-trigger history.
Climate risk First Street
- Flood 5/10 Major FEMA zone X · 24% chance over 30 yrs
- Wildfire 1/10 Low
- Heat 5/10 Major 7 d/yr ≥90°F today · 21 d/yr by 30 yrs out
- Wind 1/10 Low
- Air quality 6/10 Major 10 unhealthy d/yr today · 10 by 30 yrs out
Nearby sold comps map
Loading sold comps map…
Walkable amenities ~0.75 mi
Loading nearby amenities…
Taxation est. · year 1
- Rental income
- $34,641
- − Mortgage interest
- −$7,786
- − Property taxes
- −$2,085
- − Insurance
- −$695
- − Repairs & maintenance
- −$2,771
- − Management
- −$2,771
- − Depreciation
- −$4,044
- Taxable income
- $14,488
- Est. tax owed @ 24.0%
- −$3,477
- After-tax cash flow
- $12,362/yr
For passive investors: Depreciation is non-cash, so a rental often shows a tax loss while cash-flowing — sheltering income. Rental losses are passive: they offset passive income freely, and up to $25,000/yr can offset ordinary (W-2) income if you actively participate and your MAGI is under $100k (phasing out to $0 by $150k); unused losses carry forward. On sale, claimed depreciation is recaptured at up to 25%, and gains may owe capital-gains tax (a 1031 exchange can defer both). Figures are a year-1 estimate at your 24.0% rate — not tax advice; consult a CPA.
Condition & rehab AI · 1 photo
This manufactured home requires significant repairs and maintenance to improve its condition and value. Potential buyers should be aware of the extensive work needed to bring it up to current standards.
Repairs flagged
- Major siding — Significant wear and tear
- Major roof — Age suggests potential leaks
- Major flooring — Age suggests wear and tear
- Major interior walls/paint — Age suggests wear and tear
- Major windows — Age suggests potential issues
- Major foundation/structure — Age suggests potential issues
- Major HVAC/mechanicals — Age suggests potential issues
- Major landscaping — Overgrown vegetation
Value-add opportunities
- Both paint exterior and interior — Fresh paint enhances curb appeal and interior aesthetics
- Both repair and replace siding — New siding improves curb appeal and structural integrity
- Both repair and replace roof — New roof prevents leaks and extends home life
- Both repair and replace flooring — New flooring improves comfort and aesthetics
- Both repair and replace windows — New windows improve energy efficiency and curb appeal
- Both repair and replace HVAC/mechanicals — New HVAC improves comfort and energy efficiency
- Both landscaping and curb appeal — Trimmed landscaping enhances curb appeal and property value
Renovation cost estimate screening
| Repair item | Severity | Est. cost |
|---|---|---|
| siding · Significant wear and tear | Major | $15,000–50,000 |
| roof · Age suggests potential leaks | Major | $15,000–50,000 |
| flooring · Age suggests wear and tear | Major | $15,000–50,000 |
| interior walls/paint · Age suggests wear and tear | Major | $15,000–50,000 |
| windows · Age suggests potential issues | Major | $15,000–50,000 |
| foundation/structure · Age suggests potential issues | Major | $15,000–50,000 |
| HVAC/mechanicals · Age suggests potential issues | Major | $15,000–50,000 |
| landscaping · Overgrown vegetation | Major | $15,000–50,000 |
| Total estimated repair cost · 8 items | $120,000–400,000 |
Value-add ROI direction
- Both paint exterior and interior — Fresh paint enhances curb appeal and interior aesthetics ↑
- Both repair and replace siding — New siding improves curb appeal and structural integrity ↑
- Both repair and replace roof — New roof prevents leaks and extends home life ↑
- Both repair and replace flooring — New flooring improves comfort and aesthetics ↑
- Both repair and replace windows — New windows improve energy efficiency and curb appeal ↑
- Both repair and replace HVAC/mechanicals — New HVAC improves comfort and energy efficiency ↑
- Both landscaping and curb appeal — Trimmed landscaping enhances curb appeal and property value ↑
ⓘ Cost ranges are severity-bucket heuristics (US national rule-of-thumb). Get contractor quotes + a written scope before underwriting a rehab budget.
Schools (NCES district)
- District
- Paramount Unified
- NCES district ID
- 0629850
- Math proficiency
- 15% ▼ -14.00%
- Reading proficiency
- 34% ▼ -7.00%
- Median HH income
- $46,631
- Composite
- 21.25/100
- National rank
- #8398
- State rank
- #416 of 517 in CA
Livability — Paramount
- Score
- 64/100
- State rank
- #432
- US rank
- #14664
Category grades
Schools grade is shown separately in the Schools card above.
Census & demographics
- Census place
- Paramount, CA
- County
- Los Angeles County · 9,444,647 people
- City population
- 52,050
- Metro
- Los Angeles-Long Beach-Anaheim, CA
- Population (ZIP)
- 52,050
- Household income
- $75,250
- Rent vs Own
- Severe rent burden
- 2420.0
Population outlook (Los Angeles County) Hauer SSP2
- Today (2025)
- 10,940,515 people
- By 2030
- 11,256,481 · +2.9%
- By 2040
- 11,729,929 · +7.2%
- By 2050
- 11,948,407 · +9.2%
- By 2075
- 11,818,114 · +8.0%
- By 2100
- 10,842,928 · -0.9%
Race, ethnicity, and origin ACS 2023
- Neighborhood character
- Predominantly Hispanic (82%)
- Race & ethnicity
- Hispanic / Latino 82% Two or more races 26% Black 9% White 4% Asian 3% Native American 2%
- Hispanic origin (detail)
- Mexican 71%
- Foreign-born
- 36% · Canada
- Languages at home
- 29% English-only · Spanish 67% Tagalog/Filipino 1% Other Asian/Pacific 1%
Political lean MEDSL · Los Angeles
- 2024 margin
- Solid D (+32.9) · D 64.8% · R 31.9% · Other 3.3%
- 2008→2024 swing
- -7.4pp toward R · 2008: 40.4pp · 2024: 32.9pp
- All cycles
- 2024: D+32.9 2020: D+44.2 2016: D+48.0 2012: D+40.0 2008: D+40.4
Not yet ingested
- Civics
- —
Market trends
- HPI YoY
- ▼ -459.80%
- Current HPI
- 478.1981
- Rent YoY
- ▼ -0.99%
- Metro
- Los Angeles-Long Beach-Anaheim, CA
- State GDP YoY
- ▲ 3.21%
- F500 in state
- 116
Industry mix (Fortune 500 HQ in CA)
| Industry | F500 HQs | Revenue |
|---|---|---|
| Technology | 27 | $1,492B |
|
||
| Financial Services | 3 | $174B |
|
||
| Retail | 3 | $44B |
|
||
| Insurance | 3 | $26B |
|
||
| Media / Entertainment | 2 | $115B |
|
||
| Pharmaceuticals / Biotech | 2 | $62B |
|
||
Price history
1 event — show timeline
- 2026-05-21 Listed $139,000 CRMLS
Cash-flow waterfall
monthlySold comps — $/sqft
last 12 mo · ≤1 miLoading sold comps…