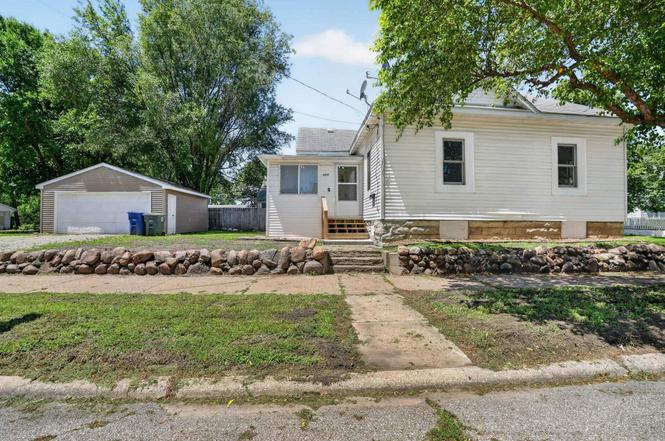
499 Columbia St · Waterloo, IA
Flood risk 4/10 · Minor
- FEMA flood zone
- X
- Chance of flooding over 30 yrs
- 0.22%
- Est. flood insurance / yr
- $473 – $860
Fire risk 1/10 · Minimal
- Est. fire insurance / yr
- $902 – $1,676
Heat risk 3/10 · Minor
- Hot days now (above 101°F)
- 7 days/yr
- Hot days in 30 yrs
- 16 days/yr
Wind risk 2/10 · Minimal
- Chance of severe wind over 30 yrs
- —
Air-quality risk 1/10 · Minimal
- Unhealthy air days now
- 0 days/yr
- Unhealthy air days in 30 yrs
- 0 days/yr
Risk factors via First Street. Map © Google.
Why this score? — see what drove the D grade
The composite is a weighted blend of 9 inputs, each scored 0–100. Each bar is that input's sub-score; the figure is the points it added to the 100-point composite (weight × sub-score).
- Cash flow +18.6/30.0
- DSCR +5.8/10.0
- 1% rule +4.4/10.0
- Schools +4.4/10.0
- Rent growth +4.2/5.0
- Livability +4.0/5.0
- Condition / age +2.5/5.0
- ARV discount +0.0/15.0
- Appreciation +0.0/10.0
$99,900
🖨 Deal sheet 📄 Offer letter ✓ Due diligence
Listing remarks
Whether you're searching for your first home or looking to add another property to your investment portfolio, this one is worth a look. Inside, you'll find a spacious kitchen with plenty of cabinet and counter space, making meal prep or tackling your weekly grocery haul a whole lot easier. The eat in kitchen flows into the large living room, creating an open and comfortable space for everyday living. Fresh paint and updated flooring throughout give the home a clean, move in ready feel. Two generously sized bedrooms connect to the full bathroom, complete with a clawfoot tub that adds a touch of character. Main floor laundry adds extra convenience, while the oversized basement provides plenty
Key facts
- Spacious kitchen
- Eat in kitchen
- Main floor laundry
Tags
Property features AI
Exterior
- Parking: Detached carport with 2 spaces
- Utilities: Public water; Public sewer
- Home design: Single-family residential
- Construction: Vinyl siding construction
- Exterior features: Asphalt shingle roof; Vinyl siding; Gravel road access
Interior
- Bathrooms: 1 full bathroom
- Heating & cooling: Forced air heating (natural gas); No central cooling
- Interior features: Gas water heater; Unfinished basement
- Laundry & utility: Main level laundry room
Neighborhood map
What this means for you Summary
Snapshot
- This is a 2-bed/1.0-bath single-family listed at $100k.
Deal economics
- At list price, monthly cash flow is $97 ($1k/yr) — positive.
- The deal already cash-flows at list — no discount required.
- To meet the 1% rule (rent ≥ 1% of price), the offer needs to be $94k (6.0% below list).
- Recommended offer: $94k (6.0% below list) — sets the bar for 1% rule.
- Cap rate 7.5% vs local median 4.2% in Waterloo — top-decile yield for the area; either an underpriced asset or a hidden risk that comps aren't pricing in. Stress-test before assuming the spread holds.
Location & tenants
- Location reads 81/100 on livability (#74 in IA, #1,589 nationally) — a professional / high-income tenant draw. Strengths: commute A+, cost of living A+, housing A+; Watch: crime F, employment D-.
- Waterloo Community School District (urban): math 50% / reading 54% proficiency, ranked #276 of 289 in IA (top 96%) — acceptable for families but not a draw, mixed tenant base, ~2y average lease.
- Zoned schools: Fred Becker Elementary School (math 57% / reading 47%, grade C-, #494 of 616 statewide, top 83%, 473 students, 76% FRL); Central Middle School (math 49% / reading 46%, grade C-, #226 of 246 statewide, top 92%, 471 students, 85% FRL); East High School (math 39% / reading 58%, grade D, #317 of 336 statewide, top 94%, 1,022 students, 73% FRL) — zoned schools average 78% FRL vs 58% district-wide (20 pts higher); higher-poverty schools than district average — tighter screening recommended.
- Market conditions: Rents rising fast (+6.7%/yr); 98 active listings in the ZIP; 37 comparable units currently listed for rent nearby; rentals lingering (median 44d on market — plan ~5-8 weeks vacancy on turnover, expect pricing pressure); 57% of comp listings sitting > 30 days — soft ceiling on asking rent; 287 units permitted in Black Hawk County in 2024 (67 in 5+ unit buildings).
Forward outlook
- Local home prices are declining (-3.0%/yr); year-one equity from $691 of loan paydown is wiped out by about $3k of value loss. Plan a longer hold.
- Black Hawk County population projected at +10% by 2050 — modest demand growth; plan on rents tracking national, not racing it.
Negotiation context
- Only 4 days on market — expect competitive offers; lowballing is unlikely to land.
- Current owner paid $28k; list at $100k implies a 251% gain — meaningful room to come down on a strong offer.
Risks & watch-outs
- Watch-outs: built in 1899 — expect roof / HVAC / electrical / plumbing capex.
Questions for the listing agent
- Built in 1899 — when were the roof, HVAC, electrical panel, plumbing, and water heater last replaced?
- Is there a deadline driving the sale (1031 exchange, divorce, estate, relocation)? That informs how much negotiation room exists.
- Crime grade is F in this area — have there been break-ins, vandalism, or insurance claims at this property in the last 3 years? What carrier currently insures it and at what premium?
- The area grade is low — what's the realistic commute time and amenity access for the typical tenant pool here? Any planned neighborhood developments (good or bad) we should know about?
- What's the average days-on-market for RENTAL listings here right now (not sales)? A rising rental-DOM trend means longer vacancies and softer asking-rent achievability than the comps imply.
- What's the recent tenant-quality profile in this submarket — average credit score on applications, eviction rate, late-payment / NSF rate, and stable-employment percentage? A property-management company in the area should have these aggregated.
- How much new for-sale + rental construction is in the pipeline within 1–3 miles? Heavy new supply typically softens prices + rents 12–24 months out; constrained supply supports both.
Investment metrics
- 1% rule
- 0.94% ✗
- Cap rate
- 7.45%
- Cash-on-cash
- 4.15%
- DSCR
- 1.18
- GRM
- 8.9
CMA / ARV
- ARV (on-the-fly)
- $72,864
- Comps found
- 12
Show comp detail 12 sales within ~0.75 mi
| Address | Dist | Beds/Ba | Sqft | Sold | Price | $/sf | Match |
|---|---|---|---|---|---|---|---|
| 232 Center St | 0.13mi | 2/1.0 | 1,060 (-4%) | 1mo | $32,000 | $30 | 86 |
| 413 Conger Street St | 0.13mi | 3/1.0 (+1) | 1,149 (+4%) | 4mo | $65,000 | $57 | 79 |
| 817 Grandview Ave | 0.46mi | 3/1.0 (+1) | 1,115 (+1%) | 3mo | $115,000 | $103 | 69 |
| 545 W Parker St St | 0.49mi | 3/1.0 (+1) | 1,090 (-1%) | 7mo | $71,500 | $66 | 64 |
| 542 Kern St | 0.40mi | 3/1.0 (+1) | 1,052 (-5%) | 6mo | $35,000 | $33 | 63 |
| 806 Conger St St | 0.54mi | 3/1.0 (+1) | 1,140 (+3%) | 2mo | $85,000 | $75 | 63 |
| 426 Saxon St | 0.48mi | 2/1.0 | 1,072 (-3%) | 12mo | $65,000 | $61 | 63 |
| 1030 Columbia St | 0.42mi | 3/1.0 (+1) | 1,050 (-5%) | 8mo | $124,900 | $119 | 60 |
| 926 Lincoln St | 0.34mi | 1/1.0 (-1) | 956 (-13%) | 8mo | $39,000 | $41 | 50 |
| 126 Hope Avenue Ave | 0.61mi | 3/1.0 (+1) | 1,185 (+7%) | 6mo | $56,000 | $47 | 49 |
| 233 Oliver St | 0.73mi | 3/1.0 (+1) | 1,006 (-9%) | 1mo | $125,000 | $124 | 45 |
| 324 Sumner St | 0.74mi | 3/1.0 (+1) | 1,011 (-8%) | 2mo | $66,500 | $66 | 45 |
Match score weights: distance 35% · size 25% · config 20% · recency 20%. Top-matched comps best support the ARV.
Projected returns pro-forma
-3.0% appreciation · 6.67% rent growth · sell at horizon
- IRR
- -6.0%
- Equity multiple
- 0.77×
- Total profit
- $-6,450
- Equity at exit
- $14,895
- IRR
- 7.4%
- Equity multiple
- 1.65×
- Total profit
- $18,163
- Equity at exit
- $8,638
Cash invested: $27,972 (down + closing). Projections, not guarantees.
Landlord ↔ Tenant lean methodology
- Overall (STATE)
- 83 Strongly Landlord-Friendly
- State Iowa
- 83 Strongly Landlord-Friendly · R+6
- County
- — inherits STATE
- City
- — inherits STATE
ZIP-level market 50703
- Rents YoY
- 6.7%
- Active inventory
- 98
- Price-to-rent
- 8.9×
Monthly cashflow live
- Estimated rent
- $939 high interval (Pro) →
- Mortgage (P&I)
- −$524
- Tax from tax record
- −$79 /mo · $952/yr
- Insurance
- −$42
- HOA
- −$0
- Vacancy / Maint / Mgmt
- −$197
- Net cashflow
- $97
Break-even live
UW: 25.0% down · 7.5% · 30yr · 1.5% tax · 5.0% vac · 8.0% maint · 8.0% mgmt
Financing live
Cash to close
- Down payment
- $24,975
- Closing costs
- $2,997
- Reserves months
- —
- Total cash needed
- —
Loan-product check · same deal, 3 products live
Conventional
25% down · 7.5% · 30yr
- Down + closing
- —
- Monthly P&I
- —
- Monthly cashflow
- —
- DSCR
- —
- Eligible?
- —
Personal DTI + credit; lowest rate.
DSCR
20% down · 8.5% · 30yr
- Down + closing
- —
- Monthly P&I
- —
- Monthly cashflow
- —
- DSCR
- —
- Eligible?
- —
No personal income docs; deal must DSCR.
Hard money
10% down · 12.0% · 12mo
- Down + closing
- —
- Monthly P&I
- —
- Monthly cashflow
- —
- DSCR
- —
- Eligible?
- —
Short-term bridge; refi at stabilization.
Rent comps 37 comps
| Address | Beds | Baths | Sqft | Rent | $/sqft | DOM | Units | Dist |
|---|---|---|---|---|---|---|---|---|
| 214 Edwards St Waterloo, IA | 3.0 | 1.0 | 1150 | $825 | $0.72 | 20d | 1 | 0.14mi |
| 314 Conger St Waterloo, IA | 2.0 | 1.0 | 840 | $875 | $1.04 | 43d | 1 | 0.17mi |
| 203 Reed St Waterloo, IA | 3.0 | 1.5 | 1492 | $1,200 | $0.80 | 20d | 1 | 0.32mi |
| 661 Dawson St Waterloo, IA | 2.0 | 1.0 | 704 | $895 | $1.27 | 20d | 1 | 0.45mi |
| 401 Argyle St Waterloo, IA | 2.0 | 1.0 | 800 | $800 | $1.00 | 43d | 1 | 0.47mi |
| 1125 Ackermant St Waterloo, IA | 3.0 | 2.0 | 1202 | $1,100 | $0.92 | 20d | 1 | 0.52mi |
| 1148 Columbia St Waterloo, IA | 2.0 | 1.0 | 816 | $850 | $1.04 | 43d | 1 | 0.56mi |
| 311 E 3rd St Waterloo, IA | 2.0 | 2.0 | 1154 | $1,500 | $1.30 | 20d | 1 | 0.70mi |
| 306 Charles St Waterloo, IA | 3.0 | 1.0 | 916 | $925 | $1.01 | 43d | 1 | 0.79mi |
| 45 W Jefferson St Waterloo, IA | 1.0–2.0 | 1.0–2.0 | 1062 | $1,750 | $1.65 | 20d | 9 | 0.83mi |
| 520 Lafayette St Unit A Waterloo, IA | 2.0 | 1.0 | 800 | $750 | $0.94 | 43d | 1 | 0.84mi |
| 21 W Jefferson St Waterloo, IA | 1.0 | 1.0 | 711 | $1,410 | $1.98 | 20d | 6 | 0.86mi |
| 401 Charles St Waterloo, IA | 3.0 | 1.0 | 1276 | $995 | $0.78 | 43d | 1 | 0.86mi |
| 302 Commercial St Waterloo, IA | 1.0 | 1.0 | 901 | $1,100 | $1.22 | 20d | 1 | 0.91mi |
| W Mullan Ave Waterloo, IA | 2.0 | 1.0 | 918 | $710 | $0.77 | 43d | 2 | 0.98mi |
| 1124 Kern St Waterloo, IA | 2.0 | 1.0 | 740 | $950 | $1.28 | 43d | 1 | 0.99mi |
| 613 Hope Ave Waterloo, IA | 2.0 | 1.0 | 812 | $795 | $0.98 | 43d | 1 | 1.04mi |
| 910 Mulberry St Apt 3 Waterloo, IA | 2.0 | 1.0 | 1064 | $695 | $0.65 | 20d | 1 | 1.07mi |
| 223 W 4th St Ste 203 Waterloo, IA | 2.0 | 1.5 | 1466 | $1,250 | $0.85 | 43d | 1 | 1.09mi |
| 824 Sycamore St Unit 824-09 Waterloo, IA | 2.0 | 2.0 | 1054 | $1,250 | $1.19 | 43d | 1 | 1.09mi |
| 218 South St Unit 5 Waterloo, IA | 1.0 | 1.0 | 800 | $545 | $0.68 | 43d | 1 | 1.11mi |
| 405 W Donald St Waterloo, IA | 2.0–3.0 | 1.0 | 880 | $900 | $1.02 | 20d | 4 | 1.14mi |
| 920-928 Sycamore St Unit 920-07 Waterloo, IA | 2.0 | 2.0 | 1054 | $1,250 | $1.19 | 43d | 1 | 1.14mi |
| 924 Sycamore St #1 Waterloo, IA | 2.0 | 2.0 | 1054 | $1,250 | $1.19 | 43d | 1 | 1.15mi |
| 626 W 2nd St Unit 1 Waterloo, IA | 1.0 | 1.0 | 857 | $750 | $0.88 | 20d | 1 | 1.16mi |
| 1107 Mulberry St Waterloo, IA | 3.0 | 1.0 | 1248 | $950 | $0.76 | 20d | 1 | 1.21mi |
| 739 Sherman Ave Waterloo, IA | 3.0 | 1.0 | 875 | $925 | $1.06 | 43d | 1 | 1.22mi |
| 919 Oneida St Waterloo, IA | 3.0 | 1.0 | 1144 | $930 | $0.81 | 43d | 1 | 1.23mi |
| 425 Glenwood St Waterloo, IA | 2.0 | 1.0 | 846 | $825 | $0.98 | 20d | 1 | 1.23mi |
| 416 Sunnyside Ave Waterloo, IA | 3.0 | 1.0 | 1200 | $825 | $0.69 | 43d | 1 | 1.25mi |
| 418 Sunnyside Ave Waterloo, IA | 3.0 | 1.0 | 1200 | $675 | $0.56 | 43d | 1 | 1.25mi |
| 820 W 2nd St Apt 2 Waterloo, IA | 2.0 | 1.5 | 1100 | $695 | $0.63 | 43d | 1 | 1.29mi |
| 1254 W Mullan Ave Unit 1254 Waterloo, IA | 2.0 | 1.0 | 864 | $775 | $0.90 | 20d | 1 | 1.29mi |
| 706 South St Waterloo, IA | 2.0 | 1.0 | 750 | $675 | $0.90 | 43d | 1 | 1.32mi |
| 706 South St Unit B Waterloo, IA | 2.0 | 1.0 | 750 | $635 | $0.85 | 20d | 1 | 1.32mi |
| 1272 W Mullan Ave Unit 1272 Waterloo, IA | 2.0 | 1.0 | 864 | $825 | $0.95 | 20d | 1 | 1.33mi |
| 136 Janney Ave Waterloo, IA | 2.0 | 2.0 | 901 | $1,325 | $1.47 | 43d | 1 | 1.43mi |
Listing history 5 events
-
2026-06-19days on market $99,900 Active 4 DOM
-
2026-06-18days on market $99,900 Active 3 DOM
-
2026-06-17days on market $99,900 Active 2 DOM
-
2026-06-15remarks 699-char remark
-
2026-06-15$99,900 Active 1 DOM
ⓘ Source: listings_history table (triggers on properties + properties_extension) + one-shot
backfill from property_details.listing_events for pre-trigger history.
Tax reassessment forecast IA · Partial reset (capped growth)
- Current annual tax
- $952 · $79/mo
- Projected year-2 tax
- $1,260 · $105/mo
- Expected delta
- +$308/yr (+$26/mo · 32.4%)
ⓘ Screening estimate from a state-policy table — verify with the county assessor before closing.
Climate risk First Street
- Flood 4/10 Moderate FEMA zone X · 22% chance over 30 yrs
- Wildfire 1/10 Low
- Heat 3/10 Moderate 7 d/yr ≥101°F today · 16 d/yr by 30 yrs out
- Wind 2/10 Low
- Air quality 1/10 Low 0 unhealthy d/yr today · 0 by 30 yrs out
Nearby sold comps map
Loading sold comps map…
Walkable amenities ~0.75 mi
Loading nearby amenities…
Taxation est. · year 1
- Rental income
- $11,264
- − Mortgage interest
- −$5,596
- − Property taxes
- −$952
- − Insurance
- −$500
- − Repairs & maintenance
- −$901
- − Management
- −$901
- − Depreciation
- −$2,906
- Taxable loss
- −$492
- Est. tax savings @ 24.0%
- +$118
- After-tax cash flow
- $1,278/yr
For passive investors: Depreciation is non-cash, so a rental often shows a tax loss while cash-flowing — sheltering income. Rental losses are passive: they offset passive income freely, and up to $25,000/yr can offset ordinary (W-2) income if you actively participate and your MAGI is under $100k (phasing out to $0 by $150k); unused losses carry forward. On sale, claimed depreciation is recaptured at up to 25%, and gains may owe capital-gains tax (a 1031 exchange can defer both). Figures are a year-1 estimate at your 24.0% rate — not tax advice; consult a CPA.
Schools (NCES district)
- District
- Waterloo Community School District
- NCES district ID
- 1930480
- Math proficiency
- 50% ▼ -4.00%
- Reading proficiency
- 54% ▲ 1.00%
- Median HH income
- $42,545
- Composite
- 43.72/100
- National rank
- #2950
- State rank
- #276 of 289 in IA
Livability — Waterloo
- Score
- 81/100
- State rank
- #74
- US rank
- #1589
Category grades
Schools grade is shown separately in the Schools card above.
Census & demographics
- Census place
- Waterloo, IA
- County
- Black Hawk County · 112,933 people
- City population
- 69,066
- Metro
- Waterloo-Cedar Falls, IA
- Population (ZIP)
- 17,952
- Household income
- $50,060
- Rent vs Own
- Severe rent burden
- 871.0
Population outlook (Black Hawk County) Hauer SSP2
- Today (2025)
- 139,716 people
- By 2030
- 142,853 · +2.2%
- By 2040
- 147,843 · +5.8%
- By 2050
- 153,247 · +9.7%
- By 2075
- 167,977 · +20.2%
- By 2100
- 177,320 · +26.9%
Race, ethnicity, and origin ACS 2023
- Neighborhood character
- Diverse neighborhood (Simpson 0.62)
- Race & ethnicity
- White 55% Black 26% Hispanic / Latino 10% Two or more races 7% Asian 2%
- Hispanic origin (detail)
- Mexican 6%
- Common ancestry
- Iranian 1% Portuguese 1% Lithuanian 1%
- Foreign-born
- 7% · Canada, Philippines, China
- Languages at home
- 89% English-only · Spanish 7% Other Asian/Pacific 2% Russian/Polish/Slavic 1%
Political lean MEDSL · Black Hawk
- 2024 margin
- Toss-up / Even · D 50.0% · R 48.8% · Other 1.2%
- 2008→2024 swing
- -21.3pp toward R · 2008: 22.4pp · 2024: 1.2pp
- All cycles
- 2024: D+1.2 2020: D+9.0 2016: D+7.3 2012: D+20.0 2008: D+22.4
Not yet ingested
- Civics
- —
Market trends
- HPI YoY
- ▼ -117.18%
- Current HPI
- 132.9478
- Rent YoY
- ▲ 6.67%
- Metro
- Waterloo-Cedar Falls, IA
- State GDP YoY
- ▲ 2.48%
- F500 in state
- 4
Industry mix (Fortune 500 HQ in IA)
| Industry | F500 HQs | Revenue |
|---|---|---|
| Financial Services | 1 | $16B |
|
||
| Retail / Convenience | 1 | $15B |
|
||
Price history
+250.5% since first listed2 events — show timeline
- 2026-06-15 Listed $99,900 NEIRBR as distributed by MLS GRID
- 2011-04-25 Sold (Public Records) $28,500 Public Records
Property tax history
-0.4%/yrLatest (2025): $952 · +8.4% YoY. Source: county tax records.
Cash-flow waterfall
monthlySold comps — $/sqft
last 12 mo · ≤1 miLoading sold comps…