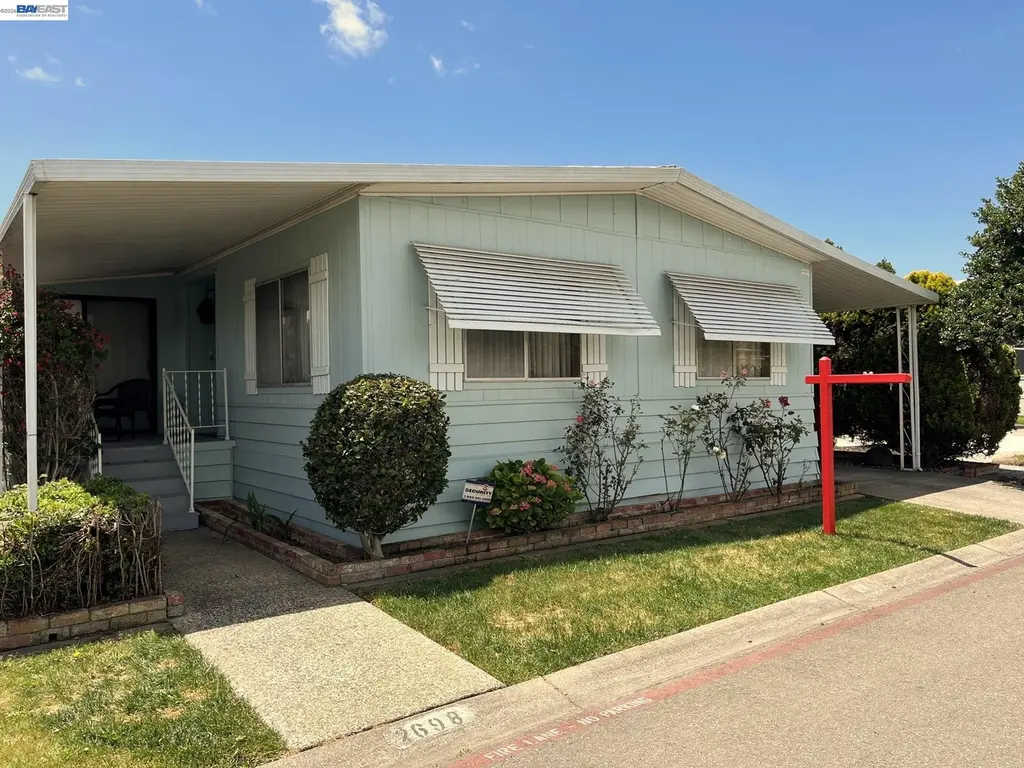
2698 Pueblo Crk · Hayward, CA
Flood risk 5/10 · Moderate
- FEMA flood zone
- X (unshaded)
- Chance of flooding over 30 yrs
- 0.52%
- Est. flood insurance / yr
- $507 – $1,088
Fire risk 1/10 · Minimal
- Est. fire insurance / yr
- $659 – $1,223
Heat risk 4/10 · Minor
- Hot days now (above 89°F)
- 7 days/yr
- Hot days in 30 yrs
- 14 days/yr
Wind risk 1/10 · Minimal
- Chance of severe wind over 30 yrs
- —
Air-quality risk 7/10 · Major
- Unhealthy air days now
- 12 days/yr
- Unhealthy air days in 30 yrs
- 12 days/yr
Risk factors via First Street. Map © Google.
Why this score? — see what drove the B- grade
The composite is a weighted blend of 9 inputs, each scored 0–100. Each bar is that input's sub-score; the figure is the points it added to the 100-point composite (weight × sub-score).
- Cash flow +25.6/30.0
- ARV discount +15.0/15.0
- DSCR +8.5/10.0
- 1% rule +6.7/10.0
- Livability +3.8/5.0
- Rent growth +3.2/5.0
- Schools +3.1/10.0
- Condition / age +2.2/5.0
- Appreciation +0.0/10.0
$279,900
🖨 Deal sheet 📄 Offer letter ✓ Due diligence
Listing remarks
Rarely available 3-bedroom, 2-bath home offering a warm and welcoming feel with comfortable living spaces throughout. Enjoy both a spacious living room and separate family room, perfect for relaxing evenings or gathering with family and friends. The galley-style kitchen features a cozy breakfast nook, while laminate flooring flows through the kitchen, dining, and family room areas for easy everyday living. The generously sized primary suite creates a peaceful retreat with double sinks, a soaking tub, and separate stall shower. Two additional bedrooms offer flexible space for guests, family, or a home office, complemented by a hall bath with tub/shower combination. Additional highlights incl
Key facts
- Breakfast nook
- Usable yard space
- Front porch
Tags
Property features AI
Finance
- HOA & community: Park allows pets with number and size limits and upon approval; Community clubhouse, pool and spa (community amenities)
Exterior
- Parking: Carport; Guest parking
- Utilities: Public water; Public sewer
- Home design: Manufactured home (mobile home) located in a park; Double-wide unit
- Construction: Wood siding and metal construction
- Exterior features: Front porch; Back yard; Shed(s); Landscaped, rectangular lot
Interior
- Kitchen: Breakfast nook; Laminate counters; Disposal; Gas range / cooktop; Built-in oven; Refrigerator
- Bedrooms: 3 bedrooms
- Flooring: Laminate; Linoleum; Carpet
- Bathrooms: 2 full bathrooms; Primary bathroom with stall shower, sunken tub and double vanity; Other bathroom(s) with shower over tub
- Heating & cooling: Forced air heating; Central air conditioning
- Interior features: Breakfast nook; Dining area; Family room; Florida / screen room
- Laundry & utility: Washer and dryer included; Gas water heater
Neighborhood map
What this means for you Summary
Snapshot
- This is a 3-bed/2.0-bath manufactured listed at $280k. Condition is rated fair.
Deal economics
- At list price, monthly cash flow is $661 ($8k/yr) — positive.
- The deal already cash-flows at list — no discount required.
- Meets the 1% rule at list price ($3k rent vs $280k).
- Cap rate 9.1% vs local median 2.1% in Hayward — top-decile yield for the area; either an underpriced asset or a hidden risk that comps aren't pricing in. Stress-test before assuming the spread holds.
Location & tenants
- Location reads 75/100 on livability (#124 in CA, #4,294 nationally) — a middle-class / working-renter tenant base. Strengths: commute A+, employment A+, health & safety A+; Watch: schools D, crime F, cost of living F.
- Hayward Unified (urban): math 25% / reading 37% proficiency, ranked #935 of 1,400 in CA (top 67%) — families likely to look elsewhere, expect single-tenant / working-renter base with shorter leases; 61% free/reduced lunch — lower-income household profile, screen leases tightly.
- Market conditions: Rents rising (+2.6%/yr); 70 active listings in the ZIP; 6 comparable units currently listed for rent nearby; rentals lingering (median 44d on market — plan ~5-8 weeks vacancy on turnover, expect pricing pressure); 50% of comp listings sitting > 30 days — soft ceiling on asking rent; high-income renter base; 1,742 units permitted in Alameda County in 2024 (856 in 5+ unit buildings).
- This rent runs 34% of the median local income ($114k/yr) — at the standard rent-burdened threshold; future hikes will face affordability resistance.
Forward outlook
- Local home prices are declining (-3.0%/yr); year-one equity from $2k of loan paydown is wiped out by about $8k of value loss. Plan a longer hold.
- Alameda County population projected at +34% by 2050 — long-run rental-demand tailwind backs the buy-and-hold thesis.
Negotiation context
- Only 9 days on market — expect competitive offers; lowballing is unlikely to land.
Risks & watch-outs
- Climate carrying-cost: moderate flood risk — expect insurance premiums to compound above CPI over the hold.
Questions for the listing agent
- Have any recent inspections been done? Can we get a copy of the seller's disclosures and any deferred-maintenance estimates?
- Built in 1974 — when were the roof, HVAC, electrical panel, plumbing, and water heater last replaced?
- Is there a deadline driving the sale (1031 exchange, divorce, estate, relocation)? That informs how much negotiation room exists.
- Schools are D-rated, which usually means shorter tenancies and higher turnover. Who's the typical renter profile here, and what's been the actual vacancy rate?
- Crime grade is F in this area — have there been break-ins, vandalism, or insurance claims at this property in the last 3 years? What carrier currently insures it and at what premium?
- What's the average days-on-market for RENTAL listings here right now (not sales)? A rising rental-DOM trend means longer vacancies and softer asking-rent achievability than the comps imply.
- What's the recent tenant-quality profile in this submarket — average credit score on applications, eviction rate, late-payment / NSF rate, and stable-employment percentage? A property-management company in the area should have these aggregated.
- How much new for-sale + rental construction is in the pipeline within 1–3 miles? Heavy new supply typically softens prices + rents 12–24 months out; constrained supply supports both.
Investment metrics
- 1% rule
- 1.17% ✓
- Cap rate
- 9.12%
- Cash-on-cash
- 10.11%
- DSCR
- 1.45
- GRM
- 7.1
CMA / ARV
- ARV (on-the-fly)
- $351,168
- Comps found
- 12
Show comp detail 12 sales within ~0.75 mi
| Address | Dist | Beds/Ba | Sqft | Sold | Price | $/sf | Match |
|---|---|---|---|---|---|---|---|
| 27957 Pueblo Serena | 0.03mi | 2/2.0 (-1) | 1,440 (-3%) | 1mo | $260,000 | $181 | 88 |
| 2696 Pueblo Crk #31 | 0.01mi | 3/2.0 | 1,481 (-0%) | 19mo | $381,000 | $257 | 83 |
| 27949 Pueblo Serena #78 | 0.06mi | 3/2.0 | 1,581 (+6%) | 5mo | $375,000 | $237 | 82 |
| 27920 Pueblo Serena | 0.19mi | 2/2.0 (-1) | 1,488 (0%) | 6mo | $260,000 | $175 | 81 |
| 27936 Pueblo Calle | 0.11mi | 3/2.0 | 1,440 (-3%) | 10mo | $301,300 | $209 | 81 |
| 27950 Pueblo Spgs | 0.13mi | 3/2.0 | 1,440 (-3%) | 13mo | $266,000 | $185 | 77 |
| 27955 Pueblo Serena | 0.04mi | 2/2.0 (-1) | 1,440 (-3%) | 14mo | $260,000 | $181 | 76 |
| 27939 Pueblo Calle | 0.11mi | 2/2.0 (-1) | 1,440 (-3%) | 12mo | $335,000 | $233 | 75 |
| 2329 Bridwell Way | 0.57mi | 3/2.0 | 1,537 (+3%) | 6mo | $385,000 | $250 | 63 |
| 2470 Bourbon Dr | 0.48mi | 3/2.0 | 1,344 (-10%) | 1mo | $355,000 | $264 | 60 |
| 28290 Applegate | 0.68mi | 3/2.0 | 1,440 (-3%) | 4mo | $340,000 | $236 | 60 |
| 2284 Bourbon #61 | 0.62mi | 3/2.0 | 1,534 (+3%) | 7mo | $410,300 | $267 | 60 |
Match score weights: distance 35% · size 25% · config 20% · recency 20%. Top-matched comps best support the ARV.
Projected returns pro-forma
-3.0% appreciation · 2.61% rent growth · sell at horizon
- IRR
- -1.5%
- Equity multiple
- 0.94×
- Total profit
- $-4,521
- Equity at exit
- $41,734
- IRR
- 7.7%
- Equity multiple
- 1.58×
- Total profit
- $45,209
- Equity at exit
- $24,201
Cash invested: $78,372 (down + closing). Projections, not guarantees.
Landlord ↔ Tenant lean methodology
- Overall (STATE)
- 18 Strongly Tenant-Friendly
- State California
- 18 Strongly Tenant-Friendly · D+13
- County
- — inherits STATE
- City
- — inherits STATE
ZIP-level market 94545
- Rents YoY
- 2.6%
- Active inventory
- 70
- Price-to-rent
- 7.1×
Monthly cashflow live
- Estimated rent
- $3,285 high interval (Pro) →
- Mortgage (P&I)
- −$1,468
- Tax est. 1.5%
- −$350 /mo · $4,198/yr
- Insurance
- −$117
- HOA
- −$0
- Vacancy / Maint / Mgmt
- −$690
- Net cashflow
- $661
Break-even live
UW: 25.0% down · 7.5% · 30yr · 1.5% tax · 5.0% vac · 8.0% maint · 8.0% mgmt
Financing live
Cash to close
- Down payment
- $69,975
- Closing costs
- $8,397
- Reserves months
- —
- Total cash needed
- —
Loan-product check · same deal, 3 products live
Conventional
25% down · 7.5% · 30yr
- Down + closing
- —
- Monthly P&I
- —
- Monthly cashflow
- —
- DSCR
- —
- Eligible?
- —
Personal DTI + credit; lowest rate.
DSCR
20% down · 8.5% · 30yr
- Down + closing
- —
- Monthly P&I
- —
- Monthly cashflow
- —
- DSCR
- —
- Eligible?
- —
No personal income docs; deal must DSCR.
Hard money
10% down · 12.0% · 12mo
- Down + closing
- —
- Monthly P&I
- —
- Monthly cashflow
- —
- DSCR
- —
- Eligible?
- —
Short-term bridge; refi at stabilization.
Rent comps 6 comps
| Address | Beds | Baths | Sqft | Rent | $/sqft | DOM | Units | Dist |
|---|---|---|---|---|---|---|---|---|
| 27463 Ponderosa Ct Hayward, CA | 2.0 | 1.5 | 988 | $2,790 | $2.82 | 43d | 1 | 0.52mi |
| 2634 Oliver Dr Unit 2634 Hayward, CA | 2.0 | 1.0 | 884 | $2,300 | $2.60 | 43d | 1 | 0.53mi |
| 27715 Cliffwood Ave Hayward, CA | 3.0 | 2.0 | 1128 | $3,800 | $3.37 | 43d | 1 | 0.57mi |
| 26754 Contessa St Hayward, CA | 3.0 | 2.0 | 1527 | $4,000 | $2.62 | 21d | 1 | 1.13mi |
| 25800 Industrial Blvd Hayward, CA | 1.0–2.0 | 1.0–2.0 | 820 | $3,128 | $3.81 | 1d | 13 | 1.40mi |
| 1234 McFarlane Ln Hayward, CA | 3.0 | 2.0 | 1311 | $3,660 | $2.79 | 12d | 1 | 1.41mi |
Listing history 7 events
-
2026-06-07statusdays on market $279,900 Pending 9 DOM
-
2026-06-04days on market $279,900 Active 8 DOM
-
2026-06-03days on market $279,900 Active 7 DOM
-
2026-06-02days on market $279,900 Active 6 DOM
-
2026-06-01days on market $279,900 Active 5 DOM
-
2026-05-31days on market $279,900 Active 4 DOM
-
2026-05-27$279,900 Active
ⓘ Source: listings_history table (triggers on properties + properties_extension) + one-shot
backfill from property_details.listing_events for pre-trigger history.
Climate risk First Street
- Flood 5/10 Major FEMA zone X (unshaded) · 52% chance over 30 yrs
- Wildfire 1/10 Low
- Heat 4/10 Moderate 7 d/yr ≥89°F today · 14 d/yr by 30 yrs out
- Wind 1/10 Low
- Air quality 7/10 Severe 12 unhealthy d/yr today · 12 by 30 yrs out
Nearby sold comps map
Loading sold comps map…
Walkable amenities ~0.75 mi
Loading nearby amenities…
Taxation est. · year 1
- Rental income
- $39,416
- − Mortgage interest
- −$15,679
- − Property taxes
- −$4,198
- − Insurance
- −$1,400
- − Repairs & maintenance
- −$3,153
- − Management
- −$3,153
- − Depreciation
- −$8,143
- Taxable income
- $3,690
- Est. tax owed @ 24.0%
- −$886
- After-tax cash flow
- $7,041/yr
For passive investors: Depreciation is non-cash, so a rental often shows a tax loss while cash-flowing — sheltering income. Rental losses are passive: they offset passive income freely, and up to $25,000/yr can offset ordinary (W-2) income if you actively participate and your MAGI is under $100k (phasing out to $0 by $150k); unused losses carry forward. On sale, claimed depreciation is recaptured at up to 25%, and gains may owe capital-gains tax (a 1031 exchange can defer both). Figures are a year-1 estimate at your 24.0% rate — not tax advice; consult a CPA.
Condition & rehab AI · 12 photos
This manufactured home requires moderate renovations to update the kitchen and bathrooms, replace outdated fixtures, and paint interior walls. The home has average exterior and interior conditions, with some landscaping that could be improved.
Repairs flagged
- Moderate kitchen cabinets — dated and in need of updating
- Moderate bathroom fixtures — outdated and in need of replacement
- Moderate kitchen countertops — dated and in need of updating
- Moderate flooring — dated and in need of updating
Value-add opportunities
- Both update kitchen cabinets and countertops — modernizing the kitchen would appeal to both buyers and renters
- Both replace awning-style windows — new windows would improve curb appeal and natural light
- Both paint interior walls — fresh paint would brighten the interior and make it more appealing
Renovation cost estimate screening
| Repair item | Severity | Est. cost |
|---|---|---|
| kitchen cabinets · dated and in need of updating | Moderate | $3,000–15,000 |
| bathroom fixtures · outdated and in need of replacement | Moderate | $3,000–15,000 |
| kitchen countertops · dated and in need of updating | Moderate | $3,000–15,000 |
| flooring · dated and in need of updating | Moderate | $3,000–15,000 |
| Total estimated repair cost · 4 items | $12,000–60,000 |
Value-add ROI direction
- Both update kitchen cabinets and countertops — modernizing the kitchen would appeal to both buyers and renters ↑
- Both replace awning-style windows — new windows would improve curb appeal and natural light ↑
- Both paint interior walls — fresh paint would brighten the interior and make it more appealing ↑
ⓘ Cost ranges are severity-bucket heuristics (US national rule-of-thumb). Get contractor quotes + a written scope before underwriting a rehab budget.
Schools (NCES district)
- District
- Hayward Unified
- NCES district ID
- 0616740
- Math proficiency
- 25% ▼ -1.00%
- Reading proficiency
- 37% ▬ 0.00%
- Median HH income
- $65,326
- Composite
- 31.27/100
- National rank
- #11241
- State rank
- #935 of 1400 in CA
Livability — Hayward
- Score
- 75/100
- State rank
- #124
- US rank
- #4294
Category grades
Schools grade is shown separately in the Schools card above.
Census & demographics
- Census place
- Hayward, CA
- County
- Alameda County · 1,614,355 people
- City population
- 191,800
- Metro
- San Francisco-Oakland-Berkeley, CA
- Population (ZIP)
- 32,843
- Household income
- $114,356
- Rent vs Own
- Severe rent burden
- 702.0
Population outlook (Alameda County) Hauer SSP2
- Today (2025)
- 1,928,884 people
- By 2030
- 2,069,146 · +7.3%
- By 2040
- 2,338,405 · +21.2%
- By 2050
- 2,586,608 · +34.1%
- By 2075
- 3,061,911 · +58.7%
- By 2100
- 3,234,133 · +67.7%
Race, ethnicity, and origin ACS 2023
- Neighborhood character
- Diverse neighborhood (Simpson 0.69)
- Race & ethnicity
- Asian 42% Hispanic / Latino 35% Two or more races 12% White 10% Black 8% Native American 1% Pacific Islander 1%
- Hispanic origin (detail)
- Mexican 25%
- Common ancestry
- Italian 1% Russian 1% Romanian 1%
- Foreign-born
- 43% · Canada, China, Vietnam
- Languages at home
- 39% English-only · Spanish 26% Tagalog/Filipino 14% Chinese 7%
Political lean MEDSL · Alameda
- 2024 margin
- Solid D (+53.6) · D 74.6% · R 21.0% · Other 4.4%
- 2008→2024 swing
- -5.9pp toward R · 2008: 59.5pp · 2024: 53.6pp
- All cycles
- 2024: D+53.6 2020: D+62.5 2016: D+64.4 2012: D+59.8 2008: D+59.5
Not yet ingested
- Civics
- —
Market trends
- HPI YoY
- ▼ -974.17%
- Current HPI
- 304.698
- Rent YoY
- ▲ 2.61%
- Metro
- San Francisco-Oakland-Berkeley, CA
- State GDP YoY
- ▲ 3.21%
- F500 in state
- 116
Industry mix (Fortune 500 HQ in CA)
| Industry | F500 HQs | Revenue |
|---|---|---|
| Technology | 27 | $1,492B |
|
||
| Financial Services | 3 | $174B |
|
||
| Retail | 3 | $44B |
|
||
| Insurance | 3 | $26B |
|
||
| Media / Entertainment | 2 | $115B |
|
||
| Pharmaceuticals / Biotech | 2 | $62B |
|
||
Price history
1 event — show timeline
- 2026-05-27 Listed $279,900 bridgeMLS, Bay East AOR, or Contra Costa AOR
Cash-flow waterfall
monthlySold comps — $/sqft
last 12 mo · ≤1 miLoading sold comps…