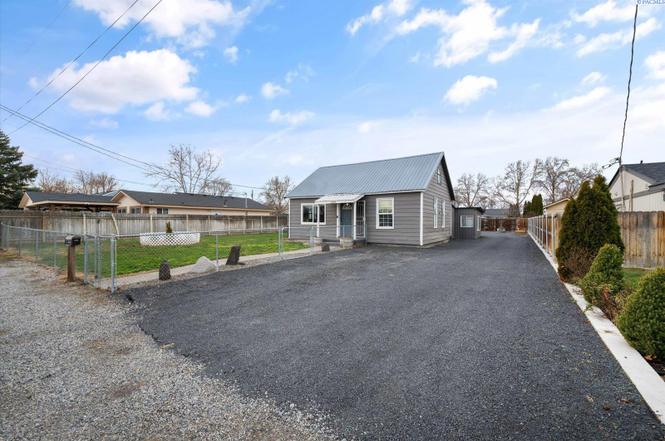
406 S Fir St · Kennewick, WA
Flood risk 1/10 · Minimal
- FEMA flood zone
- X
- Chance of flooding over 30 yrs
- 0.0%
- Est. flood insurance / yr
- $507 – $1,088
Fire risk 3/10 · Minor
- Est. fire insurance / yr
- $604 – $1,122
Heat risk 5/10 · Moderate
- Hot days now (above 100°F)
- 7 days/yr
- Hot days in 30 yrs
- 14 days/yr
Wind risk 1/10 · Minimal
- Chance of severe wind over 30 yrs
- —
Air-quality risk 8/10 · Major
- Unhealthy air days now
- 15 days/yr
- Unhealthy air days in 30 yrs
- 16 days/yr
Risk factors via First Street. Map © Google.
Why this score? — see what drove the D grade
The composite is a weighted blend of 9 inputs, each scored 0–100. Each bar is that input's sub-score; the figure is the points it added to the 100-point composite (weight × sub-score).
- Cash flow +13.7/30.0
- ARV discount +8.9/15.0
- Schools +4.6/10.0
- DSCR +4.1/10.0
- Livability +3.9/5.0
- 1% rule +3.3/10.0
- Rent growth +3.3/5.0
- Condition / age +2.5/5.0
- Appreciation +0.0/10.0
$315,000
🖨 Deal sheet 📄 Offer letter ✓ Due diligence
Listing remarks MLS
MLS# 256405 Adorable home with fenced yard and detached shop! You will fall in love with this 3 bed, 1 bath home that has so much potential! Enter into the large living room that flows into the spacious kitchen. Downstairs you have 2 bedrooms along with 2 flex spaces allowing you to have a home that fits your needs perfectly! Upstairs features a large loft area with closet. Large mud/utility room leads to the large fenced yard and 720 sq ft garage/shop with loft and lean to. Tons of off street parking and possibilities with this great property! Comes with a 1 year home warranty! Call your favorite agent for a private showing today!
Key facts
- New floors
- New paint
- Newly updated rooms
Tags
Property features AI
Exterior
- Parking: 3 total parking spaces; 3 covered spaces; Detached garage with 3 spaces; Open parking with RV access/parking
- Utilities: Public water; Electric service on property; Electricity connected; Sewer connected; UGS timed irrigation
- Home design: Single-family residence (site built, owned lot); One story
- Construction: Metal siding; Metal roof; Built on crawl space
- Exterior features: Patio; Full and partial fencing; Workshop on property
Interior
- Kitchen: Dishwasher; Microwave; Refrigerator; Range; Oven
- Flooring: Carpet; Vinyl
- Bathrooms: 1 full bathroom
- Heating & cooling: Electric heating; Central air conditioning (electric)
- Interior features: Storage; Ceiling fan(s); Crawl space (no finished basement)
- Laundry & utility: Laundry room
Neighborhood map
What this means for you Summary
Snapshot
- This is a 3-bed/1.0-bath single-family listed at $315k.
Deal economics
- At list price, monthly cash flow is $23 ($281/yr) — positive.
- The deal already cash-flows at list — no discount required.
- To meet the 1% rule (rent ≥ 1% of price), the offer needs to be $260k (17.5% below list).
- Recommended offer: $260k (17.5% below list) — sets the bar for 1% rule.
- Cap rate 6.4% vs local median 3.3% in Kennewick — top-decile yield for the area; either an underpriced asset or a hidden risk that comps aren't pricing in. Stress-test before assuming the spread holds.
Location & tenants
- Location reads 78/100 on livability (#131 in WA, #2,599 nationally) — a middle-class / working-renter tenant base. Strengths: commute A+, housing A+, health & safety A; Watch: schools D+, amenities D+, crime F.
- Kennewick School District (urban): math 43% / reading 58% proficiency, ranked #141 of 291 in WA (top 48%) — acceptable for families but not a draw, mixed tenant base, ~2y average lease.
- Market conditions: Rents rising (+3.4%/yr); 286 active listings in the ZIP; 6 comparable units currently listed for rent nearby; rentals leasing fast (median 14d on market — plan ~1-2 weeks tenant-placement turnaround); 1,532 units permitted in Benton County in 2024 (389 in 5+ unit buildings).
- At $2,599/mo this rent would consume 50% of the median local household income ($63k/yr) (locally 2605% of renters already pay >50% of income on rent) — very limited rent-growth headroom before tenants either downsize or default.
Forward outlook
- Local home prices are declining (-3.0%/yr); year-one equity from $2k of loan paydown is wiped out by about $9k of value loss. Plan a longer hold.
- Benton County population projected at +32% by 2050 — long-run rental-demand tailwind backs the buy-and-hold thesis.
Negotiation context
- It's been on market 31 days — a 3% lower offer ($306k) is reasonable based on typical stale-listing flexibility.
- 5 sale attempts since 12y ago with the ask held roughly flat each time — persistent listings suggest the price (not the market) is what's stuck; bring a comps-based counter.
Risks & watch-outs
- Watch-outs: built in 1925 — expect roof / HVAC / electrical / plumbing capex.
- Climate carrying-cost: extreme-heat days projected 7→14/yr by 2055 (HVAC capex compounding) — expect insurance premiums to compound above CPI over the hold.
Questions for the listing agent
- It's been on market 31 days. Have you received any prior offers? Is the seller open to a 17% concession, seller financing, or rate buy-down credit?
- Built in 1925 — when were the roof, HVAC, electrical panel, plumbing, and water heater last replaced?
- Is there a deadline driving the sale (1031 exchange, divorce, estate, relocation)? That informs how much negotiation room exists.
- Schools are D-rated, which usually means shorter tenancies and higher turnover. Who's the typical renter profile here, and what's been the actual vacancy rate?
- Crime grade is F in this area — have there been break-ins, vandalism, or insurance claims at this property in the last 3 years? What carrier currently insures it and at what premium?
- The area grade is low — what's the realistic commute time and amenity access for the typical tenant pool here? Any planned neighborhood developments (good or bad) we should know about?
- What's the average days-on-market for RENTAL listings here right now (not sales)? A rising rental-DOM trend means longer vacancies and softer asking-rent achievability than the comps imply.
- What's the recent tenant-quality profile in this submarket — average credit score on applications, eviction rate, late-payment / NSF rate, and stable-employment percentage? A property-management company in the area should have these aggregated.
- How much new for-sale + rental construction is in the pipeline within 1–3 miles? Heavy new supply typically softens prices + rents 12–24 months out; constrained supply supports both.
Investment metrics
- 1% rule
- 0.83% ✗
- Cap rate
- 6.38%
- Cash-on-cash
- 0.32%
- DSCR
- 1.01
- GRM
- 10.1
CMA / ARV
- ARV (on-the-fly)
- $325,220
- Comps found
- 12
Show comp detail 12 sales within ~0.75 mi
| Address | Dist | Beds/Ba | Sqft | Sold | Price | $/sf | Match |
|---|---|---|---|---|---|---|---|
| 406 S Fir St | 0.00mi | 3/1.0 | 1,610 (0%) | 1mo | $315,000 | $196 | 99 |
| 719 S Gum St | 0.23mi | 3/2.0 | 1,684 (+5%) | 7mo | $253,000 | $150 | 72 |
| 219 E 6th Ave | 0.21mi | 3/2.0 | 1,534 (-5%) | 9mo | $294,900 | $192 | 71 |
| 1140 S Cedar Pl | 0.52mi | 3/3.0 | 1,595 (-1%) | 1mo | $339,900 | $213 | 66 |
| 119 E 1st Ave | 0.37mi | 3/2.0 | 1,520 (-6%) | 9mo | $307,000 | $202 | 62 |
| 514 S Ivy St | 0.32mi | 3/2.0 | 1,456 (-10%) | 6mo | $295,000 | $203 | 60 |
| 706 S Alder St | 0.41mi | 4/1.0 (+1) | 1,477 (-8%) | 3mo | $296,000 | $200 | 60 |
| 218 E 8th Pl | 0.37mi | 3/2.0 | 1,416 (-12%) | 1mo | $246,000 | $174 | 58 |
| 415 E 8th Ave | 0.27mi | 4/2.0 (+1) | 1,767 (+10%) | 6mo | $325,000 | $184 | 57 |
| 721 E 15th Ave | 0.65mi | 3/2.0 | 1,456 (-10%) | 8mo | $330,000 | $227 | 43 |
| 1001 S Benton St | 0.70mi | 4/2.0 (+1) | 1,477 (-8%) | 4mo | $345,000 | $234 | 41 |
| 305 W 10th Ave | 0.73mi | 3/1.0 | 1,369 (-15%) | 8mo | $312,000 | $228 | 34 |
Match score weights: distance 35% · size 25% · config 20% · recency 20%. Top-matched comps best support the ARV.
Projected returns pro-forma
-3.0% appreciation · 3.39% rent growth · sell at horizon
- IRR
- -15.4%
- Equity multiple
- 0.45×
- Total profit
- $-48,580
- Equity at exit
- $46,968
- IRR
- -6.3%
- Equity multiple
- 0.59×
- Total profit
- $-36,354
- Equity at exit
- $27,235
Cash invested: $88,200 (down + closing). Projections, not guarantees.
Landlord ↔ Tenant lean methodology
- Overall (STATE)
- 28 Tenant-Leaning
- State Washington
- 28 Tenant-Leaning · D+8
- County
- — inherits STATE
- City
- — inherits STATE
ZIP-level market 99336
- Rents YoY
- 3.4%
- Active inventory
- 286
- Price-to-rent
- 10.1×
Monthly cashflow live
- Estimated rent
- $2,599 high interval (Pro) →
- Mortgage (P&I)
- −$1,652
- Tax from tax record
- −$247 /mo · $2,964/yr
- Insurance
- −$131
- HOA
- −$0
- Vacancy / Maint / Mgmt
- −$546
- Net cashflow
- $23
Break-even live
UW: 25.0% down · 7.5% · 30yr · 1.5% tax · 5.0% vac · 8.0% maint · 8.0% mgmt
Financing live
Cash to close
- Down payment
- $78,750
- Closing costs
- $9,450
- Reserves months
- —
- Total cash needed
- —
Loan-product check · same deal, 3 products live
Conventional
25% down · 7.5% · 30yr
- Down + closing
- —
- Monthly P&I
- —
- Monthly cashflow
- —
- DSCR
- —
- Eligible?
- —
Personal DTI + credit; lowest rate.
DSCR
20% down · 8.5% · 30yr
- Down + closing
- —
- Monthly P&I
- —
- Monthly cashflow
- —
- DSCR
- —
- Eligible?
- —
No personal income docs; deal must DSCR.
Hard money
10% down · 12.0% · 12mo
- Down + closing
- —
- Monthly P&I
- —
- Monthly cashflow
- —
- DSCR
- —
- Eligible?
- —
Short-term bridge; refi at stabilization.
Rent comps 6 comps
| Address | Beds | Baths | Sqft | Rent | $/sqft | DOM | Units | Dist |
|---|---|---|---|---|---|---|---|---|
| 212 N Elm St Kennewick, WA | 1.0–3.0 | 1.5–3.5 | 1782 | $4,705 | $2.64 | 13d | 19 | 0.49mi |
| 705 S Ione St Kennewick, WA | 3.0 | 1.5 | 1056 | $2,000 | $1.89 | 13d | 1 | 0.99mi |
| 1000 W 5th Ave Kennewick, WA | 3.0–4.0 | 2.0 | 1157 | $1,371 | $1.18 | 13d | 4 | 1.15mi |
| 1114 W 10th Ave Kennewick, WA | 3.0 | 1.0–2.0 | 829 | $1,551 | $1.87 | 13d | 41 | 1.21mi |
| 911 W Entiat Ave Kennewick, WA | 2.0–3.0 | 2.5 | 1392 | $1,999 | $1.44 | 21d | 5 | 1.30mi |
| 425 S Olympia St Kennewick, WA | 2.0 | 1.0–2.0 | 1000 | $1,335 | $1.33 | 13d | 9 | 1.33mi |
Listing history 12 events
-
2026-04-29status Pending
-
2026-04-10status Active
-
2026-04-04status Pending
-
2026-03-31status Active
-
2026-03-21status Pending
-
2026-03-13$315,000 Active
-
2026-02-16price $325,000
-
2021-10-06soldstatus $279,000 640-char remark
Show marketing remark (640 chars)
MLS# 256405 Adorable home with fenced yard and detached shop! You will fall in love with this 3 bed, 1 bath home that has so much potential! Enter into the large living room that flows into the spacious kitchen. Downstairs you have 2 bedrooms along with 2 flex spaces allowing you to have a home that fits your needs perfectly! Upstairs features a large loft area with closet. Large mud/utility room leads to the large fenced yard and 720 sq ft garage/shop with loft and lean to. Tons of off street parking and possibilities with this great property! Comes with a 1 year home warranty! Call your favorite agent for a private showing today!
-
2021-09-09$260,000 640-char remark
Show marketing remark (640 chars)
MLS# 256405 Adorable home with fenced yard and detached shop! You will fall in love with this 3 bed, 1 bath home that has so much potential! Enter into the large living room that flows into the spacious kitchen. Downstairs you have 2 bedrooms along with 2 flex spaces allowing you to have a home that fits your needs perfectly! Upstairs features a large loft area with closet. Large mud/utility room leads to the large fenced yard and 720 sq ft garage/shop with loft and lean to. Tons of off street parking and possibilities with this great property! Comes with a 1 year home warranty! Call your favorite agent for a private showing today!
-
2015-03-30soldstatus $111,708
-
2015-03-27soldstatus $112,000
-
2014-11-03$112,900
ⓘ Source: listings_history table (triggers on properties + properties_extension) + one-shot
backfill from property_details.listing_events for pre-trigger history.
Tax reassessment forecast WA · Resets to sale price
- Current annual tax
- $2,964 · $247/mo
- Projected year-2 tax
- $3,087 · $257/mo
- Expected delta
- +$123/yr (+$10/mo · 4.1%)
ⓘ Screening estimate from a state-policy table — verify with the county assessor before closing.
Climate risk First Street
- Flood 1/10 Low FEMA zone X · 0% chance over 30 yrs
- Wildfire 3/10 Moderate
- Heat 5/10 Major 7 d/yr ≥100°F today · 14 d/yr by 30 yrs out
- Wind 1/10 Low
- Air quality 8/10 Severe 15 unhealthy d/yr today · 16 by 30 yrs out
Nearby sold comps map
Loading sold comps map…
Walkable amenities ~0.75 mi
Loading nearby amenities…
Taxation est. · year 1
- Rental income
- $31,194
- − Mortgage interest
- −$17,645
- − Property taxes
- −$2,964
- − Insurance
- −$1,575
- − Repairs & maintenance
- −$2,496
- − Management
- −$2,496
- − Depreciation
- −$9,164
- Taxable loss
- −$5,145
- Est. tax savings @ 24.0%
- +$1,235
- After-tax cash flow
- $1,516/yr
For passive investors: Depreciation is non-cash, so a rental often shows a tax loss while cash-flowing — sheltering income. Rental losses are passive: they offset passive income freely, and up to $25,000/yr can offset ordinary (W-2) income if you actively participate and your MAGI is under $100k (phasing out to $0 by $150k); unused losses carry forward. On sale, claimed depreciation is recaptured at up to 25%, and gains may owe capital-gains tax (a 1031 exchange can defer both). Figures are a year-1 estimate at your 24.0% rate — not tax advice; consult a CPA.
Schools (NCES district)
- District
- Kennewick School District
- NCES district ID
- 5303930
- Math proficiency
- 43% ▼ -1.00%
- Reading proficiency
- 58% ▬ 0.00%
- Median HH income
- $54,191
- Composite
- 45.56/100
- National rank
- #5667
- State rank
- #141 of 291 in WA
Livability — Kennewick
- Score
- 78/100
- State rank
- #131
- US rank
- #2599
Category grades
Schools grade is shown separately in the Schools card above.
Census & demographics
- Census place
- Kennewick, WA
- County
- Benton County · 186,895 people
- City population
- 104,655
- Metro
- Kennewick-Richland, WA
- Population (ZIP)
- 50,735
- Household income
- $62,527
- Rent vs Own
- Severe rent burden
- 2605.0
Population outlook (Benton County) Hauer SSP2
- Today (2025)
- 219,421 people
- By 2030
- 233,813 · +6.6%
- By 2040
- 262,134 · +19.5%
- By 2050
- 290,100 · +32.2%
- By 2075
- 363,525 · +65.7%
- By 2100
- 418,667 · +90.8%
Race, ethnicity, and origin ACS 2023
- Neighborhood character
- Diverse neighborhood (Simpson 0.56)
- Race & ethnicity
- White 55% Hispanic / Latino 37% Two or more races 15% Black 3% Asian 2% Native American 1%
- Hispanic origin (detail)
- Mexican 31% Cuban 2%
- Common ancestry
- Portuguese 4% Slovak 3% Romanian 1%
- Foreign-born
- 16% · Canada, Jamaica
- Languages at home
- 68% English-only · Spanish 29% Arabic 1%
Political lean MEDSL · Benton
- 2024 margin
- Strong R (+21.9) · D 37.7% · R 59.6% · Other 2.7%
- 2008→2024 swing
- +4.2pp toward D · 2008: -26.1pp · 2024: -21.9pp
- All cycles
- 2024: R+21.9 2020: R+21.0 2016: R+26.6 2012: R+27.0 2008: R+26.1
Not yet ingested
- Civics
- —
Market trends
- HPI YoY
- ▼ -408.26%
- Current HPI
- 256.1143
- Rent YoY
- ▲ 3.39%
- Metro
- Kennewick-Richland, WA
- State GDP YoY
- ▲ 4.65%
- F500 in state
- 22
Industry mix (Fortune 500 HQ in WA)
| Industry | F500 HQs | Revenue |
|---|---|---|
| Retail | 2 | $269B |
|
||
| Technology / Retail | 1 | $638B |
|
||
| Technology | 1 | $245B |
|
||
| Telecommunications | 1 | $38B |
|
||
| Food / Beverage | 1 | $36B |
|
||
| Automotive / Trucks | 1 | $34B |
|
||
Price history
+179.0% since first listed12 events — show timeline
- 2026-04-29 Pending — PACMLS
- 2026-04-10 Relisted — PACMLS
- 2026-04-04 Pending — PACMLS
- 2026-03-31 Relisted — PACMLS
- 2026-03-21 Pending — PACMLS
- 2026-03-13 Listed $315,000 PACMLS
- 2026-02-16 Price Changed $325,000 PACMLS
- 2021-10-06 Sold (MLS) $279,000 PACMLS
- 2021-09-09 Listed $260,000 PACMLS
- 2015-03-30 Sold (Public Records) $111,708 Public Records
- 2015-03-27 Sold (MLS) $112,000 PACMLS
- 2014-11-03 Listed $112,900 PACMLS
Property tax history
+7.7%/yrLatest (2026): $2,964 · +1.6% YoY. Source: county tax records.
Cash-flow waterfall
monthlySold comps — $/sqft
last 12 mo · ≤1 miLoading sold comps…