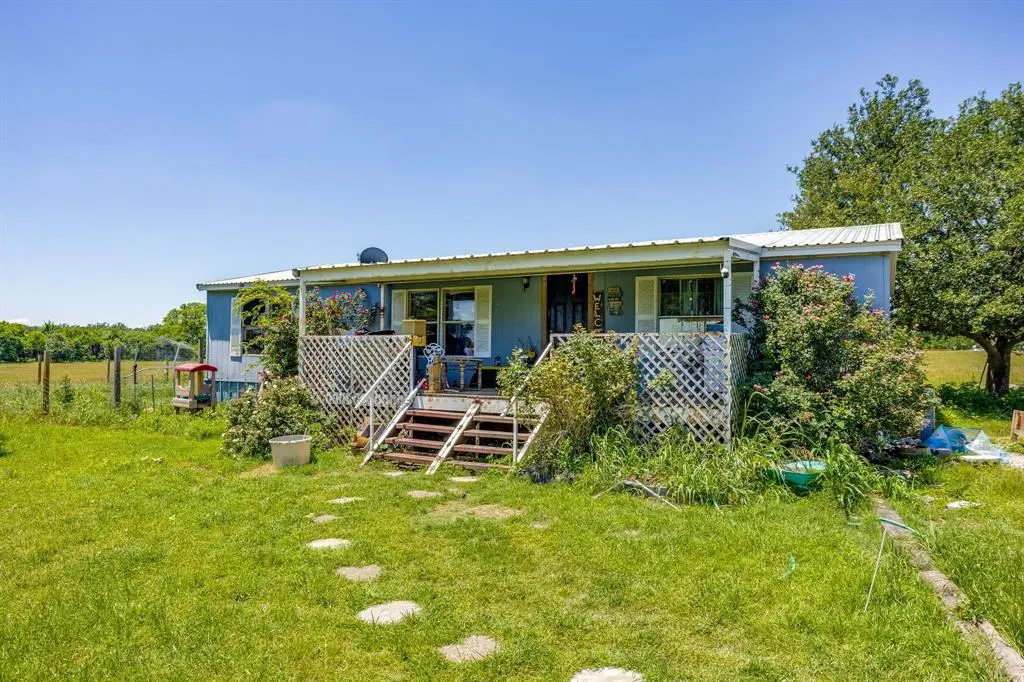
1100 Knob Rd · Springtown, TX
Flood risk 1/10 · Minimal
- FEMA flood zone
- X (unshaded)
- Chance of flooding over 30 yrs
- 0.0%
- Est. flood insurance / yr
- $507 – $1,088
Fire risk 7/10 · Major
- Est. fire insurance / yr
- $1,222 – $2,270
Heat risk 7/10 · Major
- Hot days now (above 109°F)
- 7 days/yr
- Hot days in 30 yrs
- 22 days/yr
Wind risk 6/10 · Moderate
- Chance of severe wind over 30 yrs
- 27.0%
Air-quality risk 3/10 · Minor
- Unhealthy air days now
- 2 days/yr
- Unhealthy air days in 30 yrs
- 3 days/yr
Risk factors via First Street. Map © Google.
Why this score? — see what drove the B+ grade
The composite is a weighted blend of 9 inputs, each scored 0–100. Each bar is that input's sub-score; the figure is the points it added to the 100-point composite (weight × sub-score).
- Cash flow +30.0/30.0
- ARV discount +15.0/15.0
- DSCR +10.0/10.0
- 1% rule +9.9/10.0
- Livability +3.4/5.0
- Schools +3.3/10.0
- Rent growth +2.5/5.0
- Condition / age +2.5/5.0
- Appreciation +0.0/10.0
$135,000
🖨 Deal sheet 📄 Offer letter ✓ Due diligence
Listing remarks
Nice mobile home on one acre in the edge of Springtown, close to schools and shopping. This would make a great starter home or investment property. This really is a nice place to raise kids and pets. Be sure to come look, you don't find property at this price.
Key facts
- 1 acre lot
- Built 1996
- Listed 22 days
Property features AI
Finance
- Other: Property type: Residential; Property subtype: Mobile Home; County: Parker; Country: United States
- Financial info: Listing terms: Cash or Conventional; Loan type: Treat as clear; No second mortgage
- HOA & community: No association
Exterior
- Parking: Direct access parking; Drive-through parking
- Utilities: City water; Rural water district; Septic; Electricity connected
- Home design: Mobile home (residential); Attached; One story; Built in 1996
- Construction: Year built 1996
- Exterior features: 1 acre lot; Will not subdivide; Directions: Take E 3rd St in Springtown to where it tees into Knob Rd, turn left on Knob and follow the curve to the property on the right
Interior
- Kitchen: Dishwasher; Electric cooktop; Electric oven; Kitchen island; Eat-in kitchen
- Bedrooms: 3 bedrooms; Primary bedroom on level 1
- Bathrooms: 2 full bathrooms
- Interior features: Decorative lighting; Eat-in kitchen; Kitchen island; One living area; One dining area; Room count: 2
- Laundry & utility: Electric water heater
Neighborhood map
What this means for you Summary
Snapshot
- This is a 3-bed/2.0-bath manufactured listed at $135k.
Deal economics
- At list price, monthly cash flow is $656 ($8k/yr) — positive.
- The deal already cash-flows at list — no discount required.
- Meets the 1% rule at list price ($2k rent vs $135k).
- Recommended offer: $133k (1.5% below list) — sets the bar for market timing.
- Cap rate 12.1% vs local median 3.4% in Springtown — top-decile yield for the area; either an underpriced asset or a hidden risk that comps aren't pricing in. Stress-test before assuming the spread holds.
Location & tenants
- Location reads 68/100 on livability (#461 in TX) — a middle-class / working-renter tenant base. Strengths: cost of living A+, housing A+, crime B+; Watch: health & safety D+, amenities F, commute F.
- Springtown ISD (town): math 36% / reading 40% proficiency, ranked #435 of 826 in TX (top 53%) — families likely to look elsewhere, expect single-tenant / working-renter base with shorter leases.
- Zoned schools: Springtown El (math 37% / reading 42%, grade F, #1,545 of 4,322 statewide, top 38%, 674 students, 60% FRL).
- Market conditions: 519 active listings in the ZIP; 10 comparable units currently listed for rent nearby; rentals leasing fast (median 13d on market — plan ~1-2 weeks tenant-placement turnaround); solid renter incomes; 437 units permitted in Parker County in 2024 (0 in 5+ unit buildings).
Forward outlook
- Local home prices are declining (-3.0%/yr); year-one equity from $933 of loan paydown is wiped out by about $4k of value loss. Plan a longer hold.
- Parker County population projected at +32% by 2050 — long-run rental-demand tailwind backs the buy-and-hold thesis.
- At projected returns (-3.0% appreciation + 3.0% rent growth), your $38k cash investment doubles in ~6 years — after that, you're playing with house money.
Negotiation context
- It's been on market 22 days — a 2% lower offer ($133k) is reasonable based on typical stale-listing flexibility.
- 3 sale attempts since 16y ago with the ask held roughly flat each time — persistent listings suggest the price (not the market) is what's stuck; bring a comps-based counter.
Risks & watch-outs
- Climate carrying-cost: major wind risk, 27% chance of damaging wind over 30y; major wildfire risk; extreme-heat days projected 7→22/yr by 2055 (HVAC capex compounding) — expect insurance premiums to compound above CPI over the hold.
Questions for the listing agent
- Is there a deadline driving the sale (1031 exchange, divorce, estate, relocation)? That informs how much negotiation room exists.
- Schools are D-rated, which usually means shorter tenancies and higher turnover. Who's the typical renter profile here, and what's been the actual vacancy rate?
- What's the average days-on-market for RENTAL listings here right now (not sales)? A rising rental-DOM trend means longer vacancies and softer asking-rent achievability than the comps imply.
- What's the recent tenant-quality profile in this submarket — average credit score on applications, eviction rate, late-payment / NSF rate, and stable-employment percentage? A property-management company in the area should have these aggregated.
- How much new for-sale + rental construction is in the pipeline within 1–3 miles? Heavy new supply typically softens prices + rents 12–24 months out; constrained supply supports both.
Investment metrics
- 1% rule
- 1.49% ✓
- Cap rate
- 12.13%
- Cash-on-cash
- 20.84%
- DSCR
- 1.93
- GRM
- 5.6
CMA / ARV
- ARV (median comp)
- $199,049
- List price
- $135,000
- Delta
- -32.18%
- Verdict
- UNDERPRICED
- Comps
- 5 within 2.0 mi
Projected returns pro-forma
-3.0% appreciation · 3.0% rent growth · sell at horizon
- IRR
- 13.2%
- Equity multiple
- 1.53×
- Total profit
- $19,967
- Equity at exit
- $20,129
- IRR
- 22.1%
- Equity multiple
- 2.89×
- Total profit
- $71,348
- Equity at exit
- $11,672
Cash invested: $37,800 (down + closing). Projections, not guarantees.
Landlord ↔ Tenant lean methodology
- Overall (STATE)
- 87 Strongly Landlord-Friendly
- State Texas
- 87 Strongly Landlord-Friendly · R+5
- County
- — inherits STATE
- City
- — inherits STATE
ZIP-level market 76082
- Home prices YoY
- -21.5%
- Active inventory
- 519
- Price-to-rent
- 5.6×
Monthly cashflow live
- Estimated rent
- $2,011 high interval (Pro) →
- Mortgage (P&I)
- −$708
- Tax from tax record
- −$168 /mo · $2,015/yr
- Insurance
- −$56
- HOA
- −$0
- Vacancy / Maint / Mgmt
- −$422
- Net cashflow
- $656
Break-even live
UW: 25.0% down · 7.5% · 30yr · 1.5% tax · 5.0% vac · 8.0% maint · 8.0% mgmt
Financing live
Cash to close
- Down payment
- $33,750
- Closing costs
- $4,050
- Reserves months
- —
- Total cash needed
- —
Loan-product check · same deal, 3 products live
Conventional
25% down · 7.5% · 30yr
- Down + closing
- —
- Monthly P&I
- —
- Monthly cashflow
- —
- DSCR
- —
- Eligible?
- —
Personal DTI + credit; lowest rate.
DSCR
20% down · 8.5% · 30yr
- Down + closing
- —
- Monthly P&I
- —
- Monthly cashflow
- —
- DSCR
- —
- Eligible?
- —
No personal income docs; deal must DSCR.
Hard money
10% down · 12.0% · 12mo
- Down + closing
- —
- Monthly P&I
- —
- Monthly cashflow
- —
- DSCR
- —
- Eligible?
- —
Short-term bridge; refi at stabilization.
Rent comps 10 comps
| Address | Beds | Baths | Sqft | Rent | $/sqft | DOM | Units | Dist |
|---|---|---|---|---|---|---|---|---|
| 217 N Spring Branch Trl Springtown, TX | 3.0 | 2.0 | 1300 | $2,100 | $1.62 | 13d | 1 | 0.32mi |
| 217 N Spring Branch Trl Springtown, TX | 3.0 | 2.0 | 1300 | $2,050 | $1.58 | 4d | 1 | 0.32mi |
| 912 Avagail Ave Springtown, TX | 3.0 | 2.0 | 1665 | $2,195 | $1.32 | 17d | 1 | 0.35mi |
| 413 Jameson Springtown, TX | 3.0 | 2.0 | 1416 | $2,125 | $1.50 | 19d | 1 | 0.78mi |
| 416 North Avenue B Unit B Springtown, TX | 3.0 | 2.0 | 1180 | $1,650 | $1.40 | 44d | 1 | 0.87mi |
| 300 W 4th St Springtown, TX | 3.0 | 1.0 | 1332 | $1,675 | $1.26 | 22d | 1 | 1.15mi |
| 409 N Cedar St Springtown, TX | 4.0 | 2.0 | 1203 | $1,750 | $1.45 | 10d | 1 | 1.26mi |
| 181 Rolling Gln Springtown, TX | 3.0 | 2.0 | 1100 | $1,495 | $1.36 | 1d | 1 | 1.34mi |
| 167 Rolling Gln Springtown, TX | 3.0 | 2.0 | 1100 | $1,495 | $1.36 | 1d | 1 | 1.35mi |
| 165 Rolling Gln Springtown, TX | 3.0 | 2.0 | 1100 | $1,495 | $1.36 | 1d | 1 | 1.35mi |
Listing history 12 events
-
2026-06-04statusdays on market $135,000 Pending 22 DOM
-
2026-06-03days on market $135,000 Active Option Contract 21 DOM
-
2026-06-02days on market $135,000 Active Option Contract 20 DOM
-
2026-06-01days on market $135,000 Active Option Contract 19 DOM
-
2026-05-31days on market $135,000 Active Option Contract 18 DOM
-
2026-05-13$135,000 Active 261-char remark
-
2017-04-18soldstatus
-
2013-03-22historical
-
2011-09-22historical
-
2011-09-18price $129,500
-
2010-03-19$152,000 Active
-
2010-03-19$68,500 Active
ⓘ Source: listings_history table (triggers on properties + properties_extension) + one-shot
backfill from property_details.listing_events for pre-trigger history.
Tax reassessment forecast TX · Resets to sale price
- Current annual tax
- $2,015 · $168/mo
- Projected year-2 tax
- $2,470 · $206/mo
- Expected delta
- +$455/yr (+$38/mo · 22.6%)
ⓘ Screening estimate from a state-policy table — verify with the county assessor before closing.
Climate risk First Street
- Flood 1/10 Low FEMA zone X (unshaded) · 0% chance over 30 yrs
- Wildfire 7/10 Severe
- Heat 7/10 Severe 7 d/yr ≥109°F today · 22 d/yr by 30 yrs out
- Wind 6/10 Major 27% chance of damaging wind over 30 yrs
- Air quality 3/10 Moderate 2 unhealthy d/yr today · 3 by 30 yrs out
Nearby sold comps map
Loading sold comps map…
Walkable amenities ~0.75 mi
Loading nearby amenities…
Taxation est. · year 1
- Rental income
- $24,131
- − Mortgage interest
- −$7,562
- − Property taxes
- −$2,015
- − Insurance
- −$675
- − Repairs & maintenance
- −$1,930
- − Management
- −$1,930
- − Depreciation
- −$3,927
- Taxable income
- $6,091
- Est. tax owed @ 24.0%
- −$1,462
- After-tax cash flow
- $6,416/yr
For passive investors: Depreciation is non-cash, so a rental often shows a tax loss while cash-flowing — sheltering income. Rental losses are passive: they offset passive income freely, and up to $25,000/yr can offset ordinary (W-2) income if you actively participate and your MAGI is under $100k (phasing out to $0 by $150k); unused losses carry forward. On sale, claimed depreciation is recaptured at up to 25%, and gains may owe capital-gains tax (a 1031 exchange can defer both). Figures are a year-1 estimate at your 24.0% rate — not tax advice; consult a CPA.
Schools (NCES district)
- District
- Springtown ISD
- NCES district ID
- 4841280
- Math proficiency
- 36% ▼ -14.00%
- Reading proficiency
- 40% ▼ -2.00%
- Median HH income
- $56,136
- Composite
- 33.41/100
- National rank
- #5474
- State rank
- #435 of 826 in TX
Livability — Springtown
- Score
- 68/100
- State rank
- #461
- US rank
- #9298
Category grades
Schools grade is shown separately in the Schools card above.
Census & demographics
- County
- Parker County · 144,797 people
- City population
- 24,880
- Metro
- Dallas-Fort Worth-Arlington, TX
- Population (ZIP)
- 24,880
- Household income
- $92,485
- Rent vs Own
- Severe rent burden
- 333.0
Population outlook (Parker County) Hauer SSP2
- Today (2025)
- 147,426 people
- By 2030
- 157,863 · +7.1%
- By 2040
- 177,519 · +20.4%
- By 2050
- 194,786 · +32.1%
- By 2075
- 238,799 · +62.0%
- By 2100
- 264,126 · +79.2%
Race, ethnicity, and origin ACS 2023
- Neighborhood character
- Predominantly White (80%)
- Race & ethnicity
- White 80% Hispanic / Latino 13% Two or more races 11%
- Hispanic origin (detail)
- Mexican 12%
- Common ancestry
- Slovak 3% Lithuanian 2% Italian 2%
- Foreign-born
- 4% · Canada
- Languages at home
- 93% English-only · Spanish 6%
Political lean MEDSL · Parker
- 2024 margin
- Solid R (+66.4) · D 16.4% · R 82.8%
- 2008→2024 swing
- -11.2pp toward R · 2008: -55.2pp · 2024: -66.4pp
- All cycles
- 2024: R+66.4 2020: R+64.4 2016: R+67.5 2012: R+65.8 2008: R+55.2
Not yet ingested
- Civics
- —
Market trends
- HPI YoY
- ▼ -71.65%
- Current HPI
- 262.1991
- Rent YoY
- —
- Metro
- Dallas-Fort Worth-Arlington, TX
- State GDP YoY
- ▲ 3.95%
- F500 in state
- 110
Industry mix (Fortune 500 HQ in TX)
| Industry | F500 HQs | Revenue |
|---|---|---|
| Energy | 16 | $1,198B |
|
||
| Technology | 5 | $198B |
|
||
| Engineering / Construction | 4 | $72B |
|
||
| Energy Services | 3 | $60B |
|
||
| Utilities | 3 | $41B |
|
||
| Healthcare | 2 | $330B |
|
||
Price history
-11.2% since first listed9 events — show timeline
- 2026-06-04 Pending — NTREIS
- 2026-05-22 Contingent — NTREIS
- 2026-05-13 Listed $135,000 NTREIS
- 2017-04-18 Sold (Public Records) — Public Records
- 2013-03-22 Listing Removed — NTREIS
- 2011-09-22 Listing Removed — NTREIS
- 2011-09-18 Price Changed $129,500 NTREIS
- 2010-03-19 Listed $68,500 NTREIS
- 2010-03-19 Listed $152,000 NTREIS
Property tax history
+3.6%/yrLatest (2025): $2,015 · -3.4% YoY. Source: county tax records.
Cash-flow waterfall
monthlySold comps — $/sqft
last 12 mo · ≤1 miLoading sold comps…