4533 W Fern St · Egypt Lake-Leto, FL
Flood risk 1/10 · Minimal
- FEMA flood zone
- X (unshaded)
- Chance of flooding over 30 yrs
- 0.0%
- Est. flood insurance / yr
- $507 – $1,088
Fire risk 1/10 · Minimal
- Est. fire insurance / yr
- $947 – $1,759
Heat risk 10/10 · Severe
- Hot days now (above 106°F)
- 7 days/yr
- Hot days in 30 yrs
- 27 days/yr
Wind risk 9/10 · Severe
- Chance of severe wind over 30 yrs
- 99.0%
Air-quality risk 3/10 · Minor
- Unhealthy air days now
- 3 days/yr
- Unhealthy air days in 30 yrs
- 3 days/yr
Risk factors via First Street. Map © Google.
Why this score? — see what drove the C- grade
The composite is a weighted blend of 9 inputs, each scored 0–100. Each bar is that input's sub-score; the figure is the points it added to the 100-point composite (weight × sub-score).
- Cash flow +22.1/30.0
- ARV discount +7.5/15.0
- DSCR +7.1/10.0
- 1% rule +4.9/10.0
- Schools +4.2/10.0
- Livability +2.5/5.0
- Condition / age +2.5/5.0
- Rent growth +2.2/5.0
- Appreciation +0.0/10.0
$250,000
🖨 Deal sheet 📄 Offer letter ✓ Due diligence
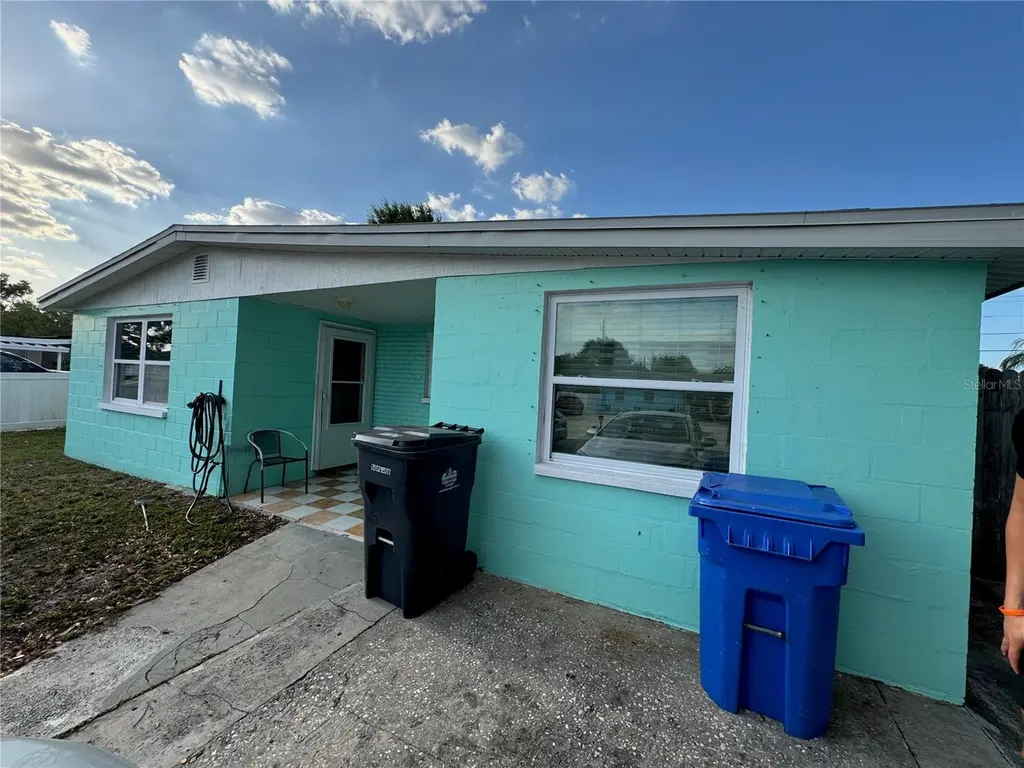
Listing remarks
Under contract-accepting backup offers. Single family home near Veterans Expressway. Detached structure and fenced backyard.
Key facts
- 6,565 sq ft lot
- Built 1963
Property features AI
Finance
- Other: Homestead exemption indicated; Zoning: RSC-9
- Financial info: Lease restrictions apply
- HOA & community: No HOA/association
Exterior
- Parking: No parking information provided
- Security: No security features listed
- Utilities: Public water; Public sewer; Public utilities
- Home design: Single family residence; One story; Faces south; Entry level: 1
- Construction: Block construction; Shingle roof; Other roof material; Slab foundation; Built area ~1717 square feet
- Exterior features: Paved road access; Lot about 0.15 acres
Interior
- Kitchen: Range; Refrigerator
- Bedrooms: 5 bedrooms
- Flooring: Tile
- Bathrooms: 2 full bathrooms
- Heating & cooling: Central heating; Central air conditioning
- Interior features: No notable interior features listed
- Laundry & utility: Washer hookup; Other laundry feature
Neighborhood map
What this means for you Summary
Snapshot
- This is a 3-bed/2.0-bath single-family listed at $250k.
Deal economics
- At list price, monthly cash flow is $404 ($5k/yr) — positive.
- The deal already cash-flows at list — no discount required.
- To meet the 1% rule (rent ≥ 1% of price), the offer needs to be $246k (1.4% below list).
- Recommended offer: $246k (1.4% below list) — sets the bar for 1% rule.
Location & tenants
- Location reads: area grade C — affects rentability + tenant quality, not the cash-flow math above.
- Hillsborough (suburban): math 47% / reading 50% proficiency, ranked #41 of 73 in FL (top 56%) — families likely to look elsewhere, expect single-tenant / working-renter base with shorter leases.
- Market conditions: Rents soft (-1.2%/yr); 209 active listings in the ZIP; 24 comparable units currently listed for rent nearby; rentals at typical pace (median 21d on market — plan ~3-4 weeks tenant-placement turnaround); 9,053 units permitted in Hillsborough County in 2024 (4,555 in 5+ unit buildings).
- At $2,465/mo this rent would consume 59% of the median local household income ($50k/yr) (locally 3363% of renters already pay >50% of income on rent) — very limited rent-growth headroom before tenants either downsize or default.
Forward outlook
- Local home prices are declining (-3.0%/yr); year-one equity from $2k of loan paydown is wiped out by about $8k of value loss. Plan a longer hold.
- Hillsborough County population projected at +37% by 2050 — long-run rental-demand tailwind backs the buy-and-hold thesis.
Negotiation context
- Only 1 days on market — expect competitive offers; lowballing is unlikely to land.
- 6 sale attempts since 18y ago with the ask held roughly flat each time — persistent listings suggest the price (not the market) is what's stuck; bring a comps-based counter.
- Current owner paid $35k; list at $250k implies a 620% gain — meaningful room to come down on a strong offer.
Risks & watch-outs
- Climate carrying-cost: severe wind risk, 99% chance of damaging wind over 30y; extreme-heat days projected 7→27/yr by 2055 (HVAC capex compounding) — expect insurance premiums to compound above CPI over the hold.
Questions for the listing agent
- Built in 1963 — when were the roof, HVAC, electrical panel, plumbing, and water heater last replaced?
- Is there a deadline driving the sale (1031 exchange, divorce, estate, relocation)? That informs how much negotiation room exists.
- What's the average days-on-market for RENTAL listings here right now (not sales)? A rising rental-DOM trend means longer vacancies and softer asking-rent achievability than the comps imply.
- What's the recent tenant-quality profile in this submarket — average credit score on applications, eviction rate, late-payment / NSF rate, and stable-employment percentage? A property-management company in the area should have these aggregated.
- How much new for-sale + rental construction is in the pipeline within 1–3 miles? Heavy new supply typically softens prices + rents 12–24 months out; constrained supply supports both.
Investment metrics
- 1% rule
- 0.99% ✗
- Cap rate
- 8.23%
- Cash-on-cash
- 6.92%
- DSCR
- 1.31
- GRM
- 8.5
CMA / ARV
No comps found within radius.
Projected returns pro-forma
-3.0% appreciation · 0.0% rent growth · sell at horizon
- IRR
- -8.9%
- Equity multiple
- 0.68×
- Total profit
- $-22,099
- Equity at exit
- $37,276
- IRR
- -3.5%
- Equity multiple
- 0.79×
- Total profit
- $-14,360
- Equity at exit
- $21,615
Cash invested: $70,000 (down + closing). Projections, not guarantees.
Landlord ↔ Tenant lean methodology
- Overall (STATE)
- 87 Strongly Landlord-Friendly
- State Florida
- 87 Strongly Landlord-Friendly · R+3
- County
- — inherits STATE
- City
- — inherits STATE
ZIP-level market 33614
- Home prices YoY
- -21.7%
- Rents YoY
- -1.2%
- Active inventory
- 209
- Price-to-rent
- 8.5×
Monthly cashflow live
- Estimated rent
- $2,465 high interval (Pro) →
- Mortgage (P&I)
- −$1,311
- Tax from tax record
- −$128 /mo · $1,538/yr
- Insurance
- −$104
- HOA
- −$0
- Vacancy / Maint / Mgmt
- −$518
- Net cashflow
- $404
Break-even live
UW: 25.0% down · 7.5% · 30yr · 1.5% tax · 5.0% vac · 8.0% maint · 8.0% mgmt
Financing live
Cash to close
- Down payment
- $62,500
- Closing costs
- $7,500
- Reserves months
- —
- Total cash needed
- —
Loan-product check · same deal, 3 products live
Conventional
25% down · 7.5% · 30yr
- Down + closing
- —
- Monthly P&I
- —
- Monthly cashflow
- —
- DSCR
- —
- Eligible?
- —
Personal DTI + credit; lowest rate.
DSCR
20% down · 8.5% · 30yr
- Down + closing
- —
- Monthly P&I
- —
- Monthly cashflow
- —
- DSCR
- —
- Eligible?
- —
No personal income docs; deal must DSCR.
Hard money
10% down · 12.0% · 12mo
- Down + closing
- —
- Monthly P&I
- —
- Monthly cashflow
- —
- DSCR
- —
- Eligible?
- —
Short-term bridge; refi at stabilization.
Rent comps 24 comps
| Address | Beds | Baths | Sqft | Rent | $/sqft | DOM | Units | Dist |
|---|---|---|---|---|---|---|---|---|
| 4518 W Knollwood St Tampa, FL | 3.0 | 1.5 | 1075 | $2,000 | $1.86 | 24d | 1 | 0.22mi |
| 3812 W Fern St Tampa, FL | 2.0 | 2.5 | 1383 | $2,800 | $2.02 | 15d | 1 | 0.34mi |
| 6804 N Hubert Ave Tampa, FL | 3.0 | 2.0 | 2199 | $2,850 | $1.30 | 18d | 1 | 0.53mi |
| 7210 N Manhattan Ave Tampa, FL | 2.0–4.0 | 1.0–2.0 | 1136 | $1,816 | $1.60 | 22d | 3 | 0.77mi |
| 7565 Gesualdo Ct Tampa, FL | 3.0 | 2.5 | 1582 | $2,900 | $1.83 | 18d | 1 | 0.91mi |
| 7573 Gesualdo Ct Tampa, FL | 3.0 | 2.5 | 1582 | $2,900 | $1.83 | 18d | 1 | 0.91mi |
| 7583 Gesualdo Ct Tampa, FL | 3.0 | 2.5 | 1582 | $2,900 | $1.83 | 18d | 1 | 0.92mi |
| 7593 Gesualdo Ct Tampa, FL | 3.0 | 2.5 | 1582 | $2,900 | $1.83 | 18d | 1 | 0.92mi |
| 6212 N Church Ave Tampa, FL | 1.0–2.0 | 1.0–2.5 | 1060 | $2,800 | $2.64 | 2d | 17 | 0.93mi |
| 6216 N Church Ave Unit 302 Tampa, FL | 3.0 | 2.5 | 1383 | $3,100 | $2.24 | 24d | 1 | 0.94mi |
| 6216 N Church Ave Tampa, FL | 1.0–3.0 | 1.0–2.5 | 1060 | $3,100 | $2.92 | 24d | 31 | 0.94mi |
| 6216 N Church Ave Unit 216 Tampa, FL | 2.0 | 2.5 | 1383 | $2,800 | $2.02 | 24d | 1 | 0.94mi |
| 7520 N Coolidge Ave Tampa, FL | 3.0 | 2.0 | 1902 | $3,500 | $1.84 | 20d | 1 | 0.95mi |
| 5820 N Church Ave Tampa, FL | 1.0–2.0 | 1.0–2.0 | 840 | $1,600 | $1.90 | 20d | 2 | 0.98mi |
| 5820 N Church Ave Tampa, FL | 1.0–2.0 | 1.0–2.0 | 963 | $1,550 | $1.61 | 2d | 2 | 0.98mi |
| 5820 N Church Ave Tampa, FL | 1.0–2.0 | 1.0–2.0 | 840 | $1,600 | $1.90 | 24d | 3 | 0.98mi |
| 4340 Villa Alina Ct Tampa, FL | 3.0 | 2.5 | 1632 | $4,500 | $2.76 | 24d | 1 | 1.03mi |
| 4338 Villa Alina Ct Tampa, FL | 3.0 | 2.5 | 1632 | $2,900 | $1.78 | 24d | 1 | 1.04mi |
| 3804 W Hamilton Ave Tampa, FL | 3.0 | 2.0 | 1582 | $2,600 | $1.64 | 24d | 1 | 1.20mi |
| 3436 Sunrise Villas Ct N Tampa, FL | 2.0 | 1.0 | 1066 | $1,773 | $1.66 | 24d | 1 | 1.40mi |
| 6014 Southern Comfort Blvd Tampa, FL | 4.0 | 3.0 | 1853 | $2,295 | $1.24 | 14d | 1 | 1.40mi |
| 3416 Sunrise Villas Ct N Tampa, FL | 2.0 | 1.5 | 1240 | $1,695 | $1.37 | 20d | 1 | 1.43mi |
| 3416 Sunrise Villas Ct N Tampa, FL | 2.0 | 2.0 | 1240 | $1,695 | $1.37 | 15d | 1 | 1.43mi |
| 5505 N Himes Ave Tampa, FL | 1.0–3.0 | 1.0–2.0 | 1092 | $1,825 | $1.67 | 3d | 8 | 1.48mi |
Listing history 12 events
-
2026-05-06status Pending
-
2026-05-06$250,000 Active
-
2023-04-04status Pending
-
2023-03-29$315,000 Active
-
2010-12-15$114,900
-
2010-12-11historical
-
2010-11-10$114,900
-
2010-11-10historical
-
2010-08-15$114,900
-
2008-08-09historical
-
2008-04-27$150,000
-
1980-06-01soldstatus $34,700
ⓘ Source: listings_history table (triggers on properties + properties_extension) + one-shot
backfill from property_details.listing_events for pre-trigger history.
Tax reassessment forecast FL · Resets to sale price
- Current annual tax
- $1,538 · $128/mo
- Projected year-2 tax
- $2,075 · $173/mo
- Expected delta
- +$537/yr (+$45/mo · 34.9%)
ⓘ Screening estimate from a state-policy table — verify with the county assessor before closing.
Climate risk First Street
- Flood 1/10 Low FEMA zone X (unshaded) · 0% chance over 30 yrs
- Wildfire 1/10 Low
- Heat 10/10 Extreme 7 d/yr ≥106°F today · 27 d/yr by 30 yrs out
- Wind 9/10 Extreme 99% chance of damaging wind over 30 yrs
- Air quality 3/10 Moderate 3 unhealthy d/yr today · 3 by 30 yrs out
Nearby sold comps map
Loading sold comps map…
Walkable amenities ~0.75 mi
Loading nearby amenities…
Taxation est. · year 1
- Rental income
- $29,575
- − Mortgage interest
- −$14,004
- − Property taxes
- −$1,538
- − Insurance
- −$1,250
- − Repairs & maintenance
- −$2,366
- − Management
- −$2,366
- − Depreciation
- −$7,273
- Taxable income
- $779
- Est. tax owed @ 24.0%
- −$187
- After-tax cash flow
- $4,657/yr
For passive investors: Depreciation is non-cash, so a rental often shows a tax loss while cash-flowing — sheltering income. Rental losses are passive: they offset passive income freely, and up to $25,000/yr can offset ordinary (W-2) income if you actively participate and your MAGI is under $100k (phasing out to $0 by $150k); unused losses carry forward. On sale, claimed depreciation is recaptured at up to 25%, and gains may owe capital-gains tax (a 1031 exchange can defer both). Figures are a year-1 estimate at your 24.0% rate — not tax advice; consult a CPA.
Schools (NCES district)
- District
- Hillsborough
- NCES district ID
- 1200870
- Math proficiency
- 47% ▼ -8.00%
- Reading proficiency
- 50% ▼ -4.00%
- Median HH income
- $50,622
- Composite
- 41.6/100
- National rank
- #3435
- State rank
- #41 of 73 in FL
Livability — Egypt Lake-Leto
No livability data for this city. (Only ~50 U.S. cities are tracked.)
Census & demographics
- Census place
- Egypt Lake-Leto, FL
- County
- Hillsborough County · 1,540,968 people
- City population
- 47,298
- Metro
- Tampa-St. Petersburg-Clearwater, FL
- Population (ZIP)
- 47,298
- Household income
- $50,232
- Rent vs Own
- Severe rent burden
- 3363.0
Population outlook (Hillsborough County) Hauer SSP2
- Today (2025)
- 1,607,022 people
- By 2030
- 1,733,968 · +7.9%
- By 2040
- 1,979,565 · +23.2%
- By 2050
- 2,203,427 · +37.1%
- By 2075
- 2,667,893 · +66.0%
- By 2100
- 2,891,558 · +79.9%
Race, ethnicity, and origin ACS 2023
- Neighborhood character
- Predominantly Hispanic (67%)
- Race & ethnicity
- Hispanic / Latino 67% Two or more races 37% White 18% Black 9% Asian 4%
- Hispanic origin (detail)
- Mexican 3% Puerto Rican 14% Cuban 32% Dominican 4%
- Common ancestry
- Romanian 1% Slovak 1%
- Foreign-born
- 44% · Canada, Jamaica, Vietnam
- Languages at home
- 36% English-only · Spanish 58% Vietnamese 2% Other Indo-European 1%
Political lean MEDSL · Hillsborough
- 2024 margin
- Toss-up / Even · D 47.8% · R 50.9% · Other 1.3%
- 2008→2024 swing
- -10.2pp toward R · 2008: 7.1pp · 2024: -3.1pp
- All cycles
- 2024: R+3.1 2020: D+6.9 2016: D+6.8 2012: D+6.7 2008: D+7.1
Not yet ingested
- Civics
- —
Market trends
- HPI YoY
- ▼ -138.33%
- Current HPI
- 498.3567
- Rent YoY
- ▼ -1.24%
- Metro
- Tampa-St. Petersburg-Clearwater, FL
- State GDP YoY
- ▲ 3.28%
- F500 in state
- 36
Industry mix (Fortune 500 HQ in FL)
| Industry | F500 HQs | Revenue |
|---|---|---|
| Industrial Technology | 2 | $29B |
|
||
| Insurance | 2 | $17B |
|
||
| Retail | 1 | $60B |
|
||
| Technology Distribution | 1 | $58B |
|
||
| Homebuilding | 1 | $35B |
|
||
| Technology Manufacturing | 1 | $35B |
|
||
Price history
+620.5% since first listed12 events — show timeline
- 2026-05-06 Pending — Stellar MLS as Distributed by MLS Grid
- 2026-05-06 Listed $250,000 Stellar MLS as Distributed by MLS Grid
- 2023-04-04 Pending — Stellar MLS as Distributed by MLS Grid
- 2023-03-29 Listed $315,000 Stellar MLS as Distributed by MLS Grid
- 2010-12-15 Listed $114,900 Stellar MLS as Distributed by MLS Grid
- 2010-12-11 Listing Removed — Stellar MLS as Distributed by MLS Grid
- 2010-11-10 Listing Removed — Stellar MLS as Distributed by MLS Grid
- 2010-11-10 Listed $114,900 Stellar MLS as Distributed by MLS Grid
- 2010-08-15 Listed $114,900 Stellar MLS as Distributed by MLS Grid
- 2008-08-09 Listing Removed — Stellar MLS as Distributed by MLS Grid
- 2008-04-27 Listed $150,000 Stellar MLS as Distributed by MLS Grid
- 1980-06-01 Sold (Public Records) $34,700 Public Records
Property tax history
+3.2%/yrLatest (2025): $1,538 · +7.6% YoY. Source: county tax records.
Cash-flow waterfall
monthlySold comps — $/sqft
last 12 mo · ≤1 miLoading sold comps…