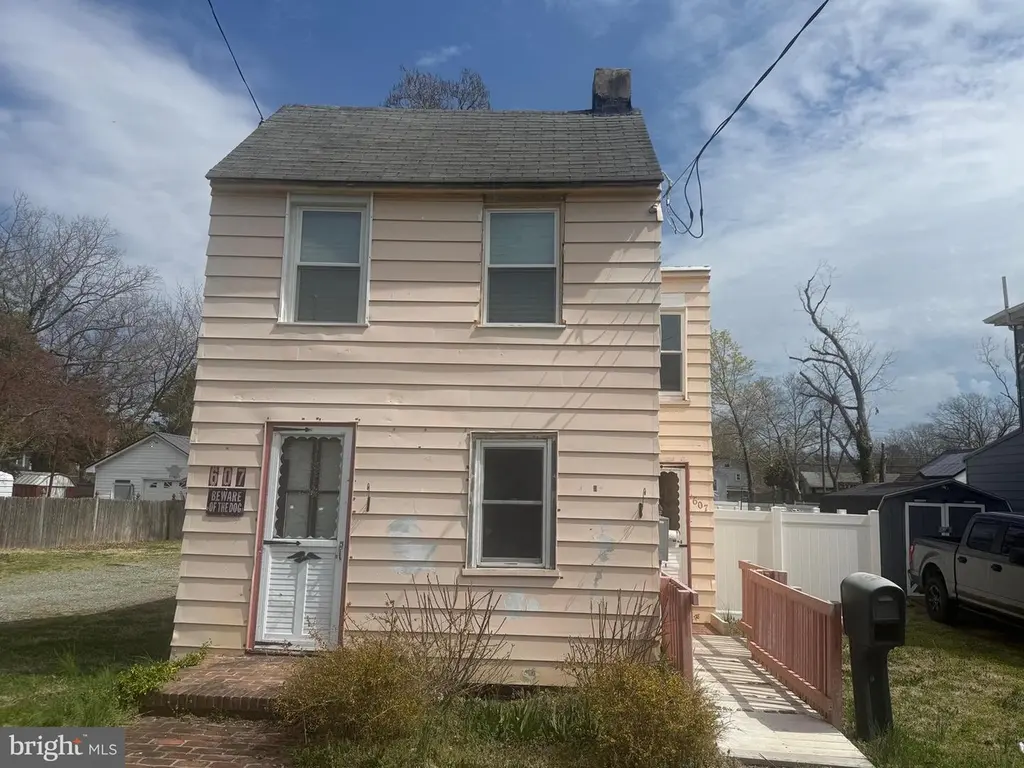
607 S 2nd St · Millville, NJ
Flood risk 1/10 · Minimal
- FEMA flood zone
- X (unshaded)
- Chance of flooding over 30 yrs
- 0.0%
- Est. flood insurance / yr
- $507 – $1,088
Fire risk 3/10 · Minor
- Est. fire insurance / yr
- $526 – $976
Heat risk 7/10 · Major
- Hot days now (above 103°F)
- 7 days/yr
- Hot days in 30 yrs
- 15 days/yr
Wind risk 7/10 · Major
- Chance of severe wind over 30 yrs
- 78.0%
Air-quality risk 3/10 · Minor
- Unhealthy air days now
- 2 days/yr
- Unhealthy air days in 30 yrs
- 4 days/yr
Risk factors via First Street. Map © Google.
Why this score? — see what drove the B grade
The composite is a weighted blend of 9 inputs, each scored 0–100. Each bar is that input's sub-score; the figure is the points it added to the 100-point composite (weight × sub-score).
- Cash flow +29.6/30.0
- ARV discount +15.0/15.0
- DSCR +10.0/10.0
- 1% rule +9.7/10.0
- Livability +3.2/5.0
- Rent growth +3.0/5.0
- Condition / age +2.5/5.0
- Schools +1.5/10.0
- Appreciation +0.0/10.0
$110,000
🖨 Deal sheet (PDF) 📄 Offer letter ✓ Due diligence
Listing remarks MLS
Investor special! Rehab in progress with major upgrades already completed, including partial foundation replacement. Electrical and plumbing have been started. Most finishing materials are included and on-site. Located in Millville, NJ with very affordable taxes. Property also features a large driveway, great yard space, and a nice-sized shed. Excellent opportunity to complete and add to your rental portfolio or flip.
Key facts
- 8,050 sq ft lot
- 6 parking spots
- Built 1837
Neighborhood map
What this means for you Summary
Snapshot
- This is a 2-bed/1.0-bath single-family listed at $110k.
Deal economics
- At list price, monthly cash flow is $398 ($5k/yr) — positive.
- The deal already cash-flows at list — no discount required.
- Meets the 1% rule at list price ($2k rent vs $110k).
- Recommended offer: $103k (6.0% below list) — sets the bar for market timing.
- Cap rate 10.6% vs local median 4.2% in Millville — top-decile yield for the area; either an underpriced asset or a hidden risk that comps aren't pricing in. Stress-test before assuming the spread holds.
Location & tenants
- Location reads 63/100 on livability (#431 in NJ) — a middle-class / working-renter tenant base. Strengths: housing A+, health & safety B+; Watch: crime F, amenities F, commute F.
- Millville School District (suburban): math 6% / reading 28% proficiency, ranked #447 of 472 in NJ (top 95%) — low school quality limits family demand, transient renter base, plan for 1-2y turnover; 60% free/reduced lunch — lower-income household profile, screen leases tightly.
- Zoned schools: R. M. Bacon Elementary School (math 2% / reading 17%, grade F, #1,235 of 1,303 statewide, top 96%, 258 students, 81% FRL); Lakeside Middle School (math 5% / reading 31%, grade F, #405 of 431 statewide, top 95%, 987 students, 70% FRL); Millville Senior High School (math 24% / reading 24%, grade F, #327 of 399 statewide, top 82%, 1,640 students, 68% FRL).
- Market conditions: Rents rising (+1.9%/yr); 297 active listings in the ZIP; 1 comparable units currently listed for rent nearby; 216 units permitted in Cumberland County in 2024 (73 in 5+ unit buildings).
Forward outlook
- Local home prices are declining (-3.0%/yr); year-one equity from $761 of loan paydown is wiped out by about $3k of value loss. Plan a longer hold.
- Cumberland County population projected to shrink 7% by 2050 — rents likely to lag national; underwrite the cash flow, not the appreciation.
- At projected returns (-3.0% appreciation + 1.9% rent growth), your $31k cash investment doubles in ~9 years — after that, you're playing with house money.
Negotiation context
- It's been on market 75 days — a 6% lower offer ($103k) is reasonable based on typical stale-listing flexibility.
- 3 sale attempts since 17y ago; this cycle's ask has dropped $35k (24%) from the opening price — seller is motivated, your offer sets the floor, not the list.
Risks & watch-outs
- Watch-outs: property tax is 2.8% of price; built in 1837 — expect roof / HVAC / electrical / plumbing capex.
- Climate carrying-cost: major wind risk, 78% chance of damaging wind over 30y; extreme-heat days projected 7→15/yr by 2055 (HVAC capex compounding) — expect insurance premiums to compound above CPI over the hold.
Questions for the listing agent
- It's been on market 75 days. Have you received any prior offers? Is the seller open to a 6% concession, seller financing, or rate buy-down credit?
- Built in 1837 — when were the roof, HVAC, electrical panel, plumbing, and water heater last replaced?
- Property tax is high relative to price — has the assessment been appealed recently, and will the sale trigger a re-assessment?
- Why hasn't it sold? Are there any deal-killer items the seller is aware of (foundation, flood, title, zoning, code violations)?
- Is there a deadline driving the sale (1031 exchange, divorce, estate, relocation)? That informs how much negotiation room exists.
- Schools are F-rated, which usually means shorter tenancies and higher turnover. Who's the typical renter profile here, and what's been the actual vacancy rate?
- Crime grade is F in this area — have there been break-ins, vandalism, or insurance claims at this property in the last 3 years? What carrier currently insures it and at what premium?
- What's the average days-on-market for RENTAL listings here right now (not sales)? A rising rental-DOM trend means longer vacancies and softer asking-rent achievability than the comps imply.
- What's the recent tenant-quality profile in this submarket — average credit score on applications, eviction rate, late-payment / NSF rate, and stable-employment percentage? A property-management company in the area should have these aggregated.
- How much new for-sale + rental construction is in the pipeline within 1–3 miles? Heavy new supply typically softens prices + rents 12–24 months out; constrained supply supports both.
Investment metrics
- 1% rule
- 1.47% ✓
- Cap rate
- 10.64%
- Cash-on-cash
- 15.51%
- DSCR
- 1.69
- GRM
- 5.7
CMA / ARV
- ARV (on-the-fly)
- $212,970
- Comps found
- 12
Show comp detail 12 sales within ~0.75 mi
| Address | Dist | Beds/Ba | Sqft | Sold | Price | $/sf | Match |
|---|---|---|---|---|---|---|---|
| 903 Shar Lane Blvd | 0.48mi | 2/1.0 | 896 (-4%) | 5mo | $205,000 | $229 | 67 |
| 605 Whitall Ave | 0.34mi | 3/1.0 (+1) | 912 (-2%) | 14mo | $243,000 | $266 | 64 |
| 908 Louis Dr | 0.40mi | 2/1.0 | 864 (-7%) | 9mo | $195,000 | $226 | 62 |
| 1002 Leonard Dr | 0.48mi | 2/1.0 | 896 (-4%) | 12mo | $237,500 | $265 | 62 |
| 10 Jackson Dr | 0.51mi | 2/1.0 | 870 (-6%) | 8mo | $106,400 | $122 | 58 |
| 153 S 2nd St S | 0.57mi | 3/1.0 (+1) | 893 (-4%) | 10mo | $199,500 | $223 | 54 |
| 17-19 S 5th St S | 0.62mi | 3/1.0 (+1) | 968 (+4%) | 8mo | $175,000 | $181 | 53 |
| 200 5th St S | 0.53mi | 2/1.0 | 1,009 (+8%) | 13mo | $199,900 | $198 | 50 |
| 500 Richard Dr | 0.75mi | 3/1.0 (+1) | 912 (-2%) | 13mo | $265,000 | $291 | 46 |
| 2 Cardinal Rd | 0.73mi | 3/1.0 (+1) | 1,010 (+9%) | 2mo | $293,000 | $290 | 45 |
| 533 Richard Dr | 0.74mi | 3/1.0 (+1) | 1,008 (+8%) | 3mo | $270,000 | $268 | 44 |
| 527 Brian Ave | 0.68mi | 3/1.0 (+1) | 1,044 (+12%) | 1mo | $165,000 | $158 | 42 |
Match score weights: distance 35% · size 25% · config 20% · recency 20%. Top-matched comps best support the ARV.
Projected returns pro-forma
-3.0% appreciation · 1.94% rent growth · sell at horizon
- IRR
- 5.0%
- Equity multiple
- 1.19×
- Total profit
- $5,920
- Equity at exit
- $16,401
- IRR
- 13.4%
- Equity multiple
- 2.02×
- Total profit
- $31,346
- Equity at exit
- $9,511
Cash invested: $30,800 (down + closing). Projections, not guarantees.
Landlord ↔ Tenant lean methodology
- Overall (STATE)
- 21 Tenant-Leaning
- State New Jersey
- 21 Tenant-Leaning · D+6
- County
- — inherits STATE
- City
- — inherits STATE
ZIP-level market 08332
- Home prices YoY
- -28.9%
- Rents YoY
- 1.9%
- Active inventory
- 297
- Price-to-rent
- 5.7×
Monthly cashflow live
- Estimated rent
- $1,616 medium interval (Pro) →
- Mortgage (P&I)
- −$577
- Tax from tax record
- −$256 /mo · $3,066/yr
- Insurance
- −$46
- HOA
- −$0
- Vacancy / Maint / Mgmt
- −$339
- Net cashflow
- $398
Break-even live
Sensitivity live
| Price | -10% $460 | -5% $429 | +0% $398 | +5% $367 | +10% $336 |
|---|---|---|---|---|---|
| Rent | -10% $270 | -5% $334 | +0% $398 | +5% $462 | +10% $526 |
| Rate | -1.0pp $453 | -0.5pp $426 | base $398 | +0.5pp $370 | +1.0pp $341 |
UW: 25.0% down · 7.5% · 30yr · 1.5% tax · 5.0% vac · 8.0% maint · 8.0% mgmt
Financing live
Cash to close
- Down payment
- $27,500
- Closing costs
- $3,300
- Reserves months
- —
- Total cash needed
- —
Loan-product check · same deal, 3 products live
Conventional
25% down · 7.5% · 30yr
- Down + closing
- —
- Monthly P&I
- —
- Monthly cashflow
- —
- DSCR
- —
- Eligible?
- —
Personal DTI + credit; lowest rate.
DSCR
20% down · 8.5% · 30yr
- Down + closing
- —
- Monthly P&I
- —
- Monthly cashflow
- —
- DSCR
- —
- Eligible?
- —
No personal income docs; deal must DSCR.
Hard money
10% down · 12.0% · 12mo
- Down + closing
- —
- Monthly P&I
- —
- Monthly cashflow
- —
- DSCR
- —
- Eligible?
- —
Short-term bridge; refi at stabilization.
Rent comps 1 comps
| Address | Beds | Baths | Sqft | Rent | $/sqft | DOM | Units | Dist |
|---|---|---|---|---|---|---|---|---|
| 301 N Wade Blvd Millville, NJ | 1.0–2.0 | 1.0 | 1005 | $1,715 | $1.71 | 15d | 10 | 1.21mi |
Listing history 27 events
-
2026-06-22days on market $110,000 Active 75 DOM
-
2026-06-19days on market $110,000 Active 73 DOM
-
2026-06-18days on market $110,000 Active 72 DOM
-
2026-06-17days on market $110,000 Active 71 DOM
-
2026-06-16days on market $110,000 Active 70 DOM
-
2026-06-15days on market $110,000 Active 69 DOM
-
2026-06-14days on market $110,000 Active 67 DOM
-
2026-06-13days on market $110,000 Active 66 DOM
-
2026-06-10days on market $110,000 Active 64 DOM
-
2026-06-09days on market $110,000 Active 63 DOM
-
2026-06-08days on market $110,000 Active 62 DOM
-
2026-06-07days on market $110,000 Active 61 DOM
-
2026-06-02pricedays on market $110,000 Active 56 DOM
-
2026-06-01days on market $135,000 Active 55 DOM
-
2026-05-31days on market $135,000 Active 54 DOM
-
2026-05-30days on market $135,000 Active 53 DOM
-
2026-05-06price $135,000 421-char remark
Show marketing remark (421 chars)
Investor special! Rehab in progress with major upgrades already completed, including partial foundation replacement. Electrical and plumbing have been started. Most finishing materials are included and on-site. Located in Millville, NJ with very affordable taxes. Property also features a large driveway, great yard space, and a nice-sized shed. Excellent opportunity to complete and add to your rental portfolio or flip.
-
2026-04-07$145,000 Active 421-char remark
Show marketing remark (421 chars)
Investor special! Rehab in progress with major upgrades already completed, including partial foundation replacement. Electrical and plumbing have been started. Most finishing materials are included and on-site. Located in Millville, NJ with very affordable taxes. Property also features a large driveway, great yard space, and a nice-sized shed. Excellent opportunity to complete and add to your rental portfolio or flip.
-
2025-06-10soldstatus $107,000
-
2025-05-30soldstatus $107,000 Closed 232-char remark
Show marketing remark (232 chars)
This Property is occupied, and occupants are not to be disturbed or contacted under any Circumstances. Interior inspections are not available, and property is being sold "AS IS". Please agent remarks before call the agent.
-
2025-05-04historical Active Under Contract 232-char remark
Show marketing remark (232 chars)
This Property is occupied, and occupants are not to be disturbed or contacted under any Circumstances. Interior inspections are not available, and property is being sold "AS IS". Please agent remarks before call the agent.
-
2025-04-21$120,000 Active 232-char remark
Show marketing remark (232 chars)
This Property is occupied, and occupants are not to be disturbed or contacted under any Circumstances. Interior inspections are not available, and property is being sold "AS IS". Please agent remarks before call the agent.
-
2009-07-16soldstatus $77,500
-
2009-06-30soldstatus $77,500
-
2009-05-18historical
-
2009-03-20$79,900
-
1996-04-03soldstatus $61,700
ⓘ Source: listings_history table (triggers on properties + properties_extension) + one-shot
backfill from property_details.listing_events for pre-trigger history.
Tax reassessment forecast NJ · Partial reset (capped growth)
- Current annual tax
- $3,066 · $256/mo
- Projected year-2 tax
- $3,066 · $256/mo
- Expected delta
- $0/yr ($0/mo · 0.0%)
ⓘ Screening estimate from a state-policy table — verify with the county assessor before closing.
Climate risk First Street
- Flood 1/10 Low FEMA zone X (unshaded) · 0% chance over 30 yrs
- Wildfire 3/10 Moderate
- Heat 7/10 Severe 7 d/yr ≥103°F today · 15 d/yr by 30 yrs out
- Wind 7/10 Severe 78% chance of damaging wind over 30 yrs
- Air quality 3/10 Moderate 2 unhealthy d/yr today · 4 by 30 yrs out
Nearby sold comps map
Loading sold comps map…
Walkable amenities ~0.75 mi
Loading nearby amenities…
Taxation est. · year 1
- Rental income
- $19,386
- − Mortgage interest
- −$6,162
- − Property taxes
- −$3,066
- − Insurance
- −$550
- − Repairs & maintenance
- −$1,551
- − Management
- −$1,551
- − Depreciation
- −$3,200
- Taxable income
- $3,307
- Est. tax owed @ 24.0%
- −$794
- After-tax cash flow
- $3,983/yr
For passive investors: Depreciation is non-cash, so a rental often shows a tax loss while cash-flowing — sheltering income. Rental losses are passive: they offset passive income freely, and up to $25,000/yr can offset ordinary (W-2) income if you actively participate and your MAGI is under $100k (phasing out to $0 by $150k); unused losses carry forward. On sale, claimed depreciation is recaptured at up to 25%, and gains may owe capital-gains tax (a 1031 exchange can defer both). Figures are a year-1 estimate at your 24.0% rate — not tax advice; consult a CPA.
Schools (NCES district)
- District
- Millville School District
- NCES district ID
- 3410320
- Math proficiency
- 6% ▼ -11.00%
- Reading proficiency
- 28% ▲ 1.00%
- Median HH income
- $48,851
- Composite
- 15.23/100
- National rank
- #9338
- State rank
- #447 of 472 in NJ
Livability — Millville
- Score
- 63/100
- State rank
- #431
- US rank
- #15561
Category grades
Schools grade is shown separately in the Schools card above.
Census & demographics
- Census place
- Millville, NJ
- County
- Cumberland County · 80,266 people
- City population
- 35,228
- Metro
- Vineland-Bridgeton, NJ
- Population (ZIP)
- 35,228
- Household income
- $67,496
- Rent vs Own
- Severe rent burden
- 1761.0
Population outlook (Cumberland County) Hauer SSP2
- Today (2025)
- 152,743 people
- By 2030
- 150,373 · -1.6%
- By 2040
- 146,881 · -3.8%
- By 2050
- 142,653 · -6.6%
- By 2075
- 129,468 · -15.2%
- By 2100
- 107,456 · -29.6%
Race, ethnicity, and origin ACS 2023
- Neighborhood character
- Diverse neighborhood (Simpson 0.60)
- Race & ethnicity
- White 59% Hispanic / Latino 17% Black 15% Two or more races 11% Asian 2%
- Hispanic origin (detail)
- Mexican 4% Puerto Rican 10%
- Common ancestry
- Romanian 4% Lithuanian 2% Slovak 1%
- Foreign-born
- 7% · Canada
- Languages at home
- 85% English-only · Spanish 11% Other Indo-European 1% Other Asian/Pacific 1%
Political lean MEDSL · Cumberland
- 2024 margin
- Toss-up / Even · D 47.6% · R 51.3% · Other 1.1%
- 2008→2024 swing
- -25.4pp toward R · 2008: 21.6pp · 2024: -3.8pp
- All cycles
- 2024: R+3.8 2020: D+6.0 2016: D+5.3 2012: D+23.1 2008: D+21.6
Not yet ingested
- Civics
- —
Market trends
- HPI YoY
- ▼ -111.45%
- Current HPI
- 274.8011
- Rent YoY
- ▲ 1.94%
- Metro
- Vineland-Bridgeton, NJ
- State GDP YoY
- ▲ 2.05%
- F500 in state
- 34
Industry mix (Fortune 500 HQ in NJ)
| Industry | F500 HQs | Revenue |
|---|---|---|
| Consumer Goods | 3 | $31B |
|
||
| Pharmaceuticals | 2 | $153B |
|
||
| Technology | 2 | $21B |
|
||
| Insurance | 2 | $20B |
|
||
| Healthcare | 2 | $19B |
|
||
| Financial Services | 1 | $70B |
|
||
Price history
+118.8% since first listed11 events — show timeline
- 2026-05-06 Price Changed $135,000 BRIGHT MLS
- 2026-04-07 Listed $145,000 BRIGHT MLS
- 2025-06-10 Sold (Public Records) $107,000 Public Records
- 2025-05-30 Sold (MLS) $107,000 BRIGHT MLS
- 2025-05-04 Contingent — BRIGHT MLS
- 2025-04-21 Listed $120,000 BRIGHT MLS
- 2009-07-16 Sold (Public Records) $77,500 Public Records
- 2009-06-30 Sold (MLS) $77,500 SJSRMLS
- 2009-05-18 Listing Removed — SJSRMLS
- 2009-03-20 Listed $79,900 SJSRMLS
- 1996-04-03 Sold (Public Records) $61,700 Public Records
Property tax history
+2.1%/yrLatest (2025): $3,066 · +3.3% YoY. Source: county tax records.
Cash-flow waterfall
monthlySold comps — $/sqft
last 12 mo · ≤1 miLoading sold comps…