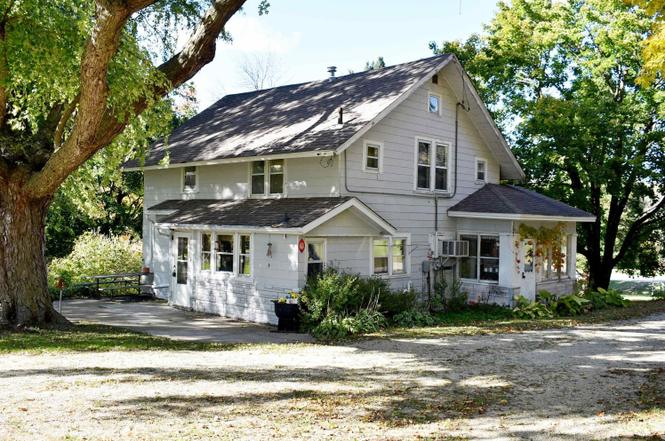
1468 Hwy 105 · St. Ansgar, IA
Flood risk 1/10 · Minimal
- FEMA flood zone
- X (unshaded)
- Chance of flooding over 30 yrs
- 0.0%
- Est. flood insurance / yr
- $473 – $860
Fire risk 3/10 · Minor
- Est. fire insurance / yr
- $902 – $1,676
Heat risk 2/10 · Minimal
- Hot days now (above 99°F)
- 7 days/yr
- Hot days in 30 yrs
- 16 days/yr
Wind risk 2/10 · Minimal
- Chance of severe wind over 30 yrs
- —
Air-quality risk 1/10 · Minimal
- Unhealthy air days now
- 0 days/yr
- Unhealthy air days in 30 yrs
- 0 days/yr
Risk factors via First Street. Map © Google.
Why this score? — see what drove the D grade
The composite is a weighted blend of 9 inputs, each scored 0–100. Each bar is that input's sub-score; the figure is the points it added to the 100-point composite (weight × sub-score).
- Cash flow +10.7/30.0
- ARV discount +7.5/15.0
- Appreciation +7.4/10.0
- Schools +7.0/10.0
- DSCR +3.1/10.0
- Rent growth +2.5/5.0
- Livability +2.5/5.0
- Condition / age +2.5/5.0
- 1% rule +1.9/10.0
$184,900
🖨 Deal sheet (PDF) 📄 Offer letter ✓ Due diligence
Listing remarks
Here's your opportunity to own 2 acres along a hard surface road just outside the city limits of St. Ansgar, Iowa! This property offers a prime location with plenty of room to grow and many possibilities-whether you're looking to update the existing home, build your dream home, or even explore subdividing options. The current 2-story home features 4 bedrooms (including one on the main floor), 1 1/2 bathrooms, kitchen with eating area, formal dining room, comfy living room, main floor laundry and an enclosed front porch. Outside you'll find a pole shed and additional yard shed- perfect for storage, hobbies, or small projects. Enjoy country living with the convenience of being close to town-
Key facts
- Hard surface road
- Pole shed
- 2 acres
Tags
Property features AI
Exterior
- Parking: No designated parking
- Utilities: Private well water; Public sewer
- Home design: Single-family residential property
- Construction: Slate and asphalt/shingle roof
- Exterior features: Enclosed porch/patio; Barn(s); Irregular-shaped 2-acre lot; Gravel road access
Interior
- Kitchen: Gas water heater
- Bathrooms: 1 full bathroom; 1 half bathroom
- Heating & cooling: Forced air heating (natural gas); Window air conditioning units
- Interior features: Eat-in kitchen; Partially finished basement with interior entry
- Laundry & utility: Laundry on main level
Neighborhood map
What this means for you Summary
Snapshot
- This is a 4-bed/1.5-bath single-family listed at $185k.
Deal economics
- At list price, monthly cash flow is $-90 ($-1k/yr) — negative.
- To cash-flow at today's rent, offer at most $169k (8.6% below list).
- To meet the 1% rule (rent ≥ 1% of price), the offer needs to be $127k (31.4% below list).
- Recommended offer: $127k (31.4% below list) — sets the bar for 1% rule.
Location & tenants
- Location reads: area grade D — affects rentability + tenant quality, not the cash-flow math above.
- St Ansgar Community School District (rural): math 84% / reading 82% proficiency, ranked #16 of 289 in IA (top 6%) — strong family-tenant draw, lease renewals of 3-5y typical.
- Zoned schools: St Ansgar Elementary School (math 82% / reading 77%, grade A, #71 of 616 statewide, top 15%, 320 students, 24% FRL); St Ansgar Middle School (math 87% / reading 82%, grade A+, #10 of 246 statewide, top 4%, 117 students, 25% FRL); St Ansgar High School (math 82% / reading 87%, grade A, #14 of 336 statewide, top 4%, 171 students, 25% FRL) — zoned schools at 24% FRL track the district average.
- Market conditions: 22 active listings in the ZIP; 41 units permitted in Mitchell County in 2024 (0 in 5+ unit buildings).
Forward outlook
- In year one you build about $10k of equity ($1k loan paydown + $9k appreciation (4.8% local appreciation)).
- Mitchell County population projected to shrink 4% by 2050 — rents likely to lag national; underwrite the cash flow, not the appreciation.
- By year 4, paydown + projected appreciation supports a ~$34k cash-out refi (75% LTV) — recoverable capital for the next deal without selling this one.
Negotiation context
- It's been on market 248 days — a 12% lower offer ($163k) is reasonable based on typical stale-listing flexibility.
Risks & watch-outs
- Watch-outs: built in 1900 — expect roof / HVAC / electrical / plumbing capex.
Questions for the listing agent
- What do current leases actually rent for vs. the listed asking? Can we see a recent rent roll and the last 12 months of T-12 income?
- It's been on market 248 days. Have you received any prior offers? Is the seller open to a 31% concession, seller financing, or rate buy-down credit?
- Built in 1900 — when were the roof, HVAC, electrical panel, plumbing, and water heater last replaced?
- Why hasn't it sold? Are there any deal-killer items the seller is aware of (foundation, flood, title, zoning, code violations)?
- Is there a deadline driving the sale (1031 exchange, divorce, estate, relocation)? That informs how much negotiation room exists.
- The area grade is low — what's the realistic commute time and amenity access for the typical tenant pool here? Any planned neighborhood developments (good or bad) we should know about?
- What's the average days-on-market for RENTAL listings here right now (not sales)? A rising rental-DOM trend means longer vacancies and softer asking-rent achievability than the comps imply.
- What's the recent tenant-quality profile in this submarket — average credit score on applications, eviction rate, late-payment / NSF rate, and stable-employment percentage? A property-management company in the area should have these aggregated.
- How much new for-sale + rental construction is in the pipeline within 1–3 miles? Heavy new supply typically softens prices + rents 12–24 months out; constrained supply supports both.
Investment metrics
- 1% rule
- 0.69% ✗
- Cap rate
- 5.71%
- Cash-on-cash
- -2.07%
- DSCR
- 0.91
- GRM
- 12.1
CMA / ARV
- ARV (on-the-fly)
- $117,780
- Comps found
- 5
Show comp detail 5 sales within ~0.75 mi
| Address | Dist | Beds/Ba | Sqft | Sold | Price | $/sf | Match |
|---|---|---|---|---|---|---|---|
| 112 S George St | 0.42mi | 3/2.0 (-1) | 1,533 (+2%) | 14mo | $120,000 | $78 | 59 |
| 314 S Mitchell St | 0.59mi | 3/1.5 (-1) | 1,724 (+14%) | 2mo | $112,500 | $65 | 42 |
| 513 W 5th St St | 0.40mi | 3/1.5 (-1) | 1,670 (+11%) | 24mo | $114,900 | $69 | 39 |
| 514 Boulder Ln Ln | 0.71mi | 3/2.0 (-1) | 1,680 (+11%) | 11mo | $370,000 | $220 | 32 |
| 203 W 8th St | 0.70mi | 3/2.0 (-1) | 1,618 (+7%) | 20mo | $190,000 | $117 | 32 |
Match score weights: distance 35% · size 25% · config 20% · recency 20%. Top-matched comps best support the ARV.
Projected returns pro-forma
4.75% appreciation · 3.0% rent growth · sell at horizon
- IRR
- 10.4%
- Equity multiple
- 1.66×
- Total profit
- $34,146
- Equity at exit
- $101,935
- IRR
- 11.9%
- Equity multiple
- 3.11×
- Total profit
- $109,307
- Equity at exit
- $173,618
Cash invested: $51,772 (down + closing). Projections, not guarantees.
Landlord ↔ Tenant lean methodology
- Overall (STATE)
- 83 Strongly Landlord-Friendly
- State Iowa
- 83 Strongly Landlord-Friendly · R+6
- County
- — inherits STATE
- City
- — inherits STATE
ZIP-level market 50472
- Home prices YoY
- 1.9%
- Active inventory
- 22
- Price-to-rent
- 12.1×
Monthly cashflow live
- Estimated rent
- $1,268 medium interval (Pro) →
- Mortgage (P&I)
- −$970
- Tax from tax record
- −$45 /mo · $538/yr
- Insurance
- −$77
- HOA
- −$0
- Vacancy / Maint / Mgmt
- −$266
- Net cashflow
- $-90
Break-even live
Sensitivity live
| Price | -10% $15 | -5% $-37 | +0% $-90 | +5% $-142 | +10% $-194 |
|---|---|---|---|---|---|
| Rent | -10% $-190 | -5% $-140 | +0% $-90 | +5% $-39 | +10% $11 |
| Rate | -1.0pp $4 | -0.5pp $-42 | base $-90 | +0.5pp $-137 | +1.0pp $-186 |
UW: 25.0% down · 7.5% · 30yr · 1.5% tax · 5.0% vac · 8.0% maint · 8.0% mgmt
Financing live
Cash to close
- Down payment
- $46,225
- Closing costs
- $5,547
- Reserves months
- —
- Total cash needed
- —
Loan-product check · same deal, 3 products live
Conventional
25% down · 7.5% · 30yr
- Down + closing
- —
- Monthly P&I
- —
- Monthly cashflow
- —
- DSCR
- —
- Eligible?
- —
Personal DTI + credit; lowest rate.
DSCR
20% down · 8.5% · 30yr
- Down + closing
- —
- Monthly P&I
- —
- Monthly cashflow
- —
- DSCR
- —
- Eligible?
- —
No personal income docs; deal must DSCR.
Hard money
10% down · 12.0% · 12mo
- Down + closing
- —
- Monthly P&I
- —
- Monthly cashflow
- —
- DSCR
- —
- Eligible?
- —
Short-term bridge; refi at stabilization.
Listing history 20 events
-
2026-06-21days on market $184,900 Active 248 DOM
-
2026-06-21days on market $184,900 Active 247 DOM
-
2026-06-18days on market $184,900 Active 245 DOM
-
2026-06-17price $184,900 Active 244 DOM
-
2026-06-17days on market $189,500 Active 244 DOM
-
2026-06-16days on market $189,500 Active 243 DOM
-
2026-06-15days on market $189,500 Active 242 DOM
-
2026-06-13days on market $189,500 Active 240 DOM
-
2026-06-12days on market $189,500 Active 239 DOM
-
2026-06-09days on market $189,500 Active 236 DOM
-
2026-06-08days on market $189,500 Active 235 DOM
-
2026-06-07days on market $189,500 Active 234 DOM
-
2026-06-07days on market $189,500 Active 233 DOM
-
2026-06-04days on market $189,500 Active 230 DOM
-
2026-06-02days on market $189,500 Active 229 DOM
-
2026-06-01days on market $189,500 Active 228 DOM
-
2026-05-31days on market $189,500 Active 227 DOM
-
2026-05-31days on market $189,500 Active 226 DOM
-
2026-04-16price $189,500
-
2025-10-15$194,900 Active
ⓘ Source: listings_history table (triggers on properties + properties_extension) + one-shot
backfill from property_details.listing_events for pre-trigger history.
Tax reassessment forecast IA · Partial reset (capped growth)
- Current annual tax
- $538 · $45/mo
- Projected year-2 tax
- $1,720 · $143/mo
- Expected delta
- +$1,182/yr (+$99/mo · 219.8%)
ⓘ Screening estimate from a state-policy table — verify with the county assessor before closing.
Climate risk First Street
- Flood 1/10 Low FEMA zone X (unshaded) · 0% chance over 30 yrs
- Wildfire 3/10 Moderate
- Heat 2/10 Low 7 d/yr ≥99°F today · 16 d/yr by 30 yrs out
- Wind 2/10 Low
- Air quality 1/10 Low 0 unhealthy d/yr today · 0 by 30 yrs out
Nearby sold comps map
Loading sold comps map…
Walkable amenities ~0.75 mi
Loading nearby amenities…
Taxation est. · year 1
- Rental income
- $15,220
- − Mortgage interest
- −$10,357
- − Property taxes
- −$538
- − Insurance
- −$924
- − Repairs & maintenance
- −$1,218
- − Management
- −$1,218
- − Depreciation
- −$5,379
- Taxable loss
- −$4,414
- Est. tax savings @ 24.0%
- +$1,059
- After-tax cash flow
- $-15/yr
For passive investors: Depreciation is non-cash, so a rental often shows a tax loss while cash-flowing — sheltering income. Rental losses are passive: they offset passive income freely, and up to $25,000/yr can offset ordinary (W-2) income if you actively participate and your MAGI is under $100k (phasing out to $0 by $150k); unused losses carry forward. On sale, claimed depreciation is recaptured at up to 25%, and gains may owe capital-gains tax (a 1031 exchange can defer both). Figures are a year-1 estimate at your 24.0% rate — not tax advice; consult a CPA.
Schools (NCES district)
- District
- St Ansgar Community School District
- NCES district ID
- 1925200
- Math proficiency
- 84% ▬ 0.00%
- Reading proficiency
- 82% ▲ 2.00%
- Median HH income
- $52,141
- Composite
- 70.36/100
- National rank
- #269
- State rank
- #16 of 289 in IA
Livability — St. Ansgar
No livability data for this city. (Only ~50 U.S. cities are tracked.)
Census & demographics
- Population (ZIP)
- 2,577
Population outlook (Mitchell County) Hauer SSP2
- Today (2025)
- 10,729 people
- By 2030
- 10,702 · -0.3%
- By 2040
- 10,632 · -0.9%
- By 2050
- 10,346 · -3.6%
- By 2075
- 9,770 · -8.9%
- By 2100
- 8,351 · -22.2%
Race, ethnicity, and origin ACS 2023
- Neighborhood character
- Predominantly White (95%)
- Race & ethnicity
- White 95% Hispanic / Latino 3% Two or more races 2%
- Common ancestry
- Portuguese 13% Iranian 3% Czech 1%
- Foreign-born
- 0%
- Languages at home
- 97% English-only · German/W. Germanic 1% Spanish 1%
Political lean MEDSL · Mitchell
- 2024 margin
- Solid R (+31.1) · D 33.8% · R 64.9% · Other 1.4%
- 2008→2024 swing
- -43.5pp toward R · 2008: 12.3pp · 2024: -31.1pp
- All cycles
- 2024: R+31.1 2020: R+27.9 2016: R+24.3 2012: D+3.4 2008: D+12.3
Not yet ingested
- Civics
- —
Market trends
- HPI YoY
- ▲ 4.75%
- Current HPI
- 250.531
- Rent YoY
- —
- Metro
- —
- State GDP YoY
- ▲ 2.48%
- F500 in state
- 4
Industry mix (Fortune 500 HQ in IA)
| Industry | F500 HQs | Revenue |
|---|---|---|
| Financial Services | 1 | $16B |
|
||
| Retail / Convenience | 1 | $15B |
|
||
Price history
-2.8% since first listed2 events — show timeline
- 2026-04-16 Price Changed $189,500 NEIRBR as distributed by MLS GRID
- 2025-10-15 Listed $194,900 NEIRBR as distributed by MLS GRID
Property tax history
-1.7%/yrLatest (2025): $538 · -9.4% YoY. Source: county tax records.
Cash-flow waterfall
monthlySold comps — $/sqft
last 12 mo · ≤1 miLoading sold comps…