14315 N Pennsylvania Ave Unit 13H · Oklahoma City, OK
Flood risk 1/10 · Minimal
- FEMA flood zone
- X (unshaded)
- Chance of flooding over 30 yrs
- 0.0%
- Est. flood insurance / yr
- $507 – $1,088
Fire risk 2/10 · Minimal
- Est. fire insurance / yr
- $2,463 – $4,575
Heat risk 6/10 · Moderate
- Hot days now (above 108°F)
- 7 days/yr
- Hot days in 30 yrs
- 19 days/yr
Wind risk 2/10 · Minimal
- Chance of severe wind over 30 yrs
- 4.0%
Air-quality risk 2/10 · Minimal
- Unhealthy air days now
- 1 days/yr
- Unhealthy air days in 30 yrs
- 1 days/yr
Risk factors via First Street. Map © Google.
Why this score? — see what drove the C- grade
The composite is a weighted blend of 9 inputs, each scored 0–100. Each bar is that input's sub-score; the figure is the points it added to the 100-point composite (weight × sub-score).
- Cash flow +13.9/30.0
- ARV discount +7.5/15.0
- Appreciation +6.4/10.0
- 1% rule +5.6/10.0
- DSCR +4.2/10.0
- Livability +4.0/5.0
- Rent growth +3.8/5.0
- Schools +3.6/10.0
- Condition / age +2.5/5.0
$139,900
🖨 Deal sheet (PDF) 📄 Offer letter ✓ Due diligence
Listing remarks
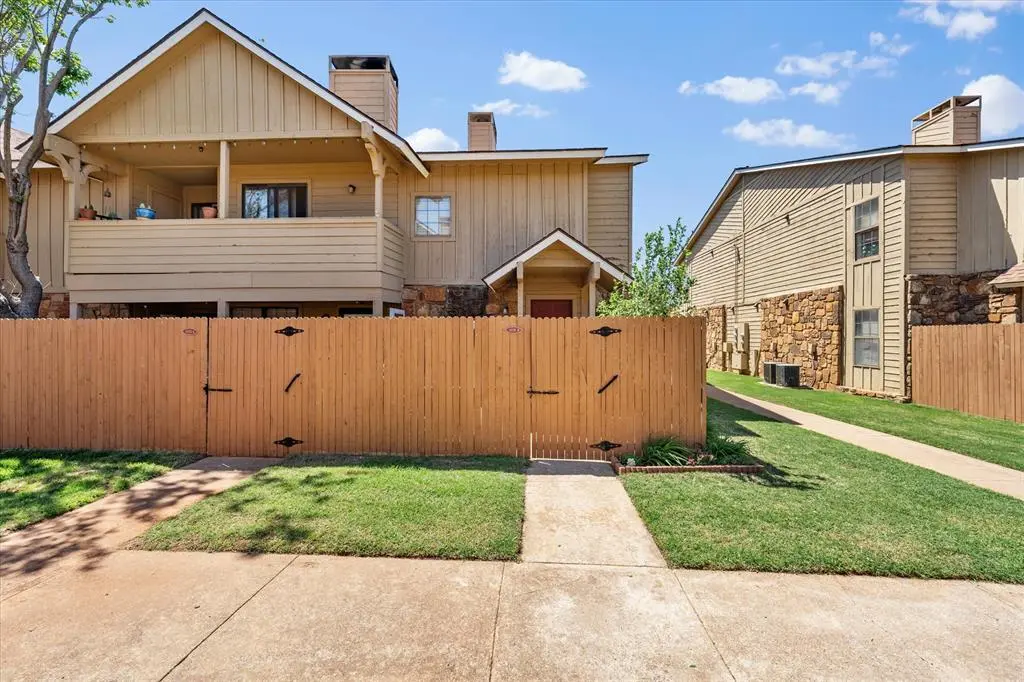
Well-kept 2-bedroom, 2-bath condo in a desirable Northwest Oklahoma City location, offering 1,134 square feet of easy, low-maintenance living. The interior features fresh paint and a practical, open layout designed for everyday comfort. Conveniently located near Quail Springs Mall, dining, and retail, this property also includes access to community amenities such as a pool, clubhouse, and shared recreational spaces. A great option for buyers seeking value and convenience in a sought-after area.
Key facts
- Clubhouse
- Community amenities
- Open layout
Tags
Property features AI
Finance
- Other: Occupied by owner; No home warranty; Infill lot
- Financial info: Financing options accepted: Cash, Conventional, FHA or VA; Assumable loans not available; Loan qualification possible
- HOA & community: Mandatory association dues; Association fee includes grounds maintenance, common area maintenance, pool, and recreation facility
Exterior
- Parking: No parking details provided
- Security: No security details provided
- Utilities: Electricity available; Natural gas available; High-speed internet available; Public utilities
- Home design: Condominium; One and one-half level unit; Residential property; Located in Quail Spgs Condo I
- Construction: Brick and frame construction; Composition roof; Slab foundation; Existing property
- Exterior features: Outdoor grill; Private outdoor pool
Interior
- Kitchen: Dishwasher; Disposal; Microwave; Refrigerator; Trash compactor
- Bedrooms: 2 bedrooms
- Flooring: No flooring details provided
- Bathrooms: 2 full bathrooms
- Heating & cooling: Electric heating
- Interior features: Gas-log fireplace; Trash compactor; Dishwasher; Disposal; Microwave; Refrigerator
- Laundry & utility: No separate laundry details provided
Neighborhood map
What this means for you Summary
Snapshot
- This is a 2-bed/2.0-bath condo listed at $140k.
Deal economics
- At list price, monthly cash flow is $15 ($181/yr) — positive.
- The deal already cash-flows at list — no discount required.
- Meets the 1% rule at list price ($1k rent vs $140k).
- Recommended offer: $136k (3.0% below list) — sets the bar for market timing.
- Cap rate 6.4% vs local median 3.7% in Oklahoma City — top-decile yield for the area; either an underpriced asset or a hidden risk that comps aren't pricing in. Stress-test before assuming the spread holds.
Location & tenants
- Location reads 80/100 on livability (#3 in OK, #1,635 nationally) — a professional / high-income tenant draw. Strengths: amenities A+, commute A+, cost of living A+; Watch: crime F.
- Edmond (suburban): math 38% / reading 40% proficiency, ranked #11 of 270 in OK (top 4%) — families likely to look elsewhere, expect single-tenant / working-renter base with shorter leases.
- Zoned schools: Scissortail Elementary School (331 students, 0% FRL); Summit Ms (math 22% / reading 27%, grade F, #97 of 345 statewide, top 31%, 940 students, 0% FRL); Santa Fe Hs (math 36% / reading 52%, grade F, #18 of 447 statewide, top 4%, 2,796 students, 0% FRL) — zoned schools average 0% FRL vs 22% district-wide (22 pts lower); this property's tenant base skews higher-income than the district average.
- Market conditions: Rents rising fast (+5.2%/yr); 42 active listings in the ZIP; 40 comparable units currently listed for rent nearby; rentals at typical pace (median 16d on market — plan ~3-4 weeks tenant-placement turnaround); 5,365 units permitted in Oklahoma County in 2024 (569 in 5+ unit buildings).
Forward outlook
- In year one you build about $5k of equity ($967 loan paydown + $4k appreciation (2.7% local appreciation)).
- Oklahoma County population projected at +41% by 2050 — long-run rental-demand tailwind backs the buy-and-hold thesis.
- At projected returns (2.7% appreciation + 5.2% rent growth), your $39k cash investment doubles in ~6 years — after that, you're playing with house money.
- By year 7, paydown + projected appreciation supports a ~$30k cash-out refi (75% LTV) — recoverable capital for the next deal without selling this one.
Negotiation context
- It's been on market 32 days — a 3% lower offer ($136k) is reasonable based on typical stale-listing flexibility.
- 6 sale attempts since 8y ago with the ask held roughly flat each time — persistent listings suggest the price (not the market) is what's stuck; bring a comps-based counter.
- Current owner paid $58k; list at $140k implies a 141% gain — meaningful room to come down on a strong offer.
Risks & watch-outs
- Climate carrying-cost: extreme-heat days projected 7→19/yr by 2055 (HVAC capex compounding) — expect insurance premiums to compound above CPI over the hold.
Questions for the listing agent
- It's been on market 32 days. Have you received any prior offers? Is the seller open to a 3% concession, seller financing, or rate buy-down credit?
- What does the HOA fee cover, when was the last increase, and are there any pending special assessments or reserve-fund shortfalls?
- Any open or pending special assessments — roof, HVAC, plumbing, elevator, façade? What's the per-unit balance and payoff schedule, and is the seller paying it off at close or rolling it to the buyer?
- Is there a deadline driving the sale (1031 exchange, divorce, estate, relocation)? That informs how much negotiation room exists.
- Schools are F-rated, which usually means shorter tenancies and higher turnover. Who's the typical renter profile here, and what's been the actual vacancy rate?
- Crime grade is F in this area — have there been break-ins, vandalism, or insurance claims at this property in the last 3 years? What carrier currently insures it and at what premium?
- What's the average days-on-market for RENTAL listings here right now (not sales)? A rising rental-DOM trend means longer vacancies and softer asking-rent achievability than the comps imply.
- What's the recent tenant-quality profile in this submarket — average credit score on applications, eviction rate, late-payment / NSF rate, and stable-employment percentage? A property-management company in the area should have these aggregated.
- How much new apartment / multifamily construction is in the pipeline within 1–3 miles? Heavy new supply (>2% of stock underway) typically softens rents 12–24 months out; light construction supports rent growth.
Investment metrics
- 1% rule
- 1.06% ✓
- Cap rate
- 6.42%
- Cash-on-cash
- 0.46%
- DSCR
- 1.02
- GRM
- 7.8
CMA / ARV
No comps found within radius.
Projected returns pro-forma
2.71% appreciation · 5.21% rent growth · sell at horizon
- IRR
- 8.6%
- Equity multiple
- 1.49×
- Total profit
- $19,217
- Equity at exit
- $60,660
- IRR
- 12.6%
- Equity multiple
- 2.92×
- Total profit
- $75,350
- Equity at exit
- $91,776
Cash invested: $39,172 (down + closing). Projections, not guarantees.
Landlord ↔ Tenant lean methodology
- Overall (STATE)
- 83 Strongly Landlord-Friendly
- State Oklahoma
- 83 Strongly Landlord-Friendly · R+20
- County
- — inherits STATE
- City
- — inherits STATE
ZIP-level market 73134
- Home prices YoY
- 1.2%
- Rents YoY
- 5.2%
- Active inventory
- 42
- Price-to-rent
- 7.8×
Monthly cashflow live
- Estimated rent
- $1,485 high interval (Pro) →
- Mortgage (P&I)
- −$734
- Tax from tax record
- −$91 /mo · $1,096/yr
- Insurance
- −$58
- HOA
- −$275
- Vacancy / Maint / Mgmt
- −$312
- Net cashflow
- $15
Break-even live
Sensitivity live
| Price | -10% $94 | -5% $55 | +0% $15 | +5% $-25 | +10% $-64 |
|---|---|---|---|---|---|
| Rent | -10% $-102 | -5% $-44 | +0% $15 | +5% $74 | +10% $132 |
| Rate | -1.0pp $86 | -0.5pp $51 | base $15 | +0.5pp $-21 | +1.0pp $-58 |
UW: 25.0% down · 7.5% · 30yr · 1.5% tax · 5.0% vac · 8.0% maint · 8.0% mgmt
Financing live
Cash to close
- Down payment
- $34,975
- Closing costs
- $4,197
- Reserves months
- —
- Total cash needed
- —
Loan-product check · same deal, 3 products live
Conventional
25% down · 7.5% · 30yr
- Down + closing
- —
- Monthly P&I
- —
- Monthly cashflow
- —
- DSCR
- —
- Eligible?
- —
Personal DTI + credit; lowest rate.
DSCR
20% down · 8.5% · 30yr
- Down + closing
- —
- Monthly P&I
- —
- Monthly cashflow
- —
- DSCR
- —
- Eligible?
- —
No personal income docs; deal must DSCR.
Hard money
10% down · 12.0% · 12mo
- Down + closing
- —
- Monthly P&I
- —
- Monthly cashflow
- —
- DSCR
- —
- Eligible?
- —
Short-term bridge; refi at stabilization.
Rent comps 40 comps
| Address | Beds | Baths | Sqft | Rent | $/sqft | DOM | Units | Dist |
|---|---|---|---|---|---|---|---|---|
| 14327 N Pennsylvania Ave Unit 36G Oklahoma City, OK | 2.0 | 1.0 | 950 | $1,100 | $1.16 | 3d | 1 | 0.09mi |
| 14425 N Pennsylvania Ave Unit 20B Oklahoma City, OK | 2.0 | 2.0 | 1134 | $1,299 | $1.15 | 25d | 1 | 0.10mi |
| 14433 N Pennsylvania Ave Unit 27A Oklahoma City, OK | 3.0 | 2.0 | 1360 | $1,750 | $1.29 | 3d | 1 | 0.19mi |
| 14443 N Pennsylvania Ave Oklahoma City, OK | 1.0 | 1.0 | 768 | $900 | $1.17 | 25d | 1 | 0.20mi |
| 2300 NW 145th St Oklahoma City, OK | 1.0–3.0 | 1.0–2.0 | 1000 | $1,920 | $1.92 | 3d | 12 | 0.22mi |
| 14201 N Kentucky Ave Oklahoma City, OK | 1.0–2.0 | 1.0–2.0 | 905 | $2,340 | $2.59 | 3d | 18 | 0.24mi |
| 1919 NW 142nd St Oklahoma City, OK | 2.0 | 2.0 | 1100 | $1,280 | $1.16 | 25d | 1 | 0.27mi |
| 14520 N Pennsylvania Ave Oklahoma City, OK | 1.0–3.0 | 1.0–2.0 | 1024 | $1,320 | $1.29 | 3d | 12 | 0.30mi |
| 14419 Moon Daisy Dr Edmond, OK | 3.0 | 2.0 | 1112 | $1,800 | $1.62 | 3d | 1 | 0.36mi |
| 14300 N Pennsylvania Ave Oklahoma City, OK | 1.0–2.0 | 1.0–2.0 | 844 | $1,029 | $1.22 | 3d | 1 | 0.38mi |
| 1812 NW 143rd St Edmond, OK | 3.0 | 2.0 | 1445 | $1,697 | $1.17 | 3d | 1 | 0.40mi |
| 1804 NW 143rd St Edmond, OK | 3.0 | 2.0 | 1260 | $1,595 | $1.27 | 25d | 1 | 0.42mi |
| 14900 N Pennsylvania Ave Oklahoma City, OK | 1.0–3.0 | 1.0–2.0 | 1027 | $1,362 | $1.33 | 3d | 19 | 0.43mi |
| 2400 Watermark Blvd Oklahoma City, OK | 1.0 | 1.0 | 830 | $1,329 | $1.60 | 25d | 1 | 0.43mi |
| 2400 Watermark Blvd Oklahoma City, OK | 2.0 | 2.0 | 1267 | $1,679 | $1.33 | 23d | 1 | 0.43mi |
| 1804 NW 145th St Edmond, OK | 3.0 | 2.0 | 1260 | $1,500 | $1.19 | 25d | 1 | 0.46mi |
| 14320 Mezzaluna Ave Oklahoma City, OK | 1.0 | 1.0 | 966 | $1,429 | $1.48 | 25d | 1 | 0.52mi |
| 14320 Mezzaluna Ave Oklahoma City, OK | 2.0 | 2.0 | 1267 | $1,619 | $1.28 | 16d | 1 | 0.52mi |
| 14320 Mezzaluna Ave Oklahoma City, OK | 1.0 | 1.0 | 879 | $1,329 | $1.51 | 13d | 1 | 0.52mi |
| 1809 NW 146th St Edmond, OK | 3.0 | 2.0 | 1202 | $1,625 | $1.35 | 5d | 1 | 0.53mi |
| 1608 NW 145th St Edmond, OK | 3.0 | 2.0 | 1354 | $1,575 | $1.16 | 25d | 1 | 0.55mi |
| 14712 Mezzaluna Blvd Oklahoma City, OK | 1.0–2.0 | 1.0–2.0 | 898 | $1,950 | $2.17 | 25d | 25 | 0.58mi |
| 2600 Watermark Blvd Oklahoma City, OK | 1.0–2.0 | 1.0–2.5 | 1066 | $1,567 | $1.47 | 3d | 10 | 0.64mi |
| 1716 NW 150th Ter Edmond, OK | 3.0 | 3.0 | 1472 | $1,695 | $1.15 | 25d | 1 | 0.69mi |
| 2701 Watermark Blvd Oklahoma City, OK | 1.0–3.0 | 1.0–2.0 | 1047 | $1,480 | $1.41 | 3d | 19 | 0.74mi |
| 14300 N May Ave Oklahoma City, OK | 1.0–3.0 | 1.0–2.0 | 923 | $1,255 | $1.36 | 4d | 15 | 0.78mi |
| 13600 N Blackwelder Ave Oklahoma City, OK | 3.0 | 1.0–2.0 | 850 | $1,671 | $1.97 | 3d | 27 | 0.78mi |
| 14200 N May Ave Oklahoma City, OK | 1.0–3.0 | 1.0–2.0 | 1031 | $1,302 | $1.26 | 3d | 17 | 0.82mi |
| 15501 N Pennsylvania Ave Edmond, OK | 2.0 | 2.0 | 958 | $1,379 | $1.44 | 16d | 1 | 0.83mi |
| 15501 N Pennsylvania Ave Edmond, OK | 3.0 | 2.0 | 1053 | $1,699 | $1.61 | 22d | 1 | 0.83mi |
| 15501 N Pennsylvania Ave Edmond, OK | 3.0 | 2.0 | 1053 | $1,699 | $1.61 | 25d | 1 | 0.83mi |
| 2609 Featherstone Rd Oklahoma City, OK | 1.0–2.0 | 1.0–2.0 | 769 | $1,150 | $1.50 | 3d | 34 | 0.85mi |
| 2523 NW 132nd Pl Oklahoma City, OK | 3.0 | 2.5 | 1328 | $2,450 | $1.84 | 25d | 1 | 0.86mi |
| 2540 NW 132nd Pl Oklahoma City, OK | 3.0 | 2.5 | 1385 | $2,400 | $1.73 | 25d | 1 | 0.89mi |
| 2201 NW 155th St Edmond, OK | 2.0 | 2.0 | 1149 | $1,495 | $1.30 | 25d | 1 | 0.95mi |
| 12831 Stratford Dr Oklahoma City, OK | 1.0–3.0 | 1.0–2.0 | 1122 | $2,295 | $2.05 | 3d | 22 | 0.97mi |
| 2533 NW 129th St Oklahoma City, OK | 3.0 | 2.5 | 1497 | $2,200 | $1.47 | 5d | 1 | 0.97mi |
| 2533 NW 129th St Oklahoma City, OK | 3.0 | 2.0 | 1500 | $2,200 | $1.47 | 25d | 1 | 0.97mi |
| 12701 N Pennsylvania Ave Oklahoma City, OK | 3.0 | 1.0–2.0 | 912 | $1,358 | $1.49 | 3d | 15 | 0.97mi |
| 2610 Crescent Ave Oklahoma City, OK | 3.0 | 2.5 | 1387 | $2,125 | $1.53 | 23d | 1 | 1.04mi |
HOA detail condo
- Monthly dues
- $275 · $3,300/yr
- Likely covers
- pool
- Assessments
- None detected in remarks — confirm with the listing agent.
Listing history 25 events
-
2026-06-21days on market $139,900 Active 32 DOM
-
2026-06-18days on market $139,900 Active 29 DOM
-
2026-06-17days on market $139,900 Active 28 DOM
-
2026-06-16days on market $139,900 Active 27 DOM
-
2026-06-15days on market $139,900 Active 26 DOM
-
2026-06-13days on market $139,900 Active 24 DOM
-
2026-06-09days on market $139,900 Active 20 DOM
-
2026-06-08days on market $139,900 Active 19 DOM
-
2026-06-07days on market $139,900 Active 18 DOM
-
2026-06-03days on market $139,900 Active 14 DOM
-
2026-06-02days on market $139,900 Active 13 DOM
-
2026-06-01days on market $139,900 Active 12 DOM
-
2026-05-31days on market $139,900 Active 11 DOM
-
2026-05-04$139,900 Active
-
2026-03-02historical
-
2026-02-20status Active
-
2025-09-03$148,500 Active
-
2025-05-13status Pending
-
2025-05-12historical
-
2025-05-07$149,900 Active
-
2019-03-06historical
-
2018-08-26status Active
-
2018-08-24status Pending
-
2018-06-07$92,000 Active
-
2004-08-27soldstatus $58,000
ⓘ Source: listings_history table (triggers on properties + properties_extension) + one-shot
backfill from property_details.listing_events for pre-trigger history.
Tax reassessment forecast OK · Resets to sale price
- Current annual tax
- $1,096 · $91/mo
- Projected year-2 tax
- $1,259 · $105/mo
- Expected delta
- +$163/yr (+$14/mo · 14.8%)
ⓘ Screening estimate from a state-policy table — verify with the county assessor before closing.
Climate risk First Street
- Flood 1/10 Low FEMA zone X (unshaded) · 0% chance over 30 yrs
- Wildfire 2/10 Low
- Heat 6/10 Major 7 d/yr ≥108°F today · 19 d/yr by 30 yrs out
- Wind 2/10 Low 4% chance of damaging wind over 30 yrs
- Air quality 2/10 Low 1 unhealthy d/yr today · 1 by 30 yrs out
Nearby sold comps map
Loading sold comps map…
Walkable amenities ~0.75 mi
Loading nearby amenities…
Taxation est. · year 1
- Rental income
- $17,823
- − Mortgage interest
- −$7,837
- − Property taxes
- −$1,096
- − Insurance
- −$700
- − Repairs & maintenance
- −$1,426
- − Management
- −$1,426
- − HOA
- −$3,300
- − Depreciation
- −$4,070
- Taxable loss
- −$2,031
- Est. tax savings @ 24.0%
- +$487
- After-tax cash flow
- $668/yr
For passive investors: Depreciation is non-cash, so a rental often shows a tax loss while cash-flowing — sheltering income. Rental losses are passive: they offset passive income freely, and up to $25,000/yr can offset ordinary (W-2) income if you actively participate and your MAGI is under $100k (phasing out to $0 by $150k); unused losses carry forward. On sale, claimed depreciation is recaptured at up to 25%, and gains may owe capital-gains tax (a 1031 exchange can defer both). Figures are a year-1 estimate at your 24.0% rate — not tax advice; consult a CPA.
Schools (NCES district)
- District
- Edmond
- NCES district ID
- 4010590
- Math proficiency
- 38% ▼ -12.00%
- Reading proficiency
- 40% ▼ -12.00%
- Median HH income
- $73,212
- Composite
- 35.88/100
- National rank
- #4814
- State rank
- #11 of 270 in OK
Livability — Oklahoma City
- Score
- 80/100
- State rank
- #3
- US rank
- #1635
Category grades
Schools grade is shown separately in the Schools card above.
Census & demographics
- Census place
- Oklahoma City, OK
- County
- Oklahoma County · 771,644 people
- City population
- 498,656
- Metro
- Oklahoma City, OK
- Population (ZIP)
- 7,522
- Household income
- $66,307
- Rent vs Own
- Severe rent burden
- 934.0
Population outlook (Oklahoma County) Hauer SSP2
- Today (2025)
- 911,875 people
- By 2030
- 982,413 · +7.7%
- By 2040
- 1,130,468 · +24.0%
- By 2050
- 1,288,422 · +41.3%
- By 2075
- 1,711,482 · +87.7%
- By 2100
- 2,088,448 · +129.0%
Race, ethnicity, and origin ACS 2023
- Neighborhood character
- Diverse neighborhood (Simpson 0.69)
- Race & ethnicity
- White 49% Black 20% Hispanic / Latino 14% Two or more races 8% Asian 7% Native American 4%
- Hispanic origin (detail)
- Mexican 12%
- Common ancestry
- Iranian 2% Italian 2% Lithuanian 1%
- Foreign-born
- 10% · Canada, Vietnam
- Languages at home
- 86% English-only · Spanish 7% Other Indo-European 2% Vietnamese 2%
Political lean MEDSL · Oklahoma
- 2024 margin
- Toss-up / Even · D 48.0% · R 49.7% · Other 2.3%
- 2008→2024 swing
- +15.1pp toward D · 2008: -16.8pp · 2024: -1.7pp
- All cycles
- 2024: R+1.7 2020: R+1.1 2016: R+10.5 2012: R+16.7 2008: R+16.8
Not yet ingested
- Civics
- —
Market trends
- HPI YoY
- ▲ 2.71%
- Current HPI
- 219.5373
- Rent YoY
- ▲ 5.21%
- Metro
- Oklahoma City, OK
- State GDP YoY
- ▲ 1.55%
- F500 in state
- 6
Industry mix (Fortune 500 HQ in OK)
| Industry | F500 HQs | Revenue |
|---|---|---|
| Energy | 3 | $48B |
|
||
Price history
+141.2% since first listed12 events — show timeline
- 2026-05-04 Listed $139,900 MLSOK
- 2026-03-02 Listing Removed — MLSOK
- 2026-02-20 Relisted — MLSOK
- 2025-09-03 Listed $148,500 MLSOK
- 2025-05-13 Pending — MLSOK
- 2025-05-12 Listing Removed — MLSOK
- 2025-05-07 Listed $149,900 MLSOK
- 2019-03-06 Listing Removed — MLSOK
- 2018-08-26 Relisted — MLSOK
- 2018-08-24 Pending — MLSOK
- 2018-06-07 Listed $92,000 MLSOK
- 2004-08-27 Sold (Public Records) $58,000 Public Records
Property tax history
+2.6%/yrLatest (2025): $1,096 · +3.7% YoY. Source: county tax records.
Cash-flow waterfall
monthlySold comps — $/sqft
last 12 mo · ≤1 miLoading sold comps…