 Fourplex
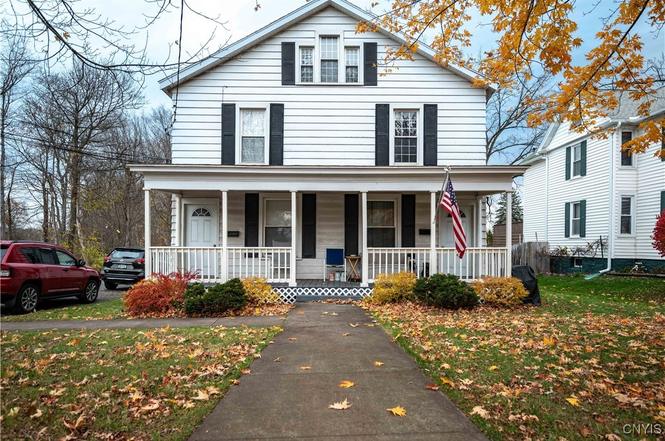
55 Utica St · Clinton, NY
Flood risk 8/10 · Major
- FEMA flood zone
- X (shaded)
- Chance of flooding over 30 yrs
- 0.99%
- Est. flood insurance / yr
- $473 – $860
Fire risk 1/10 · Minimal
- Est. fire insurance / yr
- $691 – $1,283
Heat risk 3/10 · Minor
- Hot days now (above 94°F)
- 7 days/yr
- Hot days in 30 yrs
- 17 days/yr
Wind risk 1/10 · Minimal
- Chance of severe wind over 30 yrs
- 1.0%
Air-quality risk 2/10 · Minimal
- Unhealthy air days now
- 0 days/yr
- Unhealthy air days in 30 yrs
- 2 days/yr
Risk factors via First Street. Map © Google.
Why this score? — see what drove the C+ grade
The composite is a weighted blend of 9 inputs, each scored 0–100. Each bar is that input's sub-score; the figure is the points it added to the 100-point composite (weight × sub-score).
- Cash flow +25.2/30.0
- DSCR +8.3/10.0
- ARV discount +7.5/15.0
- 1% rule +6.0/10.0
- Schools +5.5/10.0
- Livability +4.5/5.0
- Rent growth +2.5/5.0
- Condition / age +2.5/5.0
- Appreciation +0.0/10.0
$589,000
🖨 Deal sheet 📄 Offer letter ✓ Due diligence
Multi-family units
County records classify this as Multi-Family (2-4 Unit). Listing-text estimate: 4 units. confirmed
Listing remarks
Prime Investment Opportunity in the Village of Clinton Located at 55 Utica Street, Clinton, NY, this two-building, four-unit complex presents a rare opportunity to own a high-performing, turnkey property in one of Central New York’s most sought-after communities. Three of the four units have been completely renovated since 2021, featuring modern finishes, updated appliances, and the conveniences today’s renters demand. Each unit offers in-unit laundry, enhancing tenant satisfaction and reducing turnover. The property mix includes two spacious 3-bedroom, 1½-bath units ideal for those seeking extra space, along with two well-appointed 1-bedroom, 1-bath units that consisten
Key facts
- Updated appliances
- Two building complex
- Modern finishes
Tags
Neighborhood map
What this means for you Summary
Snapshot
- This is a 2×3bd/1.5ba + 2×1bd/1.5ba units multifamily listed at $589k.
Deal economics
- At list price, monthly cash flow is $1k ($15k/yr) — positive. Per door: $317/mo.
- The deal already cash-flows at list — no discount required.
- Meets the 1% rule at list price ($7k rent vs $589k).
- Recommended offer: $518k (12.0% below list) — sets the bar for market timing.
Location & tenants
- Location reads 91/100 on livability (#2 in NY, #45 nationally) — a professional / high-income tenant draw. Strengths: schools A+, crime A+, commute A+; Watch: amenities D.
- Clinton Central School District (suburban): math 57% / reading 71% proficiency, ranked #185 of 590 in NY (top 31%) — acceptable for families but not a draw, mixed tenant base, ~2y average lease; only 17% free/reduced lunch — higher-income household profile.
- Market conditions: 41 active listings in the ZIP; 204 units permitted in Oneida County in 2024 (68 in 5+ unit buildings).
Forward outlook
- Local home prices are declining (-3.0%/yr); year-one equity from $4k of loan paydown is wiped out by about $18k of value loss. Plan a longer hold.
- Oneida County population projected at -12% by 2050 — secular population decline; favor cash flow + early exit over multi-decade hold.
Negotiation context
- It's been on market 188 days — a 12% lower offer ($518k) is reasonable based on typical stale-listing flexibility.
- Current owner paid $150k; list at $589k implies a 293% gain — meaningful room to come down on a strong offer.
Risks & watch-outs
- Watch-outs: flood insurance adds $56/mo; built in 1900 — expect roof / HVAC / electrical / plumbing capex.
- Climate carrying-cost: severe flood risk — expect insurance premiums to compound above CPI over the hold.
Questions for the listing agent
- It's been on market 188 days. Have you received any prior offers? Is the seller open to a 12% concession, seller financing, or rate buy-down credit?
- Can we see the unit-by-unit rent roll, current vacancy, and any below-market leases? What's the average tenancy length?
- What capital expenditures (roof, boiler, parking lot, exteriors) have been made in the last 5 years, and what's planned in the next 2?
- Built in 1900 — when were the roof, HVAC, electrical panel, plumbing, and water heater last replaced?
- What's the actual annual flood-insurance premium (NFIP or private), and is the property in a SFHA with mandatory coverage?
- Why hasn't it sold? Are there any deal-killer items the seller is aware of (foundation, flood, title, zoning, code violations)?
- Is there a deadline driving the sale (1031 exchange, divorce, estate, relocation)? That informs how much negotiation room exists.
- Schools are A-rated — typically a magnet for longer-tenancy family renters. What's the average tenant stay here, and is there a school-zone premium baked into asking?
- What's the average days-on-market for RENTAL listings here right now (not sales)? A rising rental-DOM trend means longer vacancies and softer asking-rent achievability than the comps imply.
- What's the recent tenant-quality profile in this submarket — average credit score on applications, eviction rate, late-payment / NSF rate, and stable-employment percentage? A property-management company in the area should have these aggregated.
- How much new apartment / multifamily construction is in the pipeline within 1–3 miles? Heavy new supply (>2% of stock underway) typically softens rents 12–24 months out; light construction supports rent growth.
Investment metrics
- 1% rule
- 1.10% ✓
- Cap rate
- 8.99%
- Cash-on-cash
- 9.62%
- DSCR
- 1.43
- GRM
- 7.5
CMA / ARV
No comps found within radius.
Projected returns pro-forma
-3.0% appreciation · 3.0% rent growth · sell at horizon
- IRR
- -2.4%
- Equity multiple
- 0.91×
- Total profit
- $-14,783
- Equity at exit
- $87,822
- IRR
- 7.3%
- Equity multiple
- 1.55×
- Total profit
- $90,927
- Equity at exit
- $50,926
Cash invested: $164,920 (down + closing). Projections, not guarantees.
Landlord ↔ Tenant lean methodology
- Overall (STATE)
- 15 Strongly Tenant-Friendly
- State New York
- 15 Strongly Tenant-Friendly · D+10
- County
- — inherits STATE
- City
- — inherits STATE
ZIP-level market 13323
- Home prices YoY
- -22.2%
- Active inventory
- 41
- Price-to-rent
- 28.0×
Monthly cashflow live
- Estimated rent
- $6,506 medium interval (Pro) →
- Mortgage (P&I)
- −$3,089
- Tax from tax record
- −$483 /mo · $5,798/yr
- Insurance
- −$245
- Flood insurance flood zone
- −$56 /mo · $666/yr
- HOA
- −$0
- Vacancy / Maint / Mgmt
- −$1,366
- Net cashflow
- $1,267
Break-even live
Sensitivity live
| Price | -10% $1,600 | -5% $1,434 | +0% $1,267 | +5% $1,100 | +10% $933 |
|---|---|---|---|---|---|
| Rent | -10% $753 | -5% $1,010 | +0% $1,267 | +5% $1,524 | +10% $1,781 |
| Rate | -1.0pp $1,563 | -0.5pp $1,417 | base $1,267 | +0.5pp $1,114 | +1.0pp $959 |
4-unit breakdown (identical units grouped — click to expand)
| Units | Beds | Baths | Est. rent |
|---|---|---|---|
| 2× units | 3 | 1.5 | $3,506 |
| #1 | 3 | 1.5 | $1,753 |
| #2 | 3 | 1.5 | $1,753 |
| 2× units | 1 | 1.5 | $3,000 |
| #3 | 1 | 1.5 | $1,500 |
| #4 | 1 | 1.5 | $1,500 |
| Total (4 units) | $6,506 | ||
UW: 25.0% down · 7.5% · 30yr · 1.5% tax · 5.0% vac · 8.0% maint · 8.0% mgmt
Financing live
Cash to close
- Down payment
- $147,250
- Closing costs
- $17,670
- Reserves months
- —
- Total cash needed
- —
Loan-product check · same deal, 3 products live
Conventional
25% down · 7.5% · 30yr
- Down + closing
- —
- Monthly P&I
- —
- Monthly cashflow
- —
- DSCR
- —
- Eligible?
- —
Personal DTI + credit; lowest rate.
DSCR
20% down · 8.5% · 30yr
- Down + closing
- —
- Monthly P&I
- —
- Monthly cashflow
- —
- DSCR
- —
- Eligible?
- —
No personal income docs; deal must DSCR.
Hard money
10% down · 12.0% · 12mo
- Down + closing
- —
- Monthly P&I
- —
- Monthly cashflow
- —
- DSCR
- —
- Eligible?
- —
Short-term bridge; refi at stabilization.
Listing history 7 events
-
2026-05-20status Pending
-
2026-03-29historical Active Under Contract
-
2026-01-21price $589,000
-
2026-01-21price $589,900
-
2025-11-13$599,000 Active
-
2021-05-14soldstatus $150,000
-
1994-08-19soldstatus $70,000
ⓘ Source: listings_history table (triggers on properties + properties_extension) + one-shot
backfill from property_details.listing_events for pre-trigger history.
Tax reassessment forecast NY · Partial reset (capped growth)
- Current annual tax
- $5,798 · $483/mo
- Projected year-2 tax
- $7,876 · $656/mo
- Expected delta
- +$2,078/yr (+$173/mo · 35.8%)
ⓘ Screening estimate from a state-policy table — verify with the county assessor before closing.
Climate risk First Street
- Flood 8/10 Severe FEMA zone X (shaded) · 99% chance over 30 yrs
- Wildfire 1/10 Low
- Heat 3/10 Moderate 7 d/yr ≥94°F today · 17 d/yr by 30 yrs out
- Wind 1/10 Low 100% chance of damaging wind over 30 yrs
- Air quality 2/10 Low 0 unhealthy d/yr today · 2 by 30 yrs out
Nearby sold comps map
Loading sold comps map…
Walkable amenities ~0.75 mi
Loading nearby amenities…
Taxation est. · year 1
- Rental income
- $78,072
- − Mortgage interest
- −$32,993
- − Property taxes
- −$5,798
- − Insurance
- −$3,612
- − Repairs & maintenance
- −$6,246
- − Management
- −$6,246
- − Depreciation
- −$17,135
- Taxable income
- $6,043
- Est. tax owed @ 24.0%
- −$1,450
- After-tax cash flow
- $13,751/yr
For passive investors: Depreciation is non-cash, so a rental often shows a tax loss while cash-flowing — sheltering income. Rental losses are passive: they offset passive income freely, and up to $25,000/yr can offset ordinary (W-2) income if you actively participate and your MAGI is under $100k (phasing out to $0 by $150k); unused losses carry forward. On sale, claimed depreciation is recaptured at up to 25%, and gains may owe capital-gains tax (a 1031 exchange can defer both). Figures are a year-1 estimate at your 24.0% rate — not tax advice; consult a CPA.
Schools (NCES district)
- District
- Clinton Central School District
- NCES district ID
- 3607770
- Math proficiency
- 57% ▼ -11.00%
- Reading proficiency
- 71% ▲ 6.00%
- Median HH income
- $57,439
- Composite
- 55.05/100
- National rank
- #1290
- State rank
- #185 of 590 in NY
Livability — Clinton
- Score
- 91/100
- State rank
- #2
- US rank
- #45
Category grades
Schools grade is shown separately in the Schools card above.
Census & demographics
- Census place
- Clinton, NY
- Population (ZIP)
- 11,014
Population outlook (Oneida County) Hauer SSP2
- Today (2025)
- 225,223 people
- By 2030
- 220,384 · -2.1%
- By 2040
- 209,071 · -7.2%
- By 2050
- 197,920 · -12.1%
- By 2075
- 175,541 · -22.1%
- By 2100
- 148,491 · -34.1%
Race, ethnicity, and origin ACS 2023
- Neighborhood character
- Predominantly White (90%)
- Race & ethnicity
- White 90% Hispanic / Latino 4% Two or more races 3% Asian 2%
- Common ancestry
- Romanian 8% Lithuanian 3% Italian 2%
- Foreign-born
- 4% · Canada, China
- Languages at home
- 94% English-only · Spanish 2% Other Asian/Pacific 1% Other Indo-European 1%
Political lean MEDSL · Oneida
- 2024 margin
- Strong R (+21.3) · D 39.4% · R 60.6%
- 2008→2024 swing
- -15.2pp toward R · 2008: -6.1pp · 2024: -21.3pp
- All cycles
- 2024: R+21.3 2020: R+15.5 2016: R+21.1 2012: R+5.3 2008: R+6.1
Not yet ingested
- Civics
- —
Market trends
- HPI YoY
- ▼ -83.30%
- Current HPI
- 292.0471
- Rent YoY
- —
- Metro
- —
- State GDP YoY
- ▲ 2.60%
- F500 in state
- 92
Industry mix (Fortune 500 HQ in NY)
| Industry | F500 HQs | Revenue |
|---|---|---|
| Financial Services | 10 | $950B |
|
||
| Consumer Goods | 9 | $162B |
|
||
| Insurance | 4 | $225B |
|
||
| Telecommunications | 2 | $144B |
|
||
| Pharmaceuticals | 2 | $112B |
|
||
| Media / Entertainment | 2 | $69B |
|
||
Price history
+741.4% since first listed7 events — show timeline
- 2026-05-20 Pending — CNYIS
- 2026-03-29 Contingent — CNYIS
- 2026-01-21 Price Changed $589,000 CNYIS
- 2026-01-21 Price Changed $589,900 CNYIS
- 2025-11-13 Listed $599,000 CNYIS
- 2021-05-14 Sold (Public Records) $150,000 Public Records
- 1994-08-19 Sold (Public Records) $70,000 Public Records
Property tax history
+0.3%/yrLatest (2025): $5,798 · -10.0% YoY. Source: county tax records.
Cash-flow waterfall
monthlySold comps — $/sqft
last 12 mo · ≤1 miLoading sold comps…