 Duplex
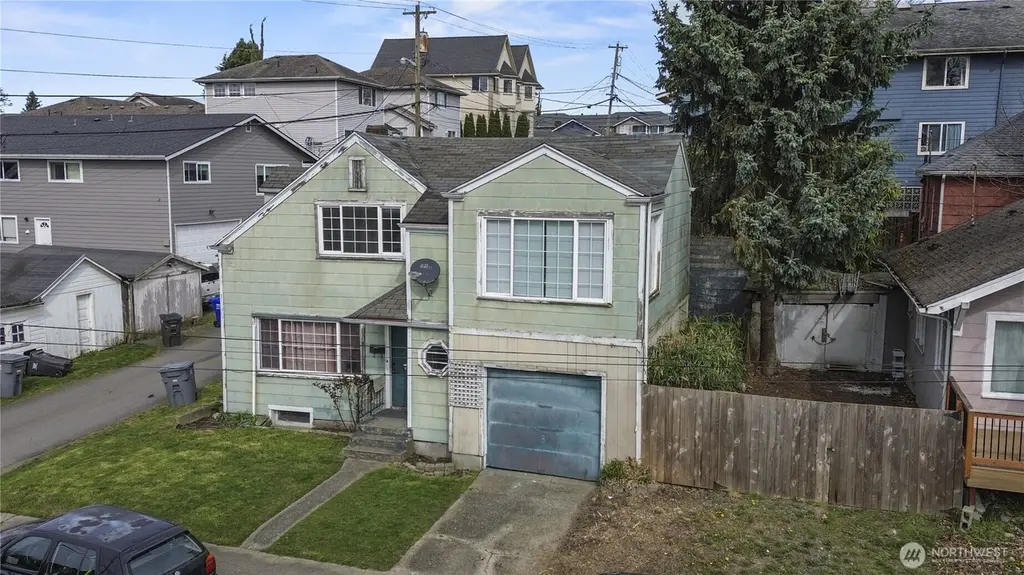
1817 34th St · Everett, WA
Flood risk 1/10 · Minimal
- FEMA flood zone
- X (unshaded)
- Chance of flooding over 30 yrs
- 0.0%
- Est. flood insurance / yr
- $473 – $860
Fire risk 1/10 · Minimal
- Est. fire insurance / yr
- $604 – $1,122
Heat risk 3/10 · Minor
- Hot days now (above 85°F)
- 7 days/yr
- Hot days in 30 yrs
- 16 days/yr
Wind risk 1/10 · Minimal
- Chance of severe wind over 30 yrs
- —
Air-quality risk 6/10 · Moderate
- Unhealthy air days now
- 9 days/yr
- Unhealthy air days in 30 yrs
- 10 days/yr
Risk factors via First Street. Map © Google.
Why this score? — see what drove the C- grade
The composite is a weighted blend of 9 inputs, each scored 0–100. Each bar is that input's sub-score; the figure is the points it added to the 100-point composite (weight × sub-score).
- Cash flow +15.2/30.0
- ARV discount +15.0/15.0
- Schools +5.9/10.0
- DSCR +4.7/10.0
- Livability +3.7/5.0
- 1% rule +3.6/10.0
- Rent growth +3.2/5.0
- Condition / age +2.5/5.0
- Appreciation +0.0/10.0
$425,000
🖨 Deal sheet (PDF) 📄 Offer letter ✓ Due diligence
Multi-family units
County records classify this as Multi-Family (2-4 Unit). Listing-text estimate: 2 units. confirmed
Listing remarks
Great multi-family opportunity located just a few blocks south of downtown Everett. The structure was built in 1920 and has stood the test of time. A perfect place for owner occupant to gain some "sweat equity" while producing income. Convenient location just south of downtown. Easy to walk to many of Everett's amenities, including restaurants, cafe's, baseball park, and shopping. A longer walk or short bike ride to Everett's exciting "Waterfront Place". This is an affordable duplex that will get you in the income-producing property arena. A fantastic way to begin building equity, especially if you are handy and can address maintenance items yourself.
Key facts
- 2,178 sq ft lot
- Garage
- Built 1920
Neighborhood map
What this means for you Summary
Snapshot
- This is a 2 × 2-bed/2.0-bath units multifamily listed at $425k.
Deal economics
- At list price, monthly cash flow is $147 ($2k/yr) — positive. Per door: $74/mo.
- The deal already cash-flows at list — no discount required.
- To meet the 1% rule (rent ≥ 1% of price), the offer needs to be $365k (14.2% below list).
- Recommended offer: $365k (14.2% below list) — sets the bar for 1% rule.
- Cap rate 6.7% vs local median 2.5% in Everett — top-decile yield for the area; either an underpriced asset or a hidden risk that comps aren't pricing in. Stress-test before assuming the spread holds.
Location & tenants
- Location reads 73/100 on livability (#199 in WA) — a middle-class / working-renter tenant base. Strengths: commute A+, housing A, health & safety A; Watch: schools C-, crime D+, amenities F.
- Everett School District (urban): math 60% / reading 72% proficiency, ranked #26 of 291 in WA (top 9%) — acceptable for families but not a draw, mixed tenant base, ~2y average lease.
- Market conditions: Rents rising (+3.0%/yr); 151 active listings in the ZIP; 3 comparable units currently listed for rent nearby; rentals leasing fast (median 4d on market — plan ~1-2 weeks tenant-placement turnaround); 3,982 units permitted in Snohomish County in 2024 (1,492 in 5+ unit buildings).
- At $3,646/mo this rent would consume 59% of the median local household income ($75k/yr) (locally 2144% of renters already pay >50% of income on rent) — very limited rent-growth headroom before tenants either downsize or default.
Forward outlook
- Local home prices are declining (-3.0%/yr); year-one equity from $3k of loan paydown is wiped out by about $13k of value loss. Plan a longer hold.
- Snohomish County population projected at +30% by 2050 — long-run rental-demand tailwind backs the buy-and-hold thesis.
Negotiation context
- It's been on market 80 days — a 6% lower offer ($400k) is reasonable based on typical stale-listing flexibility.
- 4 sale attempts since 25y ago; this cycle's ask has dropped $75k (15%) from the opening price — seller is motivated, your offer sets the floor, not the list.
- Current owner paid $245k; list at $425k implies a 73% gain — meaningful room to come down on a strong offer.
Risks & watch-outs
- Watch-outs: built in 1920 — expect roof / HVAC / electrical / plumbing capex.
Questions for the listing agent
- It's been on market 80 days. Have you received any prior offers? Is the seller open to a 14% concession, seller financing, or rate buy-down credit?
- Can we see the unit-by-unit rent roll, current vacancy, and any below-market leases? What's the average tenancy length?
- What capital expenditures (roof, boiler, parking lot, exteriors) have been made in the last 5 years, and what's planned in the next 2?
- Built in 1920 — when were the roof, HVAC, electrical panel, plumbing, and water heater last replaced?
- Why hasn't it sold? Are there any deal-killer items the seller is aware of (foundation, flood, title, zoning, code violations)?
- Is there a deadline driving the sale (1031 exchange, divorce, estate, relocation)? That informs how much negotiation room exists.
- Crime grade is D in this area — have there been break-ins, vandalism, or insurance claims at this property in the last 3 years? What carrier currently insures it and at what premium?
- What's the average days-on-market for RENTAL listings here right now (not sales)? A rising rental-DOM trend means longer vacancies and softer asking-rent achievability than the comps imply.
- What's the recent tenant-quality profile in this submarket — average credit score on applications, eviction rate, late-payment / NSF rate, and stable-employment percentage? A property-management company in the area should have these aggregated.
- How much new apartment / multifamily construction is in the pipeline within 1–3 miles? Heavy new supply (>2% of stock underway) typically softens rents 12–24 months out; light construction supports rent growth.
Investment metrics
- 1% rule
- 0.86% ✗
- Cap rate
- 6.71%
- Cash-on-cash
- 1.49%
- DSCR
- 1.07
- GRM
- 9.7
CMA / ARV
- ARV (median comp)
- $556,224
- List price
- $425,000
- Delta
- -23.59%
- Verdict
- UNDERPRICED
- Comps
- 18 within 1.0 mi
Show comp detail 1 sale within ~0.75 mi
| Address | Dist | Beds/Ba | Sqft | Sold | Price | $/sf | Match |
|---|---|---|---|---|---|---|---|
| 3527 Wetmore Ave | 0.19mi | 5/3.0 (+1) | 1,920 (+9%) | 3mo | $565,000 | $294 | 65 |
Match score weights: distance 35% · size 25% · config 20% · recency 20%. Top-matched comps best support the ARV.
Projected returns pro-forma
-3.0% appreciation · 2.95% rent growth · sell at horizon
- IRR
- -14.0%
- Equity multiple
- 0.50×
- Total profit
- $-59,741
- Equity at exit
- $63,369
- IRR
- -5.3%
- Equity multiple
- 0.66×
- Total profit
- $-40,980
- Equity at exit
- $36,746
Cash invested: $119,000 (down + closing). Projections, not guarantees.
Landlord ↔ Tenant lean methodology
- Overall (STATE)
- 28 Tenant-Leaning
- State Washington
- 28 Tenant-Leaning · D+8
- County
- — inherits STATE
- City
- — inherits STATE
ZIP-level market 98201
- Rents YoY
- 3.0%
- Active inventory
- 151
- Price-to-rent
- 19.4×
Monthly cashflow live
- Estimated rent
- $3,646 high interval (Pro) →
- Mortgage (P&I)
- −$2,229
- Tax from tax record
- −$327 /mo · $3,927/yr
- Insurance
- −$177
- HOA
- −$0
- Vacancy / Maint / Mgmt
- −$766
- Net cashflow
- $147
Break-even live
Sensitivity live
| Price | -10% $388 | -5% $268 | +0% $147 | +5% $27 | +10% $-93 |
|---|---|---|---|---|---|
| Rent | -10% $-141 | -5% $3 | +0% $147 | +5% $291 | +10% $435 |
| Rate | -1.0pp $361 | -0.5pp $255 | base $147 | +0.5pp $37 | +1.0pp $-75 |
2-unit breakdown (identical units grouped — click to expand)
| Units | Beds | Baths | Est. rent |
|---|---|---|---|
| 2× units | 2 | 2 | $3,646 |
| #1 | 2 | 2 | $1,823 |
| #2 | 2 | 2 | $1,823 |
| Total (2 units) | $3,646 | ||
UW: 25.0% down · 7.5% · 30yr · 1.5% tax · 5.0% vac · 8.0% maint · 8.0% mgmt
Financing live
Cash to close
- Down payment
- $106,250
- Closing costs
- $12,750
- Reserves months
- —
- Total cash needed
- —
Loan-product check · same deal, 3 products live
Conventional
25% down · 7.5% · 30yr
- Down + closing
- —
- Monthly P&I
- —
- Monthly cashflow
- —
- DSCR
- —
- Eligible?
- —
Personal DTI + credit; lowest rate.
DSCR
20% down · 8.5% · 30yr
- Down + closing
- —
- Monthly P&I
- —
- Monthly cashflow
- —
- DSCR
- —
- Eligible?
- —
No personal income docs; deal must DSCR.
Hard money
10% down · 12.0% · 12mo
- Down + closing
- —
- Monthly P&I
- —
- Monthly cashflow
- —
- DSCR
- —
- Eligible?
- —
Short-term bridge; refi at stabilization.
Rent comps 3 comps
| Address | Beds | Baths | Sqft | Rent | $/sqft | DOM | Units | Dist |
|---|---|---|---|---|---|---|---|---|
| 3222 Lombard Ave Unit C Everett, WA | 3.0 | 2.5 | 1280 | $2,295 | $1.79 | 4d | 1 | 0.13mi |
| 3323 Hoyt Ave Unit C Everett, WA | 3.0 | 2.5 | 1282 | $2,350 | $1.83 | 25d | 1 | 0.20mi |
| 3010 Norton Ave Unit A Everett, WA | 4.0 | 2.0 | 1640 | $3,145 | $1.92 | 4d | 1 | 0.54mi |
Listing history 31 events
-
2026-06-21days on market $425,000 Active 80 DOM
-
2026-06-19price $425,000 Active 77 DOM
-
2026-06-18days on market $475,000 Active 77 DOM
-
2026-06-17days on market $475,000 Active 76 DOM
-
2026-06-16days on market $475,000 Active 75 DOM
-
2026-06-15days on market $475,000 Active 74 DOM
-
2026-06-13days on market $475,000 Active 72 DOM
-
2026-06-13days on market $475,000 Active 71 DOM
-
2026-06-09days on market $475,000 Active 68 DOM
-
2026-06-08days on market $475,000 Active 67 DOM
-
2026-06-07days on market $475,000 Active 66 DOM
-
2026-06-04days on market $475,000 Active 63 DOM
-
2026-06-03days on market $475,000 Active 62 DOM
-
2026-06-02days on market $475,000 Active 61 DOM
-
2026-06-01days on market $475,000 Active 60 DOM
-
2026-05-31days on market $475,000 Active 59 DOM
-
2026-05-12price $475,000
-
2026-04-02$499,950 Active
-
2008-03-30soldstatus $245,000
-
2008-03-28soldstatus $245,000
-
2007-11-26historical
-
2007-10-22$269,000
-
2005-12-20soldstatus $239,000
-
2005-12-19soldstatus $239,000
-
2005-10-31$239,990
-
2001-06-18soldstatus $159,000
-
2001-06-18soldstatus $159,000
-
2001-06-18soldstatus $159,000
-
2001-01-10$156,950
-
1993-08-05soldstatus $94,000
-
1978-05-01soldstatus $32,000
ⓘ Source: listings_history table (triggers on properties + properties_extension) + one-shot
backfill from property_details.listing_events for pre-trigger history.
Tax reassessment forecast WA · Resets to sale price
- Current annual tax
- $3,927 · $327/mo
- Projected year-2 tax
- $4,165 · $347/mo
- Expected delta
- +$238/yr (+$20/mo · 6.1%)
ⓘ Screening estimate from a state-policy table — verify with the county assessor before closing.
Climate risk First Street
- Flood 1/10 Low FEMA zone X (unshaded) · 0% chance over 30 yrs
- Wildfire 1/10 Low
- Heat 3/10 Moderate 7 d/yr ≥85°F today · 16 d/yr by 30 yrs out
- Wind 1/10 Low
- Air quality 6/10 Major 9 unhealthy d/yr today · 10 by 30 yrs out
Nearby sold comps map
Loading sold comps map…
Walkable amenities ~0.75 mi
Loading nearby amenities…
Taxation est. · year 1
- Rental income
- $43,752
- − Mortgage interest
- −$23,807
- − Property taxes
- −$3,927
- − Insurance
- −$2,125
- − Repairs & maintenance
- −$3,500
- − Management
- −$3,500
- − Depreciation
- −$12,364
- Taxable loss
- −$5,470
- Est. tax savings @ 24.0%
- +$1,313
- After-tax cash flow
- $3,080/yr
For passive investors: Depreciation is non-cash, so a rental often shows a tax loss while cash-flowing — sheltering income. Rental losses are passive: they offset passive income freely, and up to $25,000/yr can offset ordinary (W-2) income if you actively participate and your MAGI is under $100k (phasing out to $0 by $150k); unused losses carry forward. On sale, claimed depreciation is recaptured at up to 25%, and gains may owe capital-gains tax (a 1031 exchange can defer both). Figures are a year-1 estimate at your 24.0% rate — not tax advice; consult a CPA.
Schools (NCES district)
- District
- Everett School District
- NCES district ID
- 5302670
- Math proficiency
- 60% ▲ 1.00%
- Reading proficiency
- 72% ▲ 1.00%
- Median HH income
- $66,815
- Composite
- 59.0/100
- National rank
- #1964
- State rank
- #26 of 291 in WA
Livability — Everett
- Score
- 73/100
- State rank
- #199
- US rank
- #5489
Category grades
Schools grade is shown separately in the Schools card above.
Census & demographics
- Census place
- Everett, WA
- County
- Snohomish County · 786,756 people
- City population
- 173,457
- Metro
- Seattle-Tacoma-Bellevue, WA
- Population (ZIP)
- 31,895
- Household income
- $74,554
- Rent vs Own
- Severe rent burden
- 2144.0
Population outlook (Snohomish County) Hauer SSP2
- Today (2025)
- 899,800 people
- By 2030
- 960,975 · +6.8%
- By 2040
- 1,074,447 · +19.4%
- By 2050
- 1,171,954 · +30.2%
- By 2075
- 1,384,849 · +53.9%
- By 2100
- 1,497,296 · +66.4%
Race, ethnicity, and origin ACS 2023
- Neighborhood character
- Predominantly White (71%)
- Race & ethnicity
- White 71% Hispanic / Latino 12% Two or more races 12% Asian 3% Pacific Islander 2% Black 2% Native American 1%
- Hispanic origin (detail)
- Mexican 7%
- Common ancestry
- Portuguese 6% Italian 4% Slovak 4%
- Foreign-born
- 10% · Canada, Jamaica, Vietnam
- Languages at home
- 87% English-only · Spanish 6% Russian/Polish/Slavic 2% Other Asian/Pacific 1%
Political lean MEDSL · Snohomish
- 2024 margin
- D (+19.0) · D 57.8% · R 38.9% · Other 3.3%
- 2008→2024 swing
- +0.1pp no change · 2008: 18.9pp · 2024: 19.0pp
- All cycles
- 2024: D+19.0 2020: D+20.6 2016: D+16.6 2012: D+16.2 2008: D+18.9
Not yet ingested
- Civics
- —
Market trends
- HPI YoY
- ▼ -793.56%
- Current HPI
- 339.2661
- Rent YoY
- ▲ 2.95%
- Metro
- Seattle-Tacoma-Bellevue, WA
- State GDP YoY
- ▲ 4.65%
- F500 in state
- 22
Industry mix (Fortune 500 HQ in WA)
| Industry | F500 HQs | Revenue |
|---|---|---|
| Retail | 2 | $269B |
|
||
| Technology / Retail | 1 | $638B |
|
||
| Technology | 1 | $245B |
|
||
| Telecommunications | 1 | $38B |
|
||
| Food / Beverage | 1 | $36B |
|
||
| Automotive / Trucks | 1 | $34B |
|
||
Price history
+1384.4% since first listed15 events — show timeline
- 2026-05-12 Price Changed $475,000 NWMLS as Distributed by MLS Grid
- 2026-04-02 Listed $499,950 NWMLS as Distributed by MLS Grid
- 2008-03-30 Sold (MLS) $245,000 NWMLS as Distributed by MLS Grid
- 2008-03-28 Sold (Public Records) $245,000 Public Records
- 2007-11-26 Delisted — NWMLS as Distributed by MLS Grid
- 2007-10-22 Listed $269,000 NWMLS as Distributed by MLS Grid
- 2005-12-20 Sold (Public Records) $239,000 Public Records
- 2005-12-19 Sold (MLS) $239,000 NWMLS as Distributed by MLS Grid
- 2005-10-31 Listed $239,990 NWMLS as Distributed by MLS Grid
- 2001-06-18 Sold (Public Records) $159,000 Public Records
- 2001-06-18 Sold (Public Records) $159,000 Public Records
- 2001-06-18 Sold (MLS) $159,000 NWMLS as Distributed by MLS Grid
- 2001-01-10 Listed $156,950 NWMLS as Distributed by MLS Grid
- 1993-08-05 Sold (Public Records) $94,000 Public Records
- 1978-05-01 Sold (Public Records) $32,000 Public Records
Property tax history
+2.2%/yrLatest (2026): $3,927 · +0.1% YoY. Source: county tax records.
Cash-flow waterfall
monthlySold comps — $/sqft
last 12 mo · ≤1 miLoading sold comps…