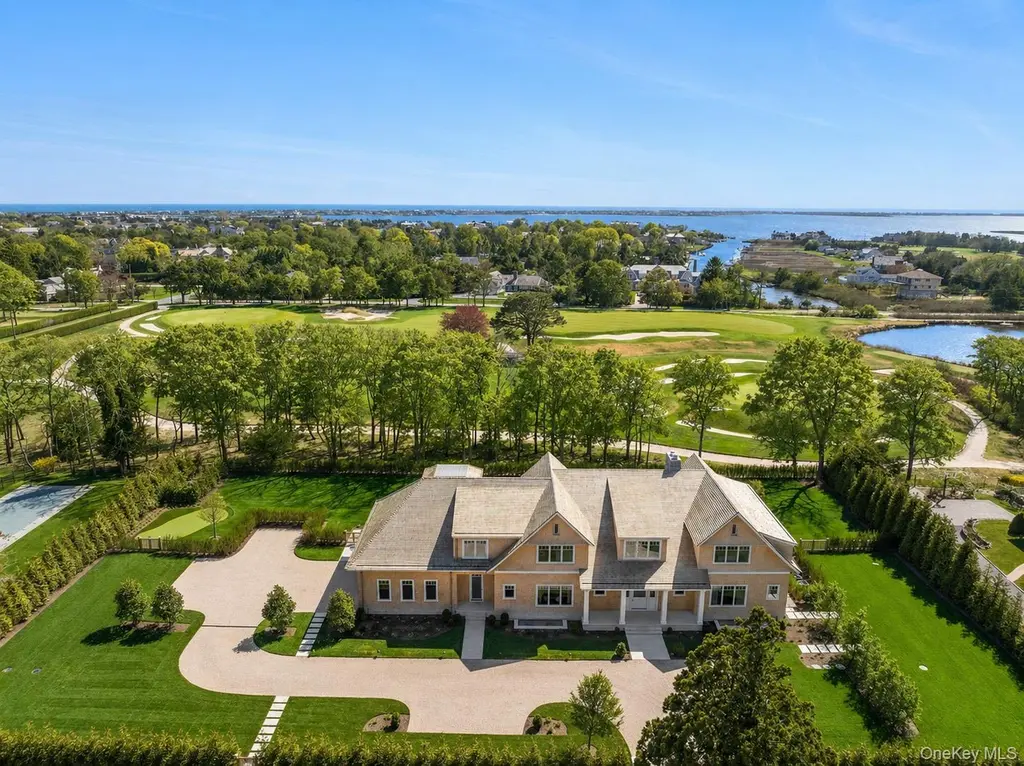
171 Oneck Ln · Westhampton Beach, NY
Flood risk 3/10 · Minor
- FEMA flood zone
- X (unshaded)
- Chance of flooding over 30 yrs
- 0.12%
- Est. flood insurance / yr
- $507 – $1,088
Fire risk 1/10 · Minimal
- Est. fire insurance / yr
- $691 – $1,283
Heat risk 4/10 · Minor
- Hot days now (above 90°F)
- 7 days/yr
- Hot days in 30 yrs
- 19 days/yr
Wind risk 8/10 · Major
- Chance of severe wind over 30 yrs
- 80.0%
Air-quality risk 4/10 · Minor
- Unhealthy air days now
- 4 days/yr
- Unhealthy air days in 30 yrs
- 5 days/yr
Risk factors via First Street. Map © Google.
Why this score? — see what drove the D- grade
The composite is a weighted blend of 9 inputs, each scored 0–100. Each bar is that input's sub-score; the figure is the points it added to the 100-point composite (weight × sub-score).
- ARV discount +13.4/15.0
- Appreciation +10.0/10.0
- Schools +6.6/10.0
- Livability +3.2/5.0
- Rent growth +2.5/5.0
- Condition / age +2.5/5.0
- Cash flow +0.0/30.0
- 1% rule +0.0/10.0
- DSCR +0.0/10.0
$9,999,990
🖨 Deal sheet 📄 Offer letter ✓ Due diligence
Listing remarks
Down a perfectly manicured private road, discover 171 Oneck Lane - a newly constructed, estate (built by ONE DEVELOPMENT) that captures the essence of refined Hamptons living. Ideally situated on just under an acre, the property overlooks the prestigious Westhampton Beach Country Club; offering sweeping views across the lush fairways of the 3rd hole-delivering both privacy and an elevated golf setting. Designed with meticulous craftsmanship and focussed on both scale and comfort, the home offers 7 en-suite bedrooms and 11 well appointed bathrooms. A grand foyer introduces a spacious, light filled open concept layout with soaring ceilings, custom millwork, coffered ceilings and elegant moldi
Key facts
- Private road
- Grand foyer
- Open concept layout
Tags
Property features AI
Finance
- Other: Private lot with landscaped front and back yards; Near golf course; Sprinklers in front and rear; Finished full basement with storage and walk-out access; Partial attic; Private pool and spa
Exterior
- Parking: Driveway; 2-car garage with garage door opener; Additional garage(s)
- Utilities: Electricity connected; Propane; Water connected; Septic tank
- Home design: Single family residence; Plans used for living area
- Construction: Cedar construction
- Exterior features: Covered patio; Patio; Porch; Terrace; Balcony; Courtyard; Fire pit; Gas grill; Outdoor kitchen; Outdoor lighting; Other exterior features
Interior
- Kitchen: Convection oven; Gas cooktop; Gas range; Electric oven; Microwave; Dishwasher; Refrigerator; Freezer; Exhaust fan
- Bedrooms: Multiple bedrooms including a primary suite on the main level
- Bathrooms: 9 full bathrooms; 2 half bathrooms
- Heating & cooling: Forced air heating; Central air conditioning
- Interior features: First-floor bedroom; First-floor full bath; Beamed ceilings; Breakfast bar; Cathedral ceilings; Ceiling fans; Central vacuum; Chandelier; Chef's kitchen; Crown molding; Double vanity; Dry bar; Eat-in kitchen; Elevator; Entertainment cabinets; Entrance foyer; Formal dining; High ceilings; His and hers closets; In-law floorplan; Kitchen island; Primary bathroom; Master suite on main level; Open floorplan; Open kitchen; Pantry; Quartz/Quartzite counters; Recessed lighting; Sauna; Smart thermostat; Soaking tub; Sound system; Storage; Walk-in closets; Wet bar; Wired for sound
- Laundry & utility: Washer; Dryer; Gas water heater
Neighborhood map
What this means for you Summary
Snapshot
- This is a 7-bed/10.0-bath other listed at $10.00M.
Deal economics
- At list price, monthly cash flow is $-49k ($-593k/yr) — negative.
- To cash-flow at today's rent, offer at most $2.85M (71.5% below list).
- To meet the 1% rule (rent ≥ 1% of price), the offer needs to be $2.49M (75.1% below list).
- Recommended offer: $2.49M (75.1% below list) — sets the bar for 1% rule.
- Cap rate 0.4% vs local median 9.3% in Westhampton Beach — below-typical yield; the buyer is paying a premium for something (appreciation thesis, condition, location) that the cap rate doesn't capture.
Location & tenants
- Location reads 64/100 on livability (#740 in NY) — a middle-class / working-renter tenant base. Strengths: crime A+, employment A+; Watch: amenities F, commute F, cost of living F.
- Westhampton Beach Union Free School District (suburban): math 72% / reading 75% proficiency, ranked #81 of 590 in NY (top 14%) — strong family-tenant draw, lease renewals of 3-5y typical.
- Zoned schools: Westhampton Beach Elementary School (math 67% / reading 67%, grade B+, #525 of 2,108 statewide, top 27%, 356 students, 43% FRL); Westhampton Middle School (math 61% / reading 63%, grade B+, #136 of 729 statewide, top 20%, 434 students, 26% FRL); Westhampton Beach Senior High School (math 90% / reading 96%, grade A+, #147 of 1,100 statewide, top 14%, 964 students, 24% FRL).
- Market conditions: 112 active listings in the ZIP; high-income renter base; 1,366 units permitted in Suffolk County in 2024 (216 in 5+ unit buildings).
- At $24,946/mo this rent would consume 239% of the median local household income ($125k/yr) (locally 43% of renters already pay >50% of income on rent) — very limited rent-growth headroom before tenants either downsize or default.
Forward outlook
- In year one you build about $1.07M of equity ($69k loan paydown + $1000k appreciation (10.0% local appreciation)).
- Suffolk County population projected to shrink 5% by 2050 — rents likely to lag national; underwrite the cash flow, not the appreciation.
- By year 2, paydown + projected appreciation supports a ~$1.72M cash-out refi (75% LTV) — recoverable capital for the next deal without selling this one.
Negotiation context
- It's been on market 55 days — a 3% lower offer ($9.70M) is reasonable based on typical stale-listing flexibility.
- 2 sale attempts with the ask held roughly flat each time — persistent listings suggest the price (not the market) is what's stuck; bring a comps-based counter.
- Current owner paid $1.93M; list at $10.00M implies a 418% gain — meaningful room to come down on a strong offer.
Risks & watch-outs
- Climate carrying-cost: severe wind risk, 80% chance of damaging wind over 30y — expect insurance premiums to compound above CPI over the hold.
Questions for the listing agent
- What do current leases actually rent for vs. the listed asking? Can we see a recent rent roll and the last 12 months of T-12 income?
- It's been on market 55 days. Have you received any prior offers? Is the seller open to a 75% concession, seller financing, or rate buy-down credit?
- Is there a deadline driving the sale (1031 exchange, divorce, estate, relocation)? That informs how much negotiation room exists.
- Schools are A-rated — typically a magnet for longer-tenancy family renters. What's the average tenant stay here, and is there a school-zone premium baked into asking?
- The area grade is low — what's the realistic commute time and amenity access for the typical tenant pool here? Any planned neighborhood developments (good or bad) we should know about?
- What's the average days-on-market for RENTAL listings here right now (not sales)? A rising rental-DOM trend means longer vacancies and softer asking-rent achievability than the comps imply.
- What's the recent tenant-quality profile in this submarket — average credit score on applications, eviction rate, late-payment / NSF rate, and stable-employment percentage? A property-management company in the area should have these aggregated.
- How much new for-sale + rental construction is in the pipeline within 1–3 miles? Heavy new supply typically softens prices + rents 12–24 months out; constrained supply supports both.
Investment metrics
- 1% rule
- 0.25% ✗
- Cap rate
- 0.36%
- Cash-on-cash
- -21.17%
- DSCR
- 0.06
- GRM
- 33.4
CMA / ARV
- ARV (median comp)
- $11,522,554
- List price
- $9,999,990
- Delta
- -13.21%
- Verdict
- UNDERPRICED
- Comps
- 2 within 1.0 mi
Projected returns pro-forma
10.0% appreciation · 3.0% rent growth · sell at horizon
- IRR
- 9.8%
- Equity multiple
- 1.82×
- Total profit
- $2,300,320
- Equity at exit
- $9,008,783
- IRR
- 11.1%
- Equity multiple
- 4.30×
- Total profit
- $9,249,053
- Equity at exit
- $19,427,781
Cash invested: $2,799,997 (down + closing). Projections, not guarantees.
Landlord ↔ Tenant lean methodology
- Overall (STATE)
- 15 Strongly Tenant-Friendly
- State New York
- 15 Strongly Tenant-Friendly · D+10
- County
- — inherits STATE
- City
- — inherits STATE
ZIP-level market 11978
- Home prices YoY
- 2.9%
- Active inventory
- 112
- Price-to-rent
- 33.4×
Monthly cashflow live
- Estimated rent
- $24,946 medium interval (Pro) →
- Mortgage (P&I)
- −$52,441
- Tax est. 1.5%
- −$12,500 /mo · $150,000/yr
- Insurance
- −$4,167
- HOA
- −$0
- Vacancy / Maint / Mgmt
- −$5,239
- Net cashflow
- $-49,400
Break-even live
UW: 25.0% down · 7.5% · 30yr · 1.5% tax · 5.0% vac · 8.0% maint · 8.0% mgmt
Financing live
Cash to close
- Down payment
- $2,499,998
- Closing costs
- $300,000
- Reserves months
- —
- Total cash needed
- —
Loan-product check · same deal, 3 products live
Conventional
25% down · 7.5% · 30yr
- Down + closing
- —
- Monthly P&I
- —
- Monthly cashflow
- —
- DSCR
- —
- Eligible?
- —
Personal DTI + credit; lowest rate.
DSCR
20% down · 8.5% · 30yr
- Down + closing
- —
- Monthly P&I
- —
- Monthly cashflow
- —
- DSCR
- —
- Eligible?
- —
No personal income docs; deal must DSCR.
Hard money
10% down · 12.0% · 12mo
- Down + closing
- —
- Monthly P&I
- —
- Monthly cashflow
- —
- DSCR
- —
- Eligible?
- —
Short-term bridge; refi at stabilization.
Listing history 16 events
-
2026-06-18days on market $9,999,990 Active 55 DOM
-
2026-06-17days on market $9,999,990 Active 54 DOM
-
2026-06-16days on market $9,999,990 Active 53 DOM
-
2026-06-15days on market $9,999,990 Active 52 DOM
-
2026-06-13days on market $9,999,990 Active 50 DOM
-
2026-06-09days on market $9,999,990 Active 46 DOM
-
2026-06-08days on market $9,999,990 Active 45 DOM
-
2026-06-07days on market $9,999,990 Active 44 DOM
-
2026-06-04days on market $9,999,990 Active 41 DOM
-
2026-06-03days on market $9,999,990 Active 40 DOM
-
2026-06-02days on market $9,999,990 Active 39 DOM
-
2026-06-01days on market $9,999,990 Active 38 DOM
-
2026-05-31days on market $9,999,990 Active 37 DOM
-
2026-04-24$9,999,990 Active 3409-char remark
-
2025-05-06$10,490,000 Active
-
2023-01-13soldstatus $1,930,000
ⓘ Source: listings_history table (triggers on properties + properties_extension) + one-shot
backfill from property_details.listing_events for pre-trigger history.
Climate risk First Street
- Flood 3/10 Moderate FEMA zone X (unshaded) · 12% chance over 30 yrs
- Wildfire 1/10 Low
- Heat 4/10 Moderate 7 d/yr ≥90°F today · 19 d/yr by 30 yrs out
- Wind 8/10 Severe 80% chance of damaging wind over 30 yrs
- Air quality 4/10 Moderate 4 unhealthy d/yr today · 5 by 30 yrs out
Nearby sold comps map
Loading sold comps map…
Walkable amenities ~0.75 mi
Loading nearby amenities…
Taxation est. · year 1
- Rental income
- $299,356
- − Mortgage interest
- −$560,155
- − Property taxes
- −$150,000
- − Insurance
- −$50,000
- − Repairs & maintenance
- −$23,949
- − Management
- −$23,949
- − Depreciation
- −$290,909
- Taxable loss
- −$799,604
- Est. tax savings @ 24.0%
- +$191,905
- After-tax cash flow
- $-400,896/yr
For passive investors: Depreciation is non-cash, so a rental often shows a tax loss while cash-flowing — sheltering income. Rental losses are passive: they offset passive income freely, and up to $25,000/yr can offset ordinary (W-2) income if you actively participate and your MAGI is under $100k (phasing out to $0 by $150k); unused losses carry forward. On sale, claimed depreciation is recaptured at up to 25%, and gains may owe capital-gains tax (a 1031 exchange can defer both). Figures are a year-1 estimate at your 24.0% rate — not tax advice; consult a CPA.
Schools (NCES district)
- District
- Westhampton Beach Union Free School District
- NCES district ID
- 3631020
- Math proficiency
- 72% ▼ -5.00%
- Reading proficiency
- 75% ▲ 3.00%
- Median HH income
- $88,137
- Composite
- 65.91/100
- National rank
- #444
- State rank
- #81 of 590 in NY
Livability — Westhampton Beach
- Score
- 64/100
- State rank
- #740
- US rank
- #14093
Category grades
Schools grade is shown separately in the Schools card above.
Census & demographics
- Census place
- Westhampton Beach, NY
- County
- Suffolk County · 679,920 people
- City population
- 4,705
- Metro
- New York-Newark-Jersey City, NY-NJ-PA
- Population (ZIP)
- 4,705
- Household income
- $125,179
- Rent vs Own
- Severe rent burden
- 43.0
Population outlook (Suffolk County) Hauer SSP2
- Today (2025)
- 1,505,262 people
- By 2030
- 1,498,318 · -0.5%
- By 2040
- 1,471,101 · -2.3%
- By 2050
- 1,424,848 · -5.3%
- By 2075
- 1,337,157 · -11.2%
- By 2100
- 1,217,720 · -19.1%
Race, ethnicity, and origin ACS 2023
- Neighborhood character
- Predominantly White (72%)
- Race & ethnicity
- White 72% Two or more races 14% Hispanic / Latino 11% Black 6% Asian 2%
- Hispanic origin (detail)
- Puerto Rican 1%
- Common ancestry
- Romanian 7% Scotch-Irish 2% Italian 2%
- Foreign-born
- 14% · Canada, Jamaica, China
- Languages at home
- 84% English-only · Spanish 10% Other Indo-European 2% Russian/Polish/Slavic 1%
Political lean MEDSL · Suffolk
- 2024 margin
- Lean R (+10.0) · D 45.0% · R 55.0%
- 2008→2024 swing
- -16.0pp toward R · 2008: 6.0pp · 2024: -10.0pp
- All cycles
- 2024: R+10.0 2020: R+0.0 2016: R+8.2 2012: D+2.9 2008: D+6.0
Not yet ingested
- Civics
- —
Market trends
- HPI YoY
- ▲ 13.02%
- Current HPI
- 460.3964
- Rent YoY
- —
- Metro
- New York-Newark-Jersey City, NY-NJ-PA
- State GDP YoY
- ▲ 2.60%
- F500 in state
- 92
Industry mix (Fortune 500 HQ in NY)
| Industry | F500 HQs | Revenue |
|---|---|---|
| Financial Services | 10 | $950B |
|
||
| Consumer Goods | 9 | $162B |
|
||
| Insurance | 4 | $225B |
|
||
| Telecommunications | 2 | $144B |
|
||
| Pharmaceuticals | 2 | $112B |
|
||
| Media / Entertainment | 2 | $69B |
|
||
Price history
+418.1% since first listed3 events — show timeline
- 2026-04-24 Listed $9,999,990 OneKey® MLS as Distributed by MLS Grid
- 2025-05-06 Listed $10,490,000 OneKey® MLS as Distributed by MLS Grid
- 2023-01-13 Sold (Public Records) $1,930,000 Public Records
Property tax history
-3.9%/yrLatest (2025): $3,961 · +11.9% YoY. Source: county tax records.
Cash-flow waterfall
monthlySold comps — $/sqft
last 12 mo · ≤1 miLoading sold comps…