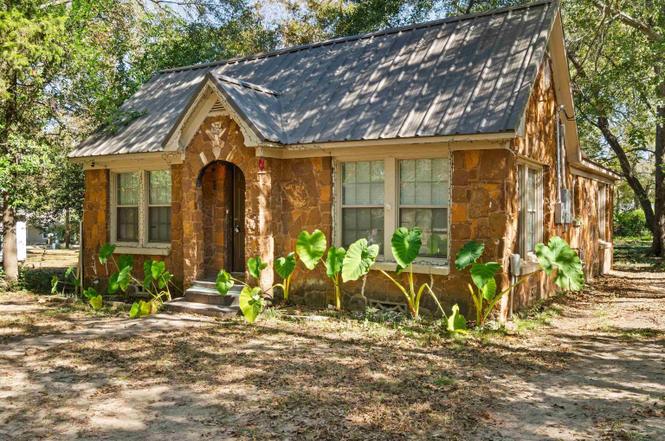
209 Polk St · Gilmer, TX
Flood risk 1/10 · Minimal
- FEMA flood zone
- X (unshaded)
- Chance of flooding over 30 yrs
- 0.0%
- Est. flood insurance / yr
- $507 – $1,088
Fire risk 6/10 · Moderate
- Est. fire insurance / yr
- $1,222 – $2,270
Heat risk 7/10 · Major
- Hot days now (above 111°F)
- 7 days/yr
- Hot days in 30 yrs
- 25 days/yr
Wind risk 6/10 · Moderate
- Chance of severe wind over 30 yrs
- 45.0%
Air-quality risk 2/10 · Minimal
- Unhealthy air days now
- 1 days/yr
- Unhealthy air days in 30 yrs
- 1 days/yr
Risk factors via First Street. Map © Google.
Why this score? — see what drove the D+ grade
The composite is a weighted blend of 9 inputs, each scored 0–100. Each bar is that input's sub-score; the figure is the points it added to the 100-point composite (weight × sub-score).
- ARV discount +15.0/15.0
- Appreciation +10.0/10.0
- Cash flow +8.1/30.0
- Schools +3.5/10.0
- 1% rule +2.9/10.0
- Livability +2.9/5.0
- Rent growth +2.5/5.0
- Condition / age +2.5/5.0
- DSCR +2.2/10.0
$139,999
🖨 Deal sheet 📄 Offer letter ✓ Due diligence
Listing remarks MLS
This home has been completely remodeled 2 bedroom 2 bath with. new walls, fresh paint, new floors, new cabinets, new electrical, new HVAC, new tankless water heater, double pain windows, metal roof, new ceiling fans and a gas logs ventless fireplace. Inside photos are coming soon!!
Key facts
- Open-concept kitchen
- Gas fireplace
- Backyard
Tags
Neighborhood map
What this means for you Summary
Snapshot
- This is a 2-bed/2.0-bath single-family listed at $140k.
Deal economics
- At list price, monthly cash flow is $-135 ($-2k/yr) — negative.
- To cash-flow at today's rent, offer at most $116k (17.1% below list).
- To meet the 1% rule (rent ≥ 1% of price), the offer needs to be $110k (21.2% below list).
- Recommended offer: $110k (21.2% below list) — sets the bar for 1% rule.
- Cap rate 5.1% vs local median 2.9% in Gilmer — top-decile yield for the area; either an underpriced asset or a hidden risk that comps aren't pricing in. Stress-test before assuming the spread holds.
Location & tenants
- Location reads 57/100 on livability (#1,257 in TX) — a working-class tenant base; expect higher turnover. Strengths: cost of living A+, housing A+; Watch: schools D-, amenities F, commute F.
- Gilmer ISD (town): math 44% / reading 38% proficiency, ranked #372 of 826 in TX (top 45%) — families likely to look elsewhere, expect single-tenant / working-renter base with shorter leases.
- Market conditions: 207 active listings in the ZIP; 2 comparable units currently listed for rent nearby; 34 units permitted in Upshur County in 2024 (0 in 5+ unit buildings).
Forward outlook
- In year one you build about $15k of equity ($968 loan paydown + $14k appreciation (10.0% local appreciation)).
- Upshur County population projected at +9% by 2050 — modest demand growth; plan on rents tracking national, not racing it.
- By year 3, paydown + projected appreciation supports a ~$38k cash-out refi (75% LTV) — recoverable capital for the next deal without selling this one.
Negotiation context
- It's been on market 93 days — a 9% lower offer ($127k) is reasonable based on typical stale-listing flexibility.
- 5 sale attempts since 10y ago; this cycle's ask has dropped $23k (14%) from the opening price — seller is motivated, your offer sets the floor, not the list.
Risks & watch-outs
- Watch-outs: built in 1930 — expect roof / HVAC / electrical / plumbing capex.
- Climate carrying-cost: major wind risk, 45% chance of damaging wind over 30y; major wildfire risk; extreme-heat days projected 7→25/yr by 2055 (HVAC capex compounding) — expect insurance premiums to compound above CPI over the hold.
Questions for the listing agent
- What do current leases actually rent for vs. the listed asking? Can we see a recent rent roll and the last 12 months of T-12 income?
- It's been on market 93 days. Have you received any prior offers? Is the seller open to a 21% concession, seller financing, or rate buy-down credit?
- Built in 1930 — when were the roof, HVAC, electrical panel, plumbing, and water heater last replaced?
- Why hasn't it sold? Are there any deal-killer items the seller is aware of (foundation, flood, title, zoning, code violations)?
- Is there a deadline driving the sale (1031 exchange, divorce, estate, relocation)? That informs how much negotiation room exists.
- Schools are D-rated, which usually means shorter tenancies and higher turnover. Who's the typical renter profile here, and what's been the actual vacancy rate?
- The area grade is low — what's the realistic commute time and amenity access for the typical tenant pool here? Any planned neighborhood developments (good or bad) we should know about?
- What's the average days-on-market for RENTAL listings here right now (not sales)? A rising rental-DOM trend means longer vacancies and softer asking-rent achievability than the comps imply.
- What's the recent tenant-quality profile in this submarket — average credit score on applications, eviction rate, late-payment / NSF rate, and stable-employment percentage? A property-management company in the area should have these aggregated.
- How much new for-sale + rental construction is in the pipeline within 1–3 miles? Heavy new supply typically softens prices + rents 12–24 months out; constrained supply supports both.
Investment metrics
- 1% rule
- 0.79% ✗
- Cap rate
- 5.13%
- Cash-on-cash
- -4.14%
- DSCR
- 0.82
- GRM
- 10.6
CMA / ARV
- ARV (on-the-fly)
- $169,350
- Comps found
- 2
Show comp detail 2 sales within ~0.75 mi
| Address | Dist | Beds/Ba | Sqft | Sold | Price | $/sf | Match |
|---|---|---|---|---|---|---|---|
| 603 W Harrison St | 0.04mi | 2/1.0 | 1,110 (-2%) | 8mo | $160,000 | $144 | 84 |
| 800 W Butler | 0.14mi | 3/2.0 (+1) | 1,033 (-8%) | 12mo | $155,000 | $150 | 64 |
Match score weights: distance 35% · size 25% · config 20% · recency 20%. Top-matched comps best support the ARV.
Projected returns pro-forma
10.0% appreciation · 3.0% rent growth · sell at horizon
- IRR
- 21.3%
- Equity multiple
- 2.73×
- Total profit
- $67,670
- Equity at exit
- $126,122
- IRR
- 19.3%
- Equity multiple
- 6.26×
- Total profit
- $206,136
- Equity at exit
- $271,987
Cash invested: $39,200 (down + closing). Projections, not guarantees.
Landlord ↔ Tenant lean methodology
- Overall (STATE)
- 87 Strongly Landlord-Friendly
- State Texas
- 87 Strongly Landlord-Friendly · R+5
- County
- — inherits STATE
- City
- — inherits STATE
ZIP-level market 75644
- Home prices YoY
- 10.0%
- Active inventory
- 207
- Price-to-rent
- 10.6×
Monthly cashflow live
- Estimated rent
- $1,104 medium interval (Pro) →
- Mortgage (P&I)
- −$734
- Tax from tax record
- −$215 /mo · $2,578/yr
- Insurance
- −$58
- HOA
- −$0
- Vacancy / Maint / Mgmt
- −$232
- Net cashflow
- $-135
Break-even live
UW: 25.0% down · 7.5% · 30yr · 1.5% tax · 5.0% vac · 8.0% maint · 8.0% mgmt
Financing live
Cash to close
- Down payment
- $35,000
- Closing costs
- $4,200
- Reserves months
- —
- Total cash needed
- —
Loan-product check · same deal, 3 products live
Conventional
25% down · 7.5% · 30yr
- Down + closing
- —
- Monthly P&I
- —
- Monthly cashflow
- —
- DSCR
- —
- Eligible?
- —
Personal DTI + credit; lowest rate.
DSCR
20% down · 8.5% · 30yr
- Down + closing
- —
- Monthly P&I
- —
- Monthly cashflow
- —
- DSCR
- —
- Eligible?
- —
No personal income docs; deal must DSCR.
Hard money
10% down · 12.0% · 12mo
- Down + closing
- —
- Monthly P&I
- —
- Monthly cashflow
- —
- DSCR
- —
- Eligible?
- —
Short-term bridge; refi at stabilization.
Rent comps 2 comps
| Address | Beds | Baths | Sqft | Rent | $/sqft | DOM | Units | Dist |
|---|---|---|---|---|---|---|---|---|
| 620 Mary St Gilmer, TX | 3.0 | 1.0 | 1220 | $1,200 | $0.98 | 43d | 1 | 0.62mi |
| 300 Pecan St Unit 8 Gilmer, TX | 2.0 | 1.0 | 875 | $975 | $1.11 | 43d | 1 | 0.69mi |
Listing history 18 events
-
2026-03-04soldstatus
-
2026-01-30status Pending
-
2026-01-06price $139,999
-
2025-12-17price $149,000
-
2025-12-10price $152,000
-
2025-11-15price $157,000
-
2025-10-29$163,000 Active
-
2018-08-06soldstatus 282-char remark
Show marketing remark (282 chars)
This home has been completely remodeled 2 bedroom 2 bath with. new walls, fresh paint, new floors, new cabinets, new electrical, new HVAC, new tankless water heater, double pain windows, metal roof, new ceiling fans and a gas logs ventless fireplace. Inside photos are coming soon!!
-
2018-08-01soldstatus
-
2018-07-02$86,000 282-char remark
Show marketing remark (282 chars)
This home has been completely remodeled 2 bedroom 2 bath with. new walls, fresh paint, new floors, new cabinets, new electrical, new HVAC, new tankless water heater, double pain windows, metal roof, new ceiling fans and a gas logs ventless fireplace. Inside photos are coming soon!!
-
2017-04-19soldstatus 351-char remark
Show marketing remark (351 chars)
BRING YOUR HANDYMAN SKILLS! THIS HOUSE IS A SHELL WAITING FOR YOU TO CREATE YOUR OWN INSIDE! ENDLESS POSSIBILITIES! SET IT UP AS A 2/2 HOME OR HOWEVER YOU DESIRE AND ENJOY! THE HOUSE RECENTLY HAD A METAL ROOF PUT ON IT AND WINDOWS INSTALLED THROUGHOUT. THIS IS JUST BLOCKS FROM DOWNTOWN AND WOULD MAKE A PERFECT STARTER HOME OR INVESTMENT PROPERTY.
-
2017-04-19soldstatus
Show marketing remark (351 chars)
BRING YOUR HANDYMAN SKILLS! THIS HOUSE IS A SHELL WAITING FOR YOU TO CREATE YOUR OWN INSIDE! ENDLESS POSSIBILITIES! SET IT UP AS A 2/2 HOME OR HOWEVER YOU DESIRE AND ENJOY! THE HOUSE RECENTLY HAD A METAL ROOF PUT ON IT AND WINDOWS INSTALLED THROUGHOUT. THIS IS JUST BLOCKS FROM DOWNTOWN AND WOULD MAKE A PERFECT STARTER HOME OR INVESTMENT PROPERTY.
-
2017-04-10$29,900 351-char remark
Show marketing remark (351 chars)
BRING YOUR HANDYMAN SKILLS! THIS HOUSE IS A SHELL WAITING FOR YOU TO CREATE YOUR OWN INSIDE! ENDLESS POSSIBILITIES! SET IT UP AS A 2/2 HOME OR HOWEVER YOU DESIRE AND ENJOY! THE HOUSE RECENTLY HAD A METAL ROOF PUT ON IT AND WINDOWS INSTALLED THROUGHOUT. THIS IS JUST BLOCKS FROM DOWNTOWN AND WOULD MAKE A PERFECT STARTER HOME OR INVESTMENT PROPERTY.
-
2017-03-09$29,900
-
2016-05-20soldstatus
-
2016-04-19$12,900
-
2007-04-05soldstatus
ⓘ Source: listings_history table (triggers on properties + properties_extension) + one-shot
backfill from property_details.listing_events for pre-trigger history.
Tax reassessment forecast TX · Resets to sale price
- Current annual tax
- $2,578 · $215/mo
- Projected year-2 tax
- $2,578 · $215/mo
- Expected delta
- $0/yr ($0/mo · 0.0%)
ⓘ Screening estimate from a state-policy table — verify with the county assessor before closing.
Climate risk First Street
- Flood 1/10 Low FEMA zone X (unshaded) · 0% chance over 30 yrs
- Wildfire 6/10 Major
- Heat 7/10 Severe 7 d/yr ≥111°F today · 25 d/yr by 30 yrs out
- Wind 6/10 Major 45% chance of damaging wind over 30 yrs
- Air quality 2/10 Low 1 unhealthy d/yr today · 1 by 30 yrs out
Nearby sold comps map
Loading sold comps map…
Walkable amenities ~0.75 mi
Loading nearby amenities…
Taxation est. · year 1
- Rental income
- $13,246
- − Mortgage interest
- −$7,842
- − Property taxes
- −$2,578
- − Insurance
- −$700
- − Repairs & maintenance
- −$1,060
- − Management
- −$1,060
- − Depreciation
- −$4,073
- Taxable loss
- −$4,066
- Est. tax savings @ 24.0%
- +$976
- After-tax cash flow
- $-648/yr
For passive investors: Depreciation is non-cash, so a rental often shows a tax loss while cash-flowing — sheltering income. Rental losses are passive: they offset passive income freely, and up to $25,000/yr can offset ordinary (W-2) income if you actively participate and your MAGI is under $100k (phasing out to $0 by $150k); unused losses carry forward. On sale, claimed depreciation is recaptured at up to 25%, and gains may owe capital-gains tax (a 1031 exchange can defer both). Figures are a year-1 estimate at your 24.0% rate — not tax advice; consult a CPA.
Schools (NCES district)
- District
- Gilmer ISD
- NCES district ID
- 4820700
- Math proficiency
- 44% ▼ -8.00%
- Reading proficiency
- 38% ▼ -3.00%
- Median HH income
- $46,724
- Composite
- 35.04/100
- National rank
- #5038
- State rank
- #372 of 826 in TX
Livability — Gilmer
- Score
- 57/100
- State rank
- #1257
- US rank
- #21903
Category grades
Schools grade is shown separately in the Schools card above.
Census & demographics
- Census place
- Gilmer, TX
- Population (ZIP)
- 12,785
Population outlook (Upshur County) Hauer SSP2
- Today (2025)
- 42,771 people
- By 2030
- 43,788 · +2.4%
- By 2040
- 45,574 · +6.6%
- By 2050
- 46,683 · +9.1%
- By 2075
- 49,137 · +14.9%
- By 2100
- 47,457 · +11.0%
Race, ethnicity, and origin ACS 2023
- Neighborhood character
- Predominantly White (73%)
- Race & ethnicity
- White 73% Black 11% Hispanic / Latino 10% Two or more races 10%
- Hispanic origin (detail)
- Mexican 10%
- Common ancestry
- Serbian 4% Slovak 2% Lithuanian 2%
- Foreign-born
- 2% · Canada, Philippines
- Languages at home
- 95% English-only · Spanish 4% Chinese 1%
Political lean MEDSL · Upshur
- 2024 margin
- Solid R (+71.0) · D 14.2% · R 85.2%
- 2008→2024 swing
- -22.0pp toward R · 2008: -49.0pp · 2024: -71.0pp
- All cycles
- 2024: R+71.0 2020: R+68.5 2016: R+68.0 2012: R+59.8 2008: R+49.0
Not yet ingested
- Civics
- —
Market trends
- HPI YoY
- ▲ 27.46%
- Current HPI
- 300.86
- Rent YoY
- —
- Metro
- —
- State GDP YoY
- ▲ 3.95%
- F500 in state
- 110
Industry mix (Fortune 500 HQ in TX)
| Industry | F500 HQs | Revenue |
|---|---|---|
| Energy | 16 | $1,198B |
|
||
| Technology | 5 | $198B |
|
||
| Engineering / Construction | 4 | $72B |
|
||
| Energy Services | 3 | $60B |
|
||
| Utilities | 3 | $41B |
|
||
| Healthcare | 2 | $330B |
|
||
Price history
+985.3% since first listed18 events — show timeline
- 2026-03-04 Sold (Public Records) — Public Records
- 2026-01-30 Pending — LAAR
- 2026-01-06 Price Changed $139,999 LAAR
- 2025-12-17 Price Changed $149,000 LAAR
- 2025-12-10 Price Changed $152,000 LAAR
- 2025-11-15 Price Changed $157,000 LAAR
- 2025-10-29 Listed $163,000 LAAR
- 2018-08-06 Sold (MLS) — LAAR
- 2018-08-01 Sold (Public Records) — Public Records
- 2018-07-02 Listed $86,000 LAAR
- 2017-04-19 Sold (Public Records) — Public Records
- 2017-04-19 Sold (MLS) — LAAR
- 2017-04-19 Sold (MLS) — GTAR
- 2017-04-10 Listed $29,900 GTAR
- 2017-03-09 Listed $29,900 LAAR
- 2016-05-20 Sold (MLS) — LAAR
- 2016-04-19 Listed $12,900 LAAR
- 2007-04-05 Sold (Public Records) — Public Records
Property tax history
+10.0%/yrLatest (2025): $2,578 · +4.0% YoY. Source: county tax records.
Cash-flow waterfall
monthlySold comps — $/sqft
last 12 mo · ≤1 miLoading sold comps…