 Duplex
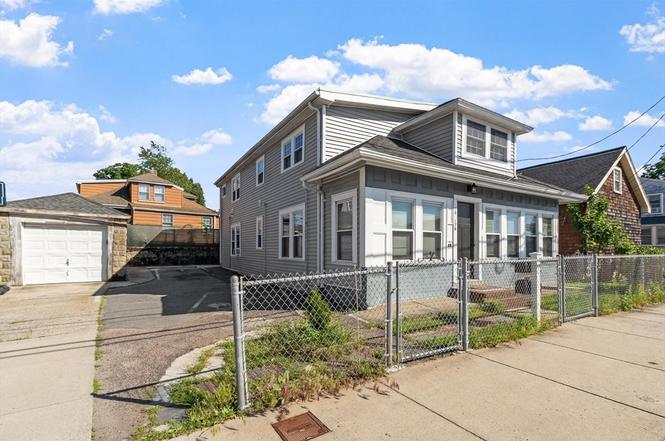
176 Washington St · Dedham, MA
Flood risk 1/10 · Minimal
- FEMA flood zone
- X (unshaded)
- Chance of flooding over 30 yrs
- 0.0%
- Est. flood insurance / yr
- $473 – $860
Fire risk 3/10 · Minor
- Est. fire insurance / yr
- $915 – $1,699
Heat risk 6/10 · Moderate
- Hot days now (above 96°F)
- 7 days/yr
- Hot days in 30 yrs
- 15 days/yr
Wind risk 6/10 · Moderate
- Chance of severe wind over 30 yrs
- 59.0%
Air-quality risk 2/10 · Minimal
- Unhealthy air days now
- 1 days/yr
- Unhealthy air days in 30 yrs
- 3 days/yr
Risk factors via First Street. Map © Google.
Why this score? — see what drove the D grade
The composite is a weighted blend of 9 inputs, each scored 0–100. Each bar is that input's sub-score; the figure is the points it added to the 100-point composite (weight × sub-score).
- Cash flow +14.3/30.0
- ARV discount +8.2/15.0
- DSCR +4.4/10.0
- Schools +4.3/10.0
- Livability +4.1/5.0
- 1% rule +3.3/10.0
- Rent growth +3.1/5.0
- Condition / age +2.5/5.0
- Appreciation +0.0/10.0
$849,900
🖨 Deal sheet (PDF) 📄 Offer letter ✓ Due diligence
Multi-family units
County records classify this as Multi-Family (2-4 Unit). Listing-text estimate: 2 units. confirmed
Listing remarks MLS
Great two family with plenty of off street parking, close to major highway, transportation and shopping. Newer replacement windows, below assessed value. Great rents. Perfect for investment.
Key facts
- Renovated kitchens
- Turnkey multifamily
- Two-family property
Tags
Property features AI
Finance
- Other: Property status: Active
- HOA & community: Community features include public transportation, shopping, parks, golf, highway access, and a T-Station; Not a senior community
Exterior
- Parking: 1-car garage (covered); 2 off-street open parking spaces; Total 3 parking spaces
- Utilities: Public water; Public sewer; 200+ amp electric service
- Home design: 2-family, two-unit up/down; 2 stories; Above-grade finished area listed
- Construction: Frame construction; Stone foundation; Shingle roof; Built year per public records (actual)
- Exterior features: Patio; Level lot; Public road frontage
Interior
- Kitchen: Range; Refrigerator
- Bedrooms: Unit 1: 1 level; Unit 2: 1 level
- Flooring: Hardwood; Wood
- Bathrooms: 2 full bathrooms
- Heating & cooling: Natural gas heating; Electric heating; Has heating
- Interior features: Lead certification treated; Bathroom with tub and shower; Internet available; Upgraded cabinets; Living room; Kitchen; Office/Den; Sunroom; Laundry room; Total of 8 rooms
- Laundry & utility: Laundry room
Neighborhood map
What this means for you Summary
Snapshot
- This is a 2 × 3-bed/1.0-bath units multifamily listed at $850k.
Deal economics
- At list price, monthly cash flow is $163 ($2k/yr) — positive. Per door: $81/mo.
- The deal already cash-flows at list — no discount required.
- To meet the 1% rule (rent ≥ 1% of price), the offer needs to be $708k (16.7% below list).
- Recommended offer: $708k (16.7% below list) — sets the bar for 1% rule.
- Cap rate 6.5% vs local median 3.3% in Dedham — top-decile yield for the area; either an underpriced asset or a hidden risk that comps aren't pricing in. Stress-test before assuming the spread holds.
Location & tenants
- Location reads 82/100 on livability (#24 in MA, #1,061 nationally) — a professional / high-income tenant draw. Strengths: commute A+, employment A+, housing A+; Watch: cost of living F.
- Dedham (suburban): math 42% / reading 51% proficiency, ranked #140 of 302 in MA (top 46%) — families likely to look elsewhere, expect single-tenant / working-renter base with shorter leases.
- Zoned schools: Early Childhood Center (307 students, 0% FRL); Dedham Middle School (math 40% / reading 43%, grade F, #133 of 305 statewide, top 45%, 540 students, 0% FRL); Dedham High (math 67% / reading 72%, grade B, #85 of 343 statewide, top 26%, 715 students, 0% FRL) — zoned schools average 0% FRL vs 22% district-wide (22 pts lower); this property's tenant base skews higher-income than the district average.
- Market conditions: Rents rising (+2.3%/yr); 50 active listings in the ZIP; 3 comparable units currently listed for rent nearby; rentals at typical pace (median 18d on market — plan ~3-4 weeks tenant-placement turnaround); high-income renter base; 958 units permitted in Norfolk County in 2024 (305 in 5+ unit buildings).
- At $7,082/mo this rent would consume 66% of the median local household income ($129k/yr) (locally 667% of renters already pay >50% of income on rent) — very limited rent-growth headroom before tenants either downsize or default.
Forward outlook
- Local home prices are declining (-3.0%/yr); year-one equity from $6k of loan paydown is wiped out by about $25k of value loss. Plan a longer hold.
- Norfolk County population projected at +10% by 2050 — modest demand growth; plan on rents tracking national, not racing it.
Negotiation context
- Only 6 days on market — expect competitive offers; lowballing is unlikely to land.
- 2 sale attempts since 17y ago with the ask held roughly flat each time — persistent listings suggest the price (not the market) is what's stuck; bring a comps-based counter.
- Current owner paid $205k; list at $850k implies a 315% gain — meaningful room to come down on a strong offer.
Risks & watch-outs
- Watch-outs: built in 1900 — expect roof / HVAC / electrical / plumbing capex.
- Climate carrying-cost: major wind risk, 59% chance of damaging wind over 30y; extreme-heat days projected 7→15/yr by 2055 (HVAC capex compounding) — expect insurance premiums to compound above CPI over the hold.
Questions for the listing agent
- Can we see the unit-by-unit rent roll, current vacancy, and any below-market leases? What's the average tenancy length?
- What capital expenditures (roof, boiler, parking lot, exteriors) have been made in the last 5 years, and what's planned in the next 2?
- Built in 1900 — when were the roof, HVAC, electrical panel, plumbing, and water heater last replaced?
- Is there a deadline driving the sale (1031 exchange, divorce, estate, relocation)? That informs how much negotiation room exists.
- Schools are B-rated — typically a magnet for longer-tenancy family renters. What's the average tenant stay here, and is there a school-zone premium baked into asking?
- The area grade is low — what's the realistic commute time and amenity access for the typical tenant pool here? Any planned neighborhood developments (good or bad) we should know about?
- What's the average days-on-market for RENTAL listings here right now (not sales)? A rising rental-DOM trend means longer vacancies and softer asking-rent achievability than the comps imply.
- What's the recent tenant-quality profile in this submarket — average credit score on applications, eviction rate, late-payment / NSF rate, and stable-employment percentage? A property-management company in the area should have these aggregated.
- How much new apartment / multifamily construction is in the pipeline within 1–3 miles? Heavy new supply (>2% of stock underway) typically softens rents 12–24 months out; light construction supports rent growth.
Investment metrics
- 1% rule
- 0.83% ✗
- Cap rate
- 6.52%
- Cash-on-cash
- 0.82%
- DSCR
- 1.04
- GRM
- 10.0
CMA / ARV
- ARV (on-the-fly)
- $863,910
- Comps found
- 1
Show comp detail 1 sale within ~0.75 mi
| Address | Dist | Beds/Ba | Sqft | Sold | Price | $/sf | Match |
|---|---|---|---|---|---|---|---|
| 25-27 Belknap St | 0.56mi | 6/3.0 (+1) | 1,909 (-4%) | 9mo | $830,000 | $435 | 51 |
Match score weights: distance 35% · size 25% · config 20% · recency 20%. Top-matched comps best support the ARV.
Projected returns pro-forma
-3.0% appreciation · 2.29% rent growth · sell at horizon
- IRR
- -15.8%
- Equity multiple
- 0.44×
- Total profit
- $-132,547
- Equity at exit
- $126,723
- IRR
- -8.5%
- Equity multiple
- 0.48×
- Total profit
- $-123,067
- Equity at exit
- $73,484
Cash invested: $237,972 (down + closing). Projections, not guarantees.
Landlord ↔ Tenant lean methodology
- Overall (STATE)
- 20 Strongly Tenant-Friendly
- State Massachusetts
- 20 Strongly Tenant-Friendly · D+15
- County
- — inherits STATE
- City
- — inherits STATE
ZIP-level market 02026
- Rents YoY
- 2.3%
- Active inventory
- 50
- Price-to-rent
- 20.0×
Monthly cashflow live
- Estimated rent
- $7,082 high interval (Pro) →
- Mortgage (P&I)
- −$4,457
- Tax from tax record
- −$621 /mo · $7,452/yr
- Insurance
- −$354
- HOA
- −$0
- Vacancy / Maint / Mgmt
- −$1,487
- Net cashflow
- $163
Break-even live
Sensitivity live
| Price | -10% $644 | -5% $403 | +0% $163 | +5% $-78 | +10% $-318 |
|---|---|---|---|---|---|
| Rent | -10% $-397 | -5% $-117 | +0% $163 | +5% $442 | +10% $722 |
| Rate | -1.0pp $591 | -0.5pp $379 | base $163 | +0.5pp $-58 | +1.0pp $-282 |
2-unit breakdown (identical units grouped — click to expand)
| Units | Beds | Baths | Est. rent |
|---|---|---|---|
| 2× units | 3 | 1 | $7,082 |
| #1 | 3 | 1 | $3,541 |
| #2 | 3 | 1 | $3,541 |
| Total (2 units) | $7,082 | ||
UW: 25.0% down · 7.5% · 30yr · 1.5% tax · 5.0% vac · 8.0% maint · 8.0% mgmt
Financing live
Cash to close
- Down payment
- $212,475
- Closing costs
- $25,497
- Reserves months
- —
- Total cash needed
- —
Loan-product check · same deal, 3 products live
Conventional
25% down · 7.5% · 30yr
- Down + closing
- —
- Monthly P&I
- —
- Monthly cashflow
- —
- DSCR
- —
- Eligible?
- —
Personal DTI + credit; lowest rate.
DSCR
20% down · 8.5% · 30yr
- Down + closing
- —
- Monthly P&I
- —
- Monthly cashflow
- —
- DSCR
- —
- Eligible?
- —
No personal income docs; deal must DSCR.
Hard money
10% down · 12.0% · 12mo
- Down + closing
- —
- Monthly P&I
- —
- Monthly cashflow
- —
- DSCR
- —
- Eligible?
- —
Short-term bridge; refi at stabilization.
Rent comps 3 comps
| Address | Beds | Baths | Sqft | Rent | $/sqft | DOM | Units | Dist |
|---|---|---|---|---|---|---|---|---|
| 85 Lower East St Unit 2 Dedham, MA | 4.0 | 1.0 | 1400 | $4,000 | $2.86 | 45d | 1 | 0.25mi |
| 17 Linden Pl Unit 2 Dedham, MA | 4.0 | 1.0 | 1769 | $4,000 | $2.26 | 18d | 1 | 0.38mi |
| 73 Walnut St Unit 1 Dedham, MA | 4.0 | 1.5 | 2104 | $4,750 | $2.26 | 6d | 1 | 0.81mi |
Listing history 5 events
-
2026-06-21statusdays on market $849,900 Active 6 DOM
-
2026-06-18days on market $849,900 New 3 DOM
-
2026-06-17days on market $849,900 New 2 DOM
-
2026-06-15remarks 699-char remark
-
2026-06-15$849,900 New 1 DOM
ⓘ Source: listings_history table (triggers on properties + properties_extension) + one-shot
backfill from property_details.listing_events for pre-trigger history.
Tax reassessment forecast MA · Partial reset (capped growth)
- Current annual tax
- $7,452 · $621/mo
- Projected year-2 tax
- $8,953 · $746/mo
- Expected delta
- +$1,501/yr (+$125/mo · 20.1%)
ⓘ Screening estimate from a state-policy table — verify with the county assessor before closing.
Climate risk First Street
- Flood 1/10 Low FEMA zone X (unshaded) · 0% chance over 30 yrs
- Wildfire 3/10 Moderate
- Heat 6/10 Major 7 d/yr ≥96°F today · 15 d/yr by 30 yrs out
- Wind 6/10 Major 59% chance of damaging wind over 30 yrs
- Air quality 2/10 Low 1 unhealthy d/yr today · 3 by 30 yrs out
Nearby sold comps map
Loading sold comps map…
Walkable amenities ~0.75 mi
Loading nearby amenities…
Taxation est. · year 1
- Rental income
- $84,984
- − Mortgage interest
- −$47,608
- − Property taxes
- −$7,452
- − Insurance
- −$4,250
- − Repairs & maintenance
- −$6,799
- − Management
- −$6,799
- − Depreciation
- −$24,724
- Taxable loss
- −$12,647
- Est. tax savings @ 24.0%
- +$3,035
- After-tax cash flow
- $4,988/yr
For passive investors: Depreciation is non-cash, so a rental often shows a tax loss while cash-flowing — sheltering income. Rental losses are passive: they offset passive income freely, and up to $25,000/yr can offset ordinary (W-2) income if you actively participate and your MAGI is under $100k (phasing out to $0 by $150k); unused losses carry forward. On sale, claimed depreciation is recaptured at up to 25%, and gains may owe capital-gains tax (a 1031 exchange can defer both). Figures are a year-1 estimate at your 24.0% rate — not tax advice; consult a CPA.
Schools (NCES district)
- District
- Dedham
- NCES district ID
- 2504050
- Math proficiency
- 42% ▼ -13.00%
- Reading proficiency
- 51% ▼ -1.00%
- Median HH income
- $83,826
- Composite
- 43.09/100
- National rank
- #3087
- State rank
- #140 of 302 in MA
Livability — Dedham
- Score
- 82/100
- State rank
- #24
- US rank
- #1061
Category grades
Schools grade is shown separately in the Schools card above.
Census & demographics
- Census place
- Dedham, MA
- County
- Norfolk County · 644,082 people
- City population
- 25,237
- Metro
- Boston-Cambridge-Newton, MA-NH
- Population (ZIP)
- 25,237
- Household income
- $128,955
- Rent vs Own
- Severe rent burden
- 667.0
Population outlook (Norfolk County) Hauer SSP2
- Today (2025)
- 737,259 people
- By 2030
- 755,213 · +2.4%
- By 2040
- 786,961 · +6.7%
- By 2050
- 813,019 · +10.3%
- By 2075
- 861,214 · +16.8%
- By 2100
- 845,063 · +14.6%
Race, ethnicity, and origin ACS 2023
- Neighborhood character
- Predominantly White (80%)
- Race & ethnicity
- White 80% Hispanic / Latino 8% Two or more races 7% Black 5% Asian 3%
- Hispanic origin (detail)
- Puerto Rican 2% Dominican 1%
- Common ancestry
- Lithuanian 4% Romanian 3% Scotch-Irish 2%
- Foreign-born
- 13% · Canada, China, Jamaica
- Languages at home
- 84% English-only · Spanish 5% Other Indo-European 4% Russian/Polish/Slavic 2%
Political lean MEDSL · Norfolk
- 2024 margin
- Strong D (+28.8) · D 63.3% · R 34.6% · Other 2.1%
- 2008→2024 swing
- +10.2pp toward D · 2008: 18.5pp · 2024: 28.8pp
- All cycles
- 2024: D+28.8 2020: D+36.3 2016: D+27.9 2012: D+16.1 2008: D+18.5
Not yet ingested
- Civics
- —
Market trends
- HPI YoY
- ▼ -463.28%
- Current HPI
- 279.0559
- Rent YoY
- ▲ 2.29%
- Metro
- Boston-Cambridge-Newton, MA-NH
- State GDP YoY
- ▲ 2.28%
- F500 in state
- 38
Industry mix (Fortune 500 HQ in MA)
| Industry | F500 HQs | Revenue |
|---|---|---|
| Technology | 3 | $17B |
|
||
| Insurance | 2 | $84B |
|
||
| Retail | 2 | $76B |
|
||
| Life Sciences | 1 | $43B |
|
||
| Energy Technology | 1 | $31B |
|
||
| Aerospace / Defense | 1 | $18B |
|
||
Price history
+240.1% since first listed5 events — show timeline
- 2026-06-15 Listed $849,900 MLS PIN
- 2009-12-05 Sold (MLS) $205,000 MLS PIN
- 2009-12-04 Sold (Public Records) $205,000 Public Records
- 2009-10-07 Contingent — MLS PIN
- 2009-09-28 Listed $249,900 MLS PIN
Property tax history
+4.0%/yrLatest (2023): $7,452 · +6.7% YoY. Source: county tax records.
Cash-flow waterfall
monthlySold comps — $/sqft
last 12 mo · ≤1 miLoading sold comps…