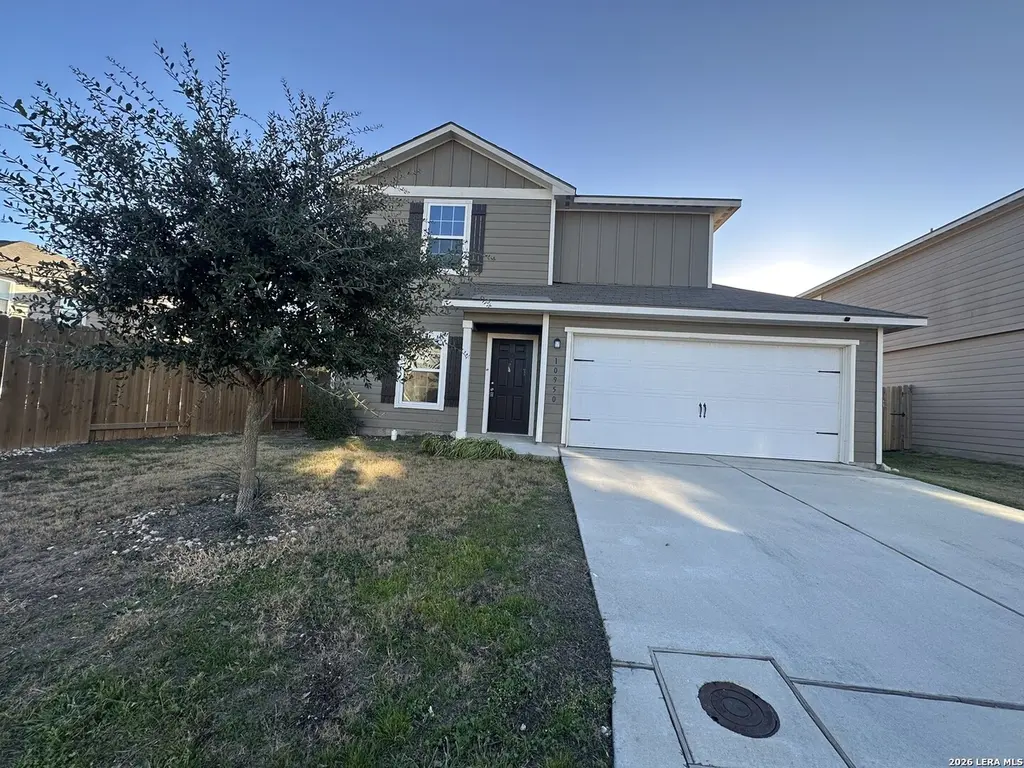
10950 Monterey Pike · San Antonio, TX
Flood risk 1/10 · Minimal
- FEMA flood zone
- X (unshaded)
- Chance of flooding over 30 yrs
- 0.0%
- Est. flood insurance / yr
- $507 – $1,088
Fire risk 3/10 · Minor
- Est. fire insurance / yr
- $1,222 – $2,270
Heat risk 8/10 · Major
- Hot days now (above 108°F)
- 7 days/yr
- Hot days in 30 yrs
- 22 days/yr
Wind risk 8/10 · Major
- Chance of severe wind over 30 yrs
- 80.0%
Air-quality risk 1/10 · Minimal
- Unhealthy air days now
- 0 days/yr
- Unhealthy air days in 30 yrs
- 0 days/yr
Risk factors via First Street. Map © Google.
Why this score? — see what drove the C- grade
The composite is a weighted blend of 9 inputs, each scored 0–100. Each bar is that input's sub-score; the figure is the points it added to the 100-point composite (weight × sub-score).
- Cash flow +16.2/30.0
- ARV discount +15.0/15.0
- 1% rule +6.9/10.0
- DSCR +5.0/10.0
- Livability +4.0/5.0
- Rent growth +2.2/5.0
- Condition / age +2.2/5.0
- Schools +1.9/10.0
- Appreciation +0.0/10.0
$146,851
🖨 Deal sheet 📄 Offer letter ✓ Due diligence
Listing remarks MLS
This fantastic home offers an open floor plan. A spacious fenced in backyard. Kitchen with breakfast bar and granite counter tops plus plenty of cabinet space. Spacious bedrooms finish this house off. Great possibilities await.
Key facts
- Open floor plan
- Fenced in backyard
- Granite counter tops
Tags
Neighborhood map
What this means for you Summary
Snapshot
- This is a 3-bed/2.5-bath single-family listed at $147k. Condition is rated fair.
Deal economics
- At list price, monthly cash flow is $78 ($930/yr) — positive.
- The deal already cash-flows at list — no discount required.
- Meets the 1% rule at list price ($2k rent vs $147k).
- Recommended offer: $134k (9.0% below list) — sets the bar for market timing.
- Cap rate 6.9% vs local median 3.8% in San Antonio — top-decile yield for the area; either an underpriced asset or a hidden risk that comps aren't pricing in. Stress-test before assuming the spread holds.
Location & tenants
- Location reads 80/100 on livability (#31 in TX, #1,616 nationally) — a professional / high-income tenant draw. Strengths: amenities A+, commute A+, cost of living A+; Watch: schools C-, crime F.
- East Central ISD (rural): math 16% / reading 25% proficiency, ranked #758 of 826 in TX (top 92%) — low school quality limits family demand, transient renter base, plan for 1-2y turnover; 61% free/reduced lunch — lower-income household profile, screen leases tightly.
- Market conditions: Rents soft (-1.1%/yr); 1152 active listings in the ZIP; 40 comparable units currently listed for rent nearby; rentals at typical pace (median 22d on market — plan ~3-4 weeks tenant-placement turnaround); solid renter incomes; 8,308 units permitted in Bexar County in 2024 (2,506 in 5+ unit buildings).
Forward outlook
- Local home prices are declining (-3.0%/yr); year-one equity from $1k of loan paydown is wiped out by about $4k of value loss. Plan a longer hold.
- Bexar County population projected at +50% by 2050 — long-run rental-demand tailwind backs the buy-and-hold thesis.
Negotiation context
- It's been on market 99 days — a 9% lower offer ($134k) is reasonable based on typical stale-listing flexibility.
- 8 sale attempts since 5y ago; this cycle's ask has dropped $26k (15%) from the opening price — seller is motivated, your offer sets the floor, not the list.
Risks & watch-outs
- Watch-outs: property tax is 3.6% of price.
- Climate carrying-cost: severe wind risk, 80% chance of damaging wind over 30y; extreme-heat days projected 7→22/yr by 2055 (HVAC capex compounding) — expect insurance premiums to compound above CPI over the hold.
Questions for the listing agent
- It's been on market 99 days. Have you received any prior offers? Is the seller open to a 9% concession, seller financing, or rate buy-down credit?
- Have any recent inspections been done? Can we get a copy of the seller's disclosures and any deferred-maintenance estimates?
- Property tax is high relative to price — has the assessment been appealed recently, and will the sale trigger a re-assessment?
- What does the HOA fee cover, when was the last increase, and are there any pending special assessments or reserve-fund shortfalls?
- Why hasn't it sold? Are there any deal-killer items the seller is aware of (foundation, flood, title, zoning, code violations)?
- Is there a deadline driving the sale (1031 exchange, divorce, estate, relocation)? That informs how much negotiation room exists.
- Crime grade is F in this area — have there been break-ins, vandalism, or insurance claims at this property in the last 3 years? What carrier currently insures it and at what premium?
- What's the average days-on-market for RENTAL listings here right now (not sales)? A rising rental-DOM trend means longer vacancies and softer asking-rent achievability than the comps imply.
- What's the recent tenant-quality profile in this submarket — average credit score on applications, eviction rate, late-payment / NSF rate, and stable-employment percentage? A property-management company in the area should have these aggregated.
- How much new for-sale + rental construction is in the pipeline within 1–3 miles? Heavy new supply typically softens prices + rents 12–24 months out; constrained supply supports both.
Investment metrics
- 1% rule
- 1.19% ✓
- Cap rate
- 6.93%
- Cash-on-cash
- 2.26%
- DSCR
- 1.10
- GRM
- 7.0
CMA / ARV
- ARV (median comp)
- $282,899
- List price
- $146,851
- Delta
- -48.09%
- Verdict
- UNDERPRICED
- Comps
- 20 within 1.0 mi
Show comp detail 12 sales within ~0.75 mi
| Address | Dist | Beds/Ba | Sqft | Sold | Price | $/sf | Match |
|---|---|---|---|---|---|---|---|
| 10839 Monterey | 0.16mi | 3/2.5 | 1,428 (+1%) | 1mo | $215,000 | $151 | 90 |
| 10415 Mcclintock | 0.53mi | 3/2.0 | 1,450 (+2%) | 0mo | $184,900 | $128 | 69 |
| 10954 Delight Grv | 0.18mi | 3/2.0 | 1,220 (-14%) | 0mo | $164,000 | $134 | 66 |
| 11130 Schmidt Ln | 0.28mi | 3/2.0 | 1,570 (+11%) | 2mo | $274,990 | $175 | 65 |
| 11210 Prairie Lndg | 0.41mi | 3/2.0 | 1,527 (+8%) | 2mo | $219,990 | $144 | 64 |
| 3210 Gilbert Gdn | 0.35mi | 3/2.0 | 1,260 (-11%) | 1mo | $206,999 | $164 | 63 |
| 11010 Tea Cv | 0.62mi | 3/2.0 | 1,474 (+4%) | 2mo | $217,999 | $148 | 61 |
| 3654 Georgia Trce | 0.66mi | 3/2.0 | 1,474 (+4%) | 1mo | $215,999 | $147 | 59 |
| 11011 Tea Cv | 0.68mi | 3/2.0 | 1,474 (+4%) | 2mo | $218,999 | $149 | 58 |
| 11019 Tea Cv | 0.65mi | 3/2.0 | 1,260 (-11%) | 2mo | $207,999 | $165 | 48 |
| 3662 Georgia Trce | 0.68mi | 3/2.0 | 1,260 (-11%) | 1mo | $203,999 | $162 | 47 |
| 10742 Fairchild Way | 0.53mi | 4/2.0 (+1) | 1,585 (+12%) | 2mo | $278,900 | $176 | 46 |
Match score weights: distance 35% · size 25% · config 20% · recency 20%. Top-matched comps best support the ARV.
Projected returns pro-forma
-3.0% appreciation · 0.0% rent growth · sell at horizon
- IRR
- -16.9%
- Equity multiple
- 0.42×
- Total profit
- $-23,759
- Equity at exit
- $21,896
- IRR
- -17.9%
- Equity multiple
- 0.19×
- Total profit
- $-33,229
- Equity at exit
- $12,697
Cash invested: $41,118 (down + closing). Projections, not guarantees.
Landlord ↔ Tenant lean methodology
- Overall (STATE)
- 87 Strongly Landlord-Friendly
- State Texas
- 87 Strongly Landlord-Friendly · R+5
- County
- — inherits STATE
- City
- — inherits STATE
ZIP-level market 78109
- Home prices YoY
- -17.8%
- Rents YoY
- -1.1%
- Active inventory
- 1152
- Price-to-rent
- 7.0×
Monthly cashflow live
- Estimated rent
- $1,740 high interval (Pro) →
- Mortgage (P&I)
- −$770
- Tax from tax record
- −$445 /mo · $5,340/yr
- Insurance
- −$61
- HOA
- −$21
- Vacancy / Maint / Mgmt
- −$365
- Net cashflow
- $78
Break-even live
UW: 25.0% down · 7.5% · 30yr · 1.5% tax · 5.0% vac · 8.0% maint · 8.0% mgmt
Financing live
Cash to close
- Down payment
- $36,713
- Closing costs
- $4,406
- Reserves months
- —
- Total cash needed
- —
Loan-product check · same deal, 3 products live
Conventional
25% down · 7.5% · 30yr
- Down + closing
- —
- Monthly P&I
- —
- Monthly cashflow
- —
- DSCR
- —
- Eligible?
- —
Personal DTI + credit; lowest rate.
DSCR
20% down · 8.5% · 30yr
- Down + closing
- —
- Monthly P&I
- —
- Monthly cashflow
- —
- DSCR
- —
- Eligible?
- —
No personal income docs; deal must DSCR.
Hard money
10% down · 12.0% · 12mo
- Down + closing
- —
- Monthly P&I
- —
- Monthly cashflow
- —
- DSCR
- —
- Eligible?
- —
Short-term bridge; refi at stabilization.
Rent comps 40 comps
| Address | Beds | Baths | Sqft | Rent | $/sqft | DOM | Units | Dist |
|---|---|---|---|---|---|---|---|---|
| 2939 Gastonian Ml Converse, TX | 3.0 | 2.0 | 1525 | $1,495 | $0.98 | 43d | 1 | 0.05mi |
| 10922 Chatham Ct Converse, TX | 3.0 | 2.0 | 1525 | $1,645 | $1.08 | 23d | 1 | 0.11mi |
| 11046 Eyelet Hbr Converse, TX | 3.0 | 2.0 | 1525 | $1,750 | $1.15 | 23d | 1 | 0.14mi |
| 11019 Chatham Ct Converse, TX | 3.0 | 2.5 | 1428 | $1,425 | $1.00 | 43d | 1 | 0.16mi |
| 3106 Drayton Ests Converse, TX | 2.0–5.0 | 2.0–3.5 | 1733 | $2,102 | $1.21 | 1d | 1 | 0.20mi |
| 2822 Praline Fry Converse, TX | 3.0 | 2.0 | 1525 | $1,645 | $1.08 | 2d | 1 | 0.20mi |
| 11026 Yonder Flts Converse, TX | 3.0 | 2.0 | 1525 | $1,645 | $1.08 | 2d | 1 | 0.23mi |
| 11030 Yonder Flts Converse, TX | 3.0 | 2.5 | 1428 | $1,500 | $1.05 | 4d | 1 | 0.23mi |
| 3055 Jackson Smt Converse, TX | 3.0 | 2.0 | 1525 | $1,595 | $1.05 | 43d | 1 | 0.26mi |
| 3318 Carducci Dr Converse, TX | 3.0 | 2.0 | 1276 | $1,800 | $1.41 | 43d | 1 | 0.28mi |
| 3130 Jackson Smt Converse, TX | 3.0 | 2.5 | 1428 | $1,885 | $1.32 | 4d | 1 | 0.29mi |
| 10803 Prusiner Dr Converse, TX | 3.0 | 2.0 | 1450 | $1,410 | $0.97 | 23d | 1 | 0.30mi |
| 10803 Prusiner Dr Converse, TX | 3.0 | 2.0 | 1440 | $1,476 | $1.02 | 21d | 1 | 0.30mi |
| 2815 Armaan WAY Converse, TX | 3.0 | 2.5 | 1401 | $1,495 | $1.07 | 1d | 1 | 0.31mi |
| 10690 Pablo Way Converse, TX | 3.0 | 2.0 | 1207 | $1,650 | $1.37 | 43d | 1 | 0.36mi |
| 11130 Hollinger Cir Converse, TX | 3.0 | 2.5 | 1709 | $1,950 | $1.14 | 21d | 1 | 0.37mi |
| 11130 Hollinger Cir Converse, TX | 3.0 | 2.5 | 1689 | $1,950 | $1.15 | 1d | 1 | 0.37mi |
| 10755 Prusiner Dr Converse, TX | 3.0 | 2.0 | 1266 | $1,536 | $1.21 | 21d | 1 | 0.39mi |
| 10754 Prusiner Dr Converse, TX | 3.0 | 2.0 | 1266 | $1,450 | $1.15 | 23d | 1 | 0.40mi |
| 11151 Hollinger Cir Converse, TX | 4.0 | 2.5 | 1859 | $1,705 | $0.92 | 23d | 1 | 0.43mi |
| 2906 Millikan Dr Converse, TX | 4.0 | 2.0 | 1627 | $1,525 | $0.94 | 12d | 1 | 0.47mi |
| 10714 Giacconi Dr Converse, TX | 4.0 | 2.0 | 1627 | $1,550 | $0.95 | 14d | 1 | 0.49mi |
| 2802 Stigler Dr Converse, TX | 4.0 | 2.0 | 1627 | $1,495 | $0.92 | 4d | 1 | 0.49mi |
| 10707 Giacconi Dr Converse, TX | 3.0 | 2.0 | 1266 | $1,686 | $1.33 | 43d | 1 | 0.49mi |
| 10723 Vinateros Dr Converse, TX | 4.0 | 2.0 | 1667 | $1,776 | $1.07 | 43d | 1 | 0.50mi |
| 2822 Millikan Dr Converse, TX | 3.0 | 2.0 | 1450 | $1,500 | $1.03 | 12d | 1 | 0.50mi |
| 2822 Millikan Dr Converse, TX | 3.0 | 2.0 | 1440 | $1,650 | $1.15 | 23d | 1 | 0.50mi |
| 10606 Pablo Way Converse, TX | 4.0 | 2.0 | 1667 | $1,736 | $1.04 | 4d | 1 | 0.53mi |
| 10627 Erinita Way Converse, TX | 3.0 | 2.0 | 1474 | $1,466 | $0.99 | 23d | 1 | 0.54mi |
| 2819 Gustavo Dr Converse, TX | 3.0 | 2.0 | 1450 | $1,500 | $1.03 | 43d | 1 | 0.56mi |
| 4150 Admirals Bnd Converse, TX | 4.0 | 2.0 | 1602 | $1,750 | $1.09 | 4d | 1 | 0.56mi |
| 2811 Gustavo Dr Converse, TX | 3.0 | 2.0 | 1450 | $1,750 | $1.21 | 43d | 1 | 0.57mi |
| 2815 Charpak Dr Converse, TX | 4.0 | 2.0 | 1627 | $1,695 | $1.04 | 3d | 1 | 0.61mi |
| 4250 Admirals Bnd Converse, TX | 4.0 | 2.0 | 1602 | $1,699 | $1.06 | 23d | 1 | 0.69mi |
| 4398 W Vasquez Cir Unit 710 Converse, TX | 2.0 | 2.0 | 1060 | $1,388 | $1.31 | 2d | 1 | 0.74mi |
| 10818 Fox Trot Converse, TX | 3.0 | 2.0 | 1465 | $1,850 | $1.26 | 4d | 1 | 0.76mi |
| 10827 Fox Trot Converse, TX | 3.0 | 2.0 | 1650 | $1,645 | $1.00 | 19d | 1 | 0.78mi |
| 10906 Airmen Dr Converse, TX | 3.0 | 2.0 | 1535 | $1,550 | $1.01 | 2d | 1 | 0.80mi |
| 4351 W Vasquez Cir Converse, TX | 3.0 | 2.0 | 1652 | $1,850 | $1.12 | 19d | 1 | 0.84mi |
| 2187 Schuwirth Rd Converse, TX | 1.0–4.0 | 1.0–2.0 | 962 | $1,667 | $1.73 | 1d | 1 | 0.97mi |
HOA detail
- Monthly dues
- $21 · $252/yr
Listing history 26 events
-
2026-05-18status Pending 231-char remark
Show marketing remark (231 chars)
This fantastic home offers an open floor plan. A spacious fenced in backyard. Kitchen with breakfast bar and granite counter tops plus plenty of cabinet space. Spacious bedrooms finish this house off. Great possibilities await.
-
2026-05-13price $146,851 231-char remark
Show marketing remark (231 chars)
This fantastic home offers an open floor plan. A spacious fenced in backyard. Kitchen with breakfast bar and granite counter tops plus plenty of cabinet space. Spacious bedrooms finish this house off. Great possibilities await.
-
2026-04-13price $155,489 231-char remark
Show marketing remark (231 chars)
This fantastic home offers an open floor plan. A spacious fenced in backyard. Kitchen with breakfast bar and granite counter tops plus plenty of cabinet space. Spacious bedrooms finish this house off. Great possibilities await.
-
2026-03-12price $164,128 231-char remark
Show marketing remark (231 chars)
This fantastic home offers an open floor plan. A spacious fenced in backyard. Kitchen with breakfast bar and granite counter tops plus plenty of cabinet space. Spacious bedrooms finish this house off. Great possibilities await.
-
2026-02-07$172,766 New 231-char remark
Show marketing remark (231 chars)
This fantastic home offers an open floor plan. A spacious fenced in backyard. Kitchen with breakfast bar and granite counter tops plus plenty of cabinet space. Spacious bedrooms finish this house off. Great possibilities await.
-
2022-09-19soldstatus
-
2022-09-16soldstatus Sold 413-char remark
Show marketing remark (413 chars)
Exceptional home offers innate charm and great style. Designed for comfortable living in mind this home features an open floor plan with gracious entry, high ceilings, spacious living areas, and fabulous kitchen with breakfast bar, granite countertops and energy efficient appliances. Located in a great neighborhood this home offers a large fenced backyard and fantastic curb appeal. Schedule your showing today!
-
2022-08-04status Pending 413-char remark
Show marketing remark (413 chars)
Exceptional home offers innate charm and great style. Designed for comfortable living in mind this home features an open floor plan with gracious entry, high ceilings, spacious living areas, and fabulous kitchen with breakfast bar, granite countertops and energy efficient appliances. Located in a great neighborhood this home offers a large fenced backyard and fantastic curb appeal. Schedule your showing today!
-
2022-08-04status Pending
Show marketing remark (413 chars)
Exceptional home offers innate charm and great style. Designed for comfortable living in mind this home features an open floor plan with gracious entry, high ceilings, spacious living areas, and fabulous kitchen with breakfast bar, granite countertops and energy efficient appliances. Located in a great neighborhood this home offers a large fenced backyard and fantastic curb appeal. Schedule your showing today!
-
2022-07-29$249,900 New 413-char remark
Show marketing remark (413 chars)
Exceptional home offers innate charm and great style. Designed for comfortable living in mind this home features an open floor plan with gracious entry, high ceilings, spacious living areas, and fabulous kitchen with breakfast bar, granite countertops and energy efficient appliances. Located in a great neighborhood this home offers a large fenced backyard and fantastic curb appeal. Schedule your showing today!
-
2022-07-29Active
Show marketing remark (413 chars)
Exceptional home offers innate charm and great style. Designed for comfortable living in mind this home features an open floor plan with gracious entry, high ceilings, spacious living areas, and fabulous kitchen with breakfast bar, granite countertops and energy efficient appliances. Located in a great neighborhood this home offers a large fenced backyard and fantastic curb appeal. Schedule your showing today!
-
2022-07-28historical
-
2022-07-19price $259,900
-
2022-07-18price
-
2022-07-08price $279,000
-
2022-07-07price
-
2022-06-22$284,900 New
-
2022-06-22Active
-
2021-03-08soldstatus Sold
-
2021-02-01historical
-
2021-01-27price $213,900
-
2021-01-26status Back on Market
-
2021-01-24historical
-
2021-01-22$208,900
-
2021-01-02historical
-
2021-01-01$209,900
ⓘ Source: listings_history table (triggers on properties + properties_extension) + one-shot
backfill from property_details.listing_events for pre-trigger history.
Tax reassessment forecast TX · Resets to sale price
- Current annual tax
- $5,340 · $445/mo
- Projected year-2 tax
- $5,340 · $445/mo
- Expected delta
- $0/yr ($0/mo · 0.0%)
ⓘ Screening estimate from a state-policy table — verify with the county assessor before closing.
Climate risk First Street
- Flood 1/10 Low FEMA zone X (unshaded) · 0% chance over 30 yrs
- Wildfire 3/10 Moderate
- Heat 8/10 Severe 7 d/yr ≥108°F today · 22 d/yr by 30 yrs out
- Wind 8/10 Severe 80% chance of damaging wind over 30 yrs
- Air quality 1/10 Low 0 unhealthy d/yr today · 0 by 30 yrs out
Nearby sold comps map
Loading sold comps map…
Walkable amenities ~0.75 mi
Loading nearby amenities…
Taxation est. · year 1
- Rental income
- $20,883
- − Mortgage interest
- −$8,226
- − Property taxes
- −$5,340
- − Insurance
- −$734
- − Repairs & maintenance
- −$1,671
- − Management
- −$1,671
- − HOA
- −$252
- − Depreciation
- −$4,272
- Taxable loss
- −$1,282
- Est. tax savings @ 24.0%
- +$308
- After-tax cash flow
- $1,238/yr
For passive investors: Depreciation is non-cash, so a rental often shows a tax loss while cash-flowing — sheltering income. Rental losses are passive: they offset passive income freely, and up to $25,000/yr can offset ordinary (W-2) income if you actively participate and your MAGI is under $100k (phasing out to $0 by $150k); unused losses carry forward. On sale, claimed depreciation is recaptured at up to 25%, and gains may owe capital-gains tax (a 1031 exchange can defer both). Figures are a year-1 estimate at your 24.0% rate — not tax advice; consult a CPA.
Condition & rehab AI · 12 photos
The home is in fair condition with some minor repairs and maintenance needed. It has a good foundation and roof, but the interior walls and landscaping could use some attention. Updates to the paint, landscaping, and ceiling fans would significantly increase its value.
Repairs flagged
- Minor Paint — Some minor scuff marks on walls
- Minor Landscaping — Overgrown grass in backyard
Value-add opportunities
- Both Paint interior walls — Fresh paint can improve the home's appearance and value
- Both Landscaping — A well-maintained yard can enhance curb appeal and attract potential buyers
- Both Replace ceiling fans — Modern ceiling fans can improve air circulation and add to the home's appeal
Renovation cost estimate screening
| Repair item | Severity | Est. cost |
|---|---|---|
| Paint · Some minor scuff marks on walls | Minor | $500–3,000 |
| Landscaping · Overgrown grass in backyard | Minor | $500–3,000 |
| Total estimated repair cost · 2 items | $1,000–6,000 |
Value-add ROI direction
- Both Paint interior walls — Fresh paint can improve the home's appearance and value ↑
- Both Landscaping — A well-maintained yard can enhance curb appeal and attract potential buyers ↑
- Both Replace ceiling fans — Modern ceiling fans can improve air circulation and add to the home's appeal ↑
ⓘ Cost ranges are severity-bucket heuristics (US national rule-of-thumb). Get contractor quotes + a written scope before underwriting a rehab budget.
Schools (NCES district)
- District
- East Central ISD
- NCES district ID
- 4817850
- Math proficiency
- 16% ▼ -12.00%
- Reading proficiency
- 25% ▼ -6.00%
- Median HH income
- $53,941
- Composite
- 18.67/100
- National rank
- #8887
- State rank
- #758 of 826 in TX
Livability — San Antonio
- Score
- 80/100
- State rank
- #31
- US rank
- #1616
Category grades
Schools grade is shown separately in the Schools card above.
Census & demographics
- Census place
- San Antonio, TX
- County
- Bexar County · 1,990,555 people
- City population
- 1,806,925
- Metro
- San Antonio-New Braunfels, TX
- Population (ZIP)
- 63,067
- Household income
- $91,320
- Rent vs Own
- Severe rent burden
- 1732.0
Population outlook (Bexar County) Hauer SSP2
- Today (2025)
- 2,336,851 people
- By 2030
- 2,560,728 · +9.6%
- By 2040
- 3,020,569 · +29.3%
- By 2050
- 3,493,522 · +49.5%
- By 2075
- 4,668,459 · +99.8%
- By 2100
- 5,533,242 · +136.8%
Race, ethnicity, and origin ACS 2023
- Neighborhood character
- Diverse neighborhood (Simpson 0.69)
- Race & ethnicity
- Hispanic / Latino 44% White 27% Two or more races 21% Black 21% Asian 3%
- Hispanic origin (detail)
- Mexican 29% Puerto Rican 4%
- Common ancestry
- Lithuanian 1% Romanian 1% Italian 1%
- Foreign-born
- 11% · Canada, Vietnam, South Korea
- Languages at home
- 71% English-only · Spanish 23% Tagalog/Filipino 1% Other Asian/Pacific 1%
Political lean MEDSL · Bexar
- 2024 margin
- Lean D (+9.8) · D 54.3% · R 44.6% · Other 1.1%
- 2008→2024 swing
- +4.2pp toward D · 2008: 5.6pp · 2024: 9.8pp
- All cycles
- 2024: D+9.8 2020: D+18.2 2016: D+13.5 2012: D+4.6 2008: D+5.6
Not yet ingested
- Civics
- —
Market trends
- HPI YoY
- ▼ -51.02%
- Current HPI
- 236.4923
- Rent YoY
- ▼ -1.08%
- Metro
- San Antonio-New Braunfels, TX
- State GDP YoY
- ▲ 3.95%
- F500 in state
- 110
Industry mix (Fortune 500 HQ in TX)
| Industry | F500 HQs | Revenue |
|---|---|---|
| Energy | 16 | $1,198B |
|
||
| Technology | 5 | $198B |
|
||
| Engineering / Construction | 4 | $72B |
|
||
| Energy Services | 3 | $60B |
|
||
| Utilities | 3 | $41B |
|
||
| Healthcare | 2 | $330B |
|
||
Price history
-30.0% since first listed26 events — show timeline
- 2026-05-18 Pending — LERA
- 2026-05-13 Price Changed $146,851 LERA
- 2026-04-13 Price Changed $155,489 LERA
- 2026-03-12 Price Changed $164,128 LERA
- 2026-02-07 Listed $172,766 LERA
- 2022-09-19 Sold (Public Records) — Public Records
- 2022-09-16 Sold (MLS) — LERA
- 2022-08-04 Pending — LERA
- 2022-08-04 Pending — Unlock MLS
- 2022-07-29 Listed $249,900 LERA
- 2022-07-29 Listed — Unlock MLS
- 2022-07-28 Listing Removed — LERA
- 2022-07-19 Price Changed $259,900 LERA
- 2022-07-18 Price Changed — Unlock MLS
- 2022-07-08 Price Changed $279,000 LERA
- 2022-07-07 Price Changed — Unlock MLS
- 2022-06-22 Listed $284,900 LERA
- 2022-06-22 Listed — Unlock MLS
- 2021-03-08 Sold (MLS) — LERA
- 2021-02-01 Listing Removed — LERA
- 2021-01-27 Price Changed $213,900 LERA
- 2021-01-26 Relisted — LERA
- 2021-01-24 Listing Removed — LERA
- 2021-01-22 Listed $208,900 LERA
- 2021-01-02 Listing Removed — LERA
- 2021-01-01 Listed $209,900 LERA
Property tax history
+7.7%/yrLatest (2025): $5,340 · -3.1% YoY. Source: county tax records.
Cash-flow waterfall
monthlySold comps — $/sqft
last 12 mo · ≤1 miLoading sold comps…