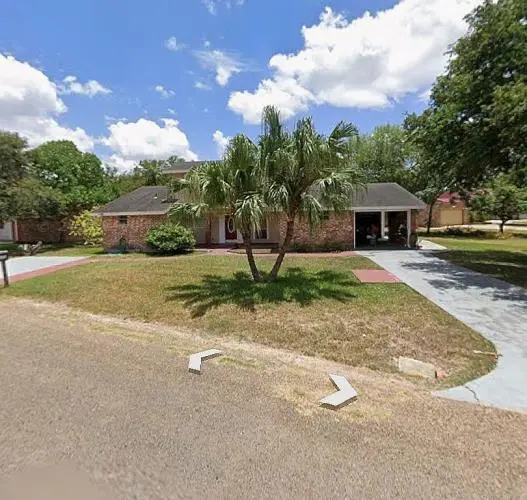
344 Balboa Rd · Rancho Viejo, TX
Flood risk 1/10 · Minimal
- FEMA flood zone
- X (unshaded)
- Chance of flooding over 30 yrs
- 0.0%
- Est. flood insurance / yr
- $507 – $1,088
Fire risk 1/10 · Minimal
- Est. fire insurance / yr
- $1,222 – $2,270
Heat risk 9/10 · Severe
- Hot days now (above 111°F)
- 4 days/yr
- Hot days in 30 yrs
- 15 days/yr
Wind risk 9/10 · Severe
- Chance of severe wind over 30 yrs
- 99.0%
Air-quality risk 2/10 · Minimal
- Unhealthy air days now
- 1 days/yr
- Unhealthy air days in 30 yrs
- 1 days/yr
Risk factors via First Street. Map © Google.
Why this score? — see what drove the D+ grade
The composite is a weighted blend of 9 inputs, each scored 0–100. Each bar is that input's sub-score; the figure is the points it added to the 100-point composite (weight × sub-score).
- ARV discount +12.5/15.0
- Cash flow +12.4/30.0
- 1% rule +4.2/10.0
- DSCR +3.7/10.0
- Livability +3.5/5.0
- Schools +3.3/10.0
- Rent growth +2.5/5.0
- Condition / age +2.5/5.0
- Appreciation +2.3/10.0
$253,500
🖨 Deal sheet 📄 Offer letter ✓ Due diligence
Listing remarks MLS
Nice 3 bed 3 bath Single Car Garage and Sun Room.
Key facts
- Built 1973
- Listed 114 days
Neighborhood map
What this means for you Summary
Snapshot
- This is a 3-bed/3.0-bath single-family listed at $254k.
Deal economics
- At list price, monthly cash flow is $-40 ($-480/yr) — negative.
- To cash-flow at today's rent, offer at most $246k (2.8% below list).
- To meet the 1% rule (rent ≥ 1% of price), the offer needs to be $233k (8.0% below list).
- Recommended offer: $231k (9.0% below list) — sets the bar for market timing.
Location & tenants
- Location reads 70/100 on livability (#341 in TX) — a middle-class / working-renter tenant base. Strengths: crime A+, cost of living A+, housing A+; Watch: schools D, amenities F, commute F.
- Los Fresnos CISD (suburban): math 34% / reading 44% proficiency, ranked #444 of 826 in TX (top 54%) — families likely to look elsewhere, expect single-tenant / working-renter base with shorter leases.
- Market conditions: 75 active listings in the ZIP; 5 comparable units currently listed for rent nearby; rentals lingering (median 44d on market — plan ~5-8 weeks vacancy on turnover, expect pricing pressure); 60% of comp listings sitting > 30 days — soft ceiling on asking rent; 2,326 units permitted in Cameron County in 2024 (503 in 5+ unit buildings).
Forward outlook
- Local home prices are declining (-3.0%/yr); year-one equity from $2k of loan paydown is wiped out by about $8k of value loss. Plan a longer hold.
- Cameron County population projected at +3% by 2050 — modest demand growth; plan on rents tracking national, not racing it.
Negotiation context
- It's been on market 114 days — a 9% lower offer ($231k) is reasonable based on typical stale-listing flexibility.
- 3 sale attempts since 2y ago with the ask held roughly flat each time — persistent listings suggest the price (not the market) is what's stuck; bring a comps-based counter.
Risks & watch-outs
- Climate carrying-cost: severe wind risk, 99% chance of damaging wind over 30y; extreme-heat days projected 4→15/yr by 2055 (HVAC capex compounding) — expect insurance premiums to compound above CPI over the hold.
Questions for the listing agent
- What do current leases actually rent for vs. the listed asking? Can we see a recent rent roll and the last 12 months of T-12 income?
- It's been on market 114 days. Have you received any prior offers? Is the seller open to a 9% concession, seller financing, or rate buy-down credit?
- Built in 1973 — when were the roof, HVAC, electrical panel, plumbing, and water heater last replaced?
- Why hasn't it sold? Are there any deal-killer items the seller is aware of (foundation, flood, title, zoning, code violations)?
- Is there a deadline driving the sale (1031 exchange, divorce, estate, relocation)? That informs how much negotiation room exists.
- Schools are D-rated, which usually means shorter tenancies and higher turnover. Who's the typical renter profile here, and what's been the actual vacancy rate?
- The area grade is low — what's the realistic commute time and amenity access for the typical tenant pool here? Any planned neighborhood developments (good or bad) we should know about?
- What's the average days-on-market for RENTAL listings here right now (not sales)? A rising rental-DOM trend means longer vacancies and softer asking-rent achievability than the comps imply.
- What's the recent tenant-quality profile in this submarket — average credit score on applications, eviction rate, late-payment / NSF rate, and stable-employment percentage? A property-management company in the area should have these aggregated.
- How much new for-sale + rental construction is in the pipeline within 1–3 miles? Heavy new supply typically softens prices + rents 12–24 months out; constrained supply supports both.
Investment metrics
- 1% rule
- 0.92% ✗
- Cap rate
- 6.10%
- Cash-on-cash
- -0.68%
- DSCR
- 0.97
- GRM
- 9.1
CMA / ARV
- ARV (median comp)
- $285,000
- List price
- $253,500
- Delta
- -11.05%
- Verdict
- UNDERPRICED
- Comps
- 7 within 1.0 mi
Show comp detail 1 sale within ~0.75 mi
| Address | Dist | Beds/Ba | Sqft | Sold | Price | $/sf | Match |
|---|---|---|---|---|---|---|---|
| 340 Nicholas St | 0.56mi | 4/3.0 (+1) | 2,792 (+6%) | 4mo | $475,000 | $170 | 55 |
Match score weights: distance 35% · size 25% · config 20% · recency 20%. Top-matched comps best support the ARV.
Projected returns pro-forma
-3.0% appreciation · 3.0% rent growth · sell at horizon
- IRR
- -17.4%
- Equity multiple
- 0.39×
- Total profit
- $-43,510
- Equity at exit
- $37,798
- IRR
- -9.3%
- Equity multiple
- 0.43×
- Total profit
- $-40,702
- Equity at exit
- $21,918
Cash invested: $70,980 (down + closing). Projections, not guarantees.
Landlord ↔ Tenant lean methodology
- Overall (STATE)
- 87 Strongly Landlord-Friendly
- State Texas
- 87 Strongly Landlord-Friendly · R+5
- County
- — inherits STATE
- City
- — inherits STATE
ZIP-level market 78575
- Home prices YoY
- -2.2%
- Active inventory
- 75
- Price-to-rent
- 9.1×
Monthly cashflow live
- Estimated rent
- $2,331 high interval (Pro) →
- Mortgage (P&I)
- −$1,329
- Tax from tax record
- −$447 /mo · $5,359/yr
- Insurance
- −$106
- HOA
- −$0
- Vacancy / Maint / Mgmt
- −$490
- Net cashflow
- $-40
Break-even live
UW: 25.0% down · 7.5% · 30yr · 1.5% tax · 5.0% vac · 8.0% maint · 8.0% mgmt
Financing live
Cash to close
- Down payment
- $63,375
- Closing costs
- $7,605
- Reserves months
- —
- Total cash needed
- —
Loan-product check · same deal, 3 products live
Conventional
25% down · 7.5% · 30yr
- Down + closing
- —
- Monthly P&I
- —
- Monthly cashflow
- —
- DSCR
- —
- Eligible?
- —
Personal DTI + credit; lowest rate.
DSCR
20% down · 8.5% · 30yr
- Down + closing
- —
- Monthly P&I
- —
- Monthly cashflow
- —
- DSCR
- —
- Eligible?
- —
No personal income docs; deal must DSCR.
Hard money
10% down · 12.0% · 12mo
- Down + closing
- —
- Monthly P&I
- —
- Monthly cashflow
- —
- DSCR
- —
- Eligible?
- —
Short-term bridge; refi at stabilization.
Rent comps 5 comps
| Address | Beds | Baths | Sqft | Rent | $/sqft | DOM | Units | Dist |
|---|---|---|---|---|---|---|---|---|
| 215 Zapata Ave Rancho Viejo, TX | 3.0 | 3.0 | 1953 | $2,300 | $1.18 | 14d | 1 | 0.27mi |
| 3803 Carmen Ave Olmito, TX | 4.0 | 3.0 | 2075 | $2,100 | $1.01 | 44d | 1 | 0.56mi |
| 811 De Leon Ave Rancho Viejo, TX | 3.0 | 3.0 | 2050 | $2,100 | $1.02 | 44d | 1 | 0.68mi |
| 4601 Carmen Ave Unit 1704 Rancho Viejo, TX | 3.0 | 2.5 | 1944 | $2,700 | $1.39 | 14d | 1 | 0.72mi |
| 9448 W Queen Palm Los Fresnos, TX | 4.0 | 3.0 | 2250 | $2,800 | $1.24 | 44d | 1 | 1.37mi |
Listing history 25 events
-
2026-06-18days on market $253,500 Active 114 DOM
-
2026-06-17days on market $253,500 Active 113 DOM
-
2026-06-16days on market $253,500 Active 112 DOM
-
2026-06-15days on market $253,500 Active 111 DOM
-
2026-06-14days on market $253,500 Active 109 DOM
-
2026-06-13days on market $253,500 Active 108 DOM
-
2026-06-10days on market $253,500 Active 106 DOM
-
2026-06-09days on market $253,500 Active 105 DOM
-
2026-06-08days on market $253,500 Active 104 DOM
-
2026-06-07days on market $253,500 Active 103 DOM
-
2026-06-05days on market $253,500 Active 100 DOM
-
2026-06-03days on market $253,500 Active 99 DOM
-
2026-06-02days on market $253,500 Active 98 DOM
-
2026-06-01days on market $253,500 Active 97 DOM
-
2026-05-31days on market $253,500 Active 96 DOM
-
2026-05-30days on market $253,500 Active 95 DOM
-
2026-02-20$253,500 Active 49-char remark
Show marketing remark (49 chars)
Nice 3 bed 3 bath Single Car Garage and Sun Room.
-
2025-01-22soldstatus
-
2025-01-21soldstatus Closed 590-char remark
Show marketing remark (590 chars)
Welcome to your dream retreat nestled within the serene landscape of our prestigious Rancho Viejo community. This stunning two-story villa combines elegance and comfort, offering the perfect escape for golf enthusiasts and nature lovers alike. With stunning views of the Resaca this Villa offer three spacious bedrooms, two living areas, gorgeous sun room, brand new roof, new ac unit and it is freshly painted and ready to move in. Situated in a tranquil setting, this villa offers proximity to fine dining, and shopping options. Experience the perfect blend of relaxation and recreation.
-
2024-12-23status Pending 590-char remark
Show marketing remark (590 chars)
Welcome to your dream retreat nestled within the serene landscape of our prestigious Rancho Viejo community. This stunning two-story villa combines elegance and comfort, offering the perfect escape for golf enthusiasts and nature lovers alike. With stunning views of the Resaca this Villa offer three spacious bedrooms, two living areas, gorgeous sun room, brand new roof, new ac unit and it is freshly painted and ready to move in. Situated in a tranquil setting, this villa offers proximity to fine dining, and shopping options. Experience the perfect blend of relaxation and recreation.
-
2024-11-08status Active 590-char remark
Show marketing remark (590 chars)
Welcome to your dream retreat nestled within the serene landscape of our prestigious Rancho Viejo community. This stunning two-story villa combines elegance and comfort, offering the perfect escape for golf enthusiasts and nature lovers alike. With stunning views of the Resaca this Villa offer three spacious bedrooms, two living areas, gorgeous sun room, brand new roof, new ac unit and it is freshly painted and ready to move in. Situated in a tranquil setting, this villa offers proximity to fine dining, and shopping options. Experience the perfect blend of relaxation and recreation.
-
2024-09-30$249,000 Active 590-char remark
Show marketing remark (590 chars)
Welcome to your dream retreat nestled within the serene landscape of our prestigious Rancho Viejo community. This stunning two-story villa combines elegance and comfort, offering the perfect escape for golf enthusiasts and nature lovers alike. With stunning views of the Resaca this Villa offer three spacious bedrooms, two living areas, gorgeous sun room, brand new roof, new ac unit and it is freshly painted and ready to move in. Situated in a tranquil setting, this villa offers proximity to fine dining, and shopping options. Experience the perfect blend of relaxation and recreation.
-
2024-06-05price $239,900
-
2024-03-29price $260,000
-
1993-02-01soldstatus
ⓘ Source: listings_history table (triggers on properties + properties_extension) + one-shot
backfill from property_details.listing_events for pre-trigger history.
Tax reassessment forecast TX · Resets to sale price
- Current annual tax
- $5,359 · $447/mo
- Projected year-2 tax
- $5,359 · $447/mo
- Expected delta
- $0/yr ($0/mo · 0.0%)
ⓘ Screening estimate from a state-policy table — verify with the county assessor before closing.
Climate risk First Street
- Flood 1/10 Low FEMA zone X (unshaded) · 0% chance over 30 yrs
- Wildfire 1/10 Low
- Heat 9/10 Extreme 4 d/yr ≥111°F today · 15 d/yr by 30 yrs out
- Wind 9/10 Extreme 99% chance of damaging wind over 30 yrs
- Air quality 2/10 Low 1 unhealthy d/yr today · 1 by 30 yrs out
Nearby sold comps map
Loading sold comps map…
Walkable amenities ~0.75 mi
Loading nearby amenities…
Taxation est. · year 1
- Rental income
- $27,973
- − Mortgage interest
- −$14,200
- − Property taxes
- −$5,359
- − Insurance
- −$1,268
- − Repairs & maintenance
- −$2,238
- − Management
- −$2,238
- − Depreciation
- −$7,375
- Taxable loss
- −$4,703
- Est. tax savings @ 24.0%
- +$1,129
- After-tax cash flow
- $649/yr
For passive investors: Depreciation is non-cash, so a rental often shows a tax loss while cash-flowing — sheltering income. Rental losses are passive: they offset passive income freely, and up to $25,000/yr can offset ordinary (W-2) income if you actively participate and your MAGI is under $100k (phasing out to $0 by $150k); unused losses carry forward. On sale, claimed depreciation is recaptured at up to 25%, and gains may owe capital-gains tax (a 1031 exchange can defer both). Figures are a year-1 estimate at your 24.0% rate — not tax advice; consult a CPA.
Schools (NCES district)
- District
- Los Fresnos CISD
- NCES district ID
- 4828290
- Math proficiency
- 34% ▼ -30.00%
- Reading proficiency
- 44% ▼ -10.00%
- Median HH income
- $42,586
- Composite
- 32.92/100
- National rank
- #5601
- State rank
- #444 of 826 in TX
Livability — Rancho Viejo
- Score
- 70/100
- State rank
- #341
- US rank
- #7444
Category grades
Schools grade is shown separately in the Schools card above.
Census & demographics
- Census place
- Rancho Viejo, TX
- City population
- 4,728
- Population (ZIP)
- 4,728
Population outlook (Cameron County) Hauer SSP2
- Today (2025)
- 441,603 people
- By 2030
- 448,113 · +1.5%
- By 2040
- 456,385 · +3.3%
- By 2050
- 456,294 · +3.3%
- By 2075
- 423,851 · -4.0%
- By 2100
- 342,787 · -22.4%
Race, ethnicity, and origin ACS 2023
- Neighborhood character
- Predominantly Hispanic (78%)
- Race & ethnicity
- Hispanic / Latino 78% Two or more races 36% White 19% Asian 3%
- Hispanic origin (detail)
- Mexican 75%
- Common ancestry
- Lithuanian 2% Slovak 1% Italian 1%
- Foreign-born
- 28% · Canada, China, Dominican Republic
- Languages at home
- 27% English-only · Spanish 70% Chinese 1% Other Indo-European 1%
Political lean MEDSL · Cameron
- 2024 margin
- Lean R (+5.8) · D 46.7% · R 52.5%
- 2008→2024 swing
- -34.6pp toward R · 2008: 28.8pp · 2024: -5.8pp
- All cycles
- 2024: R+5.8 2020: D+13.2 2016: D+32.5 2012: D+32.4 2008: D+28.8
Not yet ingested
- Civics
- —
Market trends
- HPI YoY
- ▼ -5.34%
- Current HPI
- 240.4582
- Rent YoY
- —
- Metro
- —
- State GDP YoY
- ▲ 3.95%
- F500 in state
- 110
Industry mix (Fortune 500 HQ in TX)
| Industry | F500 HQs | Revenue |
|---|---|---|
| Energy | 16 | $1,198B |
|
||
| Technology | 5 | $198B |
|
||
| Engineering / Construction | 4 | $72B |
|
||
| Energy Services | 3 | $60B |
|
||
| Utilities | 3 | $41B |
|
||
| Healthcare | 2 | $330B |
|
||
Price history
-2.5% since first listed9 events — show timeline
- 2026-02-20 Listed $253,500 Fizber.com
- 2025-01-22 Sold (Public Records) — Public Records
- 2025-01-21 Sold (MLS) — RGVMLS
- 2024-12-23 Pending — RGVMLS
- 2024-11-08 Relisted — RGVMLS
- 2024-09-30 Listed $249,000 RGVMLS
- 2024-06-05 Price Changed $239,900 RGVMLS
- 2024-03-29 Price Changed $260,000 RGVMLS
- 1993-02-01 Sold (Public Records) — Public Records
Property tax history
+5.4%/yrLatest (2025): $5,359 · +3.5% YoY. Source: county tax records.
Cash-flow waterfall
monthlySold comps — $/sqft
last 12 mo · ≤1 miLoading sold comps…