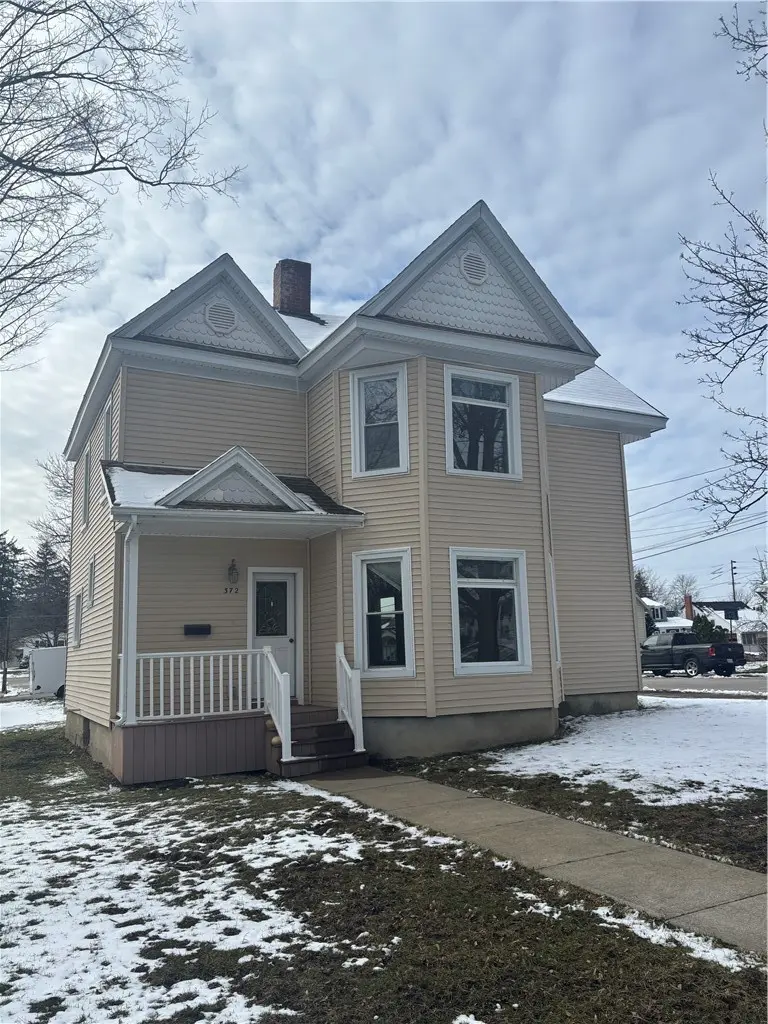
372 Seneca Rd. Rd · North Hornell, NY
Flood risk 1/10 · Minimal
- FEMA flood zone
- X (shaded)
- Chance of flooding over 30 yrs
- 0.0%
- Est. flood insurance / yr
- $473 – $860
Fire risk 2/10 · Minimal
- Est. fire insurance / yr
- $691 – $1,283
Heat risk 3/10 · Minor
- Hot days now (above 92°F)
- 8 days/yr
- Hot days in 30 yrs
- 18 days/yr
Wind risk 1/10 · Minimal
- Chance of severe wind over 30 yrs
- —
Air-quality risk 1/10 · Minimal
- Unhealthy air days now
- 0 days/yr
- Unhealthy air days in 30 yrs
- 0 days/yr
Risk factors via First Street. Map © Google.
Why this score? — see what drove the C- grade
The composite is a weighted blend of 9 inputs, each scored 0–100. Each bar is that input's sub-score; the figure is the points it added to the 100-point composite (weight × sub-score).
- ARV discount +15.0/15.0
- Cash flow +11.6/30.0
- Appreciation +7.0/10.0
- 1% rule +4.4/10.0
- DSCR +3.4/10.0
- Schools +3.4/10.0
- Livability +3.4/5.0
- Rent growth +2.5/5.0
- Condition / age +2.5/5.0
$179,900
🖨 Deal sheet 📄 Offer letter ✓ Due diligence
Listing remarks MLS
Welcome to your new home in North Hornell! This house sits on a corner lot and has beautiful wood trim, stained glass, vinyl replacement windows, and front & side porches with composite decking. 3 bedrooms, one with a walk-in closet that could serve as a nursery. Open flex space upstairs for play-room or office. Powder room off the kitchen and full bath upstairs. Laundry on second floor. Large lot ready for expansion!
Key facts
- Wood trim
- Stained glass
- Front porches
Tags
Neighborhood map
What this means for you Summary
Snapshot
- This is a 3-bed/1.5-bath single-family listed at $180k.
Deal economics
- At list price, monthly cash flow is $-55 ($-663/yr) — negative.
- To cash-flow at today's rent, offer at most $170k (5.4% below list).
- To meet the 1% rule (rent ≥ 1% of price), the offer needs to be $170k (5.5% below list).
- Recommended offer: $169k (6.0% below list) — sets the bar for market timing.
Location & tenants
- Location reads 67/100 on livability (#579 in NY) — a middle-class / working-renter tenant base. Strengths: cost of living A+, health & safety A+, housing A-; Watch: schools C-, crime D-, amenities F.
- Hornell City School District (town): math 33% / reading 49% proficiency, ranked #519 of 590 in NY (top 88%) — families likely to look elsewhere, expect single-tenant / working-renter base with shorter leases.
- Market conditions: 59 active listings in the ZIP; 6 comparable units currently listed for rent nearby; rentals lingering (median 44d on market — plan ~5-8 weeks vacancy on turnover, expect pricing pressure); 100% of comp listings sitting > 30 days — soft ceiling on asking rent; 196 units permitted in Steuben County in 2024 (0 in 5+ unit buildings).
- This rent runs 35% of the median local income ($58k/yr) — at the standard rent-burdened threshold; future hikes will face affordability resistance.
Forward outlook
- In year one you build about $8k of equity ($1k loan paydown + $7k appreciation (4.0% local appreciation)).
- Steuben County population projected at -20% by 2050 — secular population decline; favor cash flow + early exit over multi-decade hold.
- At projected returns (4.0% appreciation + 3.0% rent growth), your $50k cash investment doubles in ~6 years — after that, you're playing with house money.
- By year 5, paydown + projected appreciation supports a ~$36k cash-out refi (75% LTV) — recoverable capital for the next deal without selling this one.
Negotiation context
- It's been on market 62 days — a 6% lower offer ($169k) is reasonable based on typical stale-listing flexibility.
- Current owner paid $15k; list at $180k implies a 1099% gain — meaningful room to come down on a strong offer.
Risks & watch-outs
- Watch-outs: property tax is 2.5% of price; built in 1875 — expect roof / HVAC / electrical / plumbing capex.
Questions for the listing agent
- What do current leases actually rent for vs. the listed asking? Can we see a recent rent roll and the last 12 months of T-12 income?
- It's been on market 62 days. Have you received any prior offers? Is the seller open to a 6% concession, seller financing, or rate buy-down credit?
- Built in 1875 — when were the roof, HVAC, electrical panel, plumbing, and water heater last replaced?
- Property tax is high relative to price — has the assessment been appealed recently, and will the sale trigger a re-assessment?
- Why hasn't it sold? Are there any deal-killer items the seller is aware of (foundation, flood, title, zoning, code violations)?
- Is there a deadline driving the sale (1031 exchange, divorce, estate, relocation)? That informs how much negotiation room exists.
- Crime grade is D in this area — have there been break-ins, vandalism, or insurance claims at this property in the last 3 years? What carrier currently insures it and at what premium?
- What's the average days-on-market for RENTAL listings here right now (not sales)? A rising rental-DOM trend means longer vacancies and softer asking-rent achievability than the comps imply.
- What's the recent tenant-quality profile in this submarket — average credit score on applications, eviction rate, late-payment / NSF rate, and stable-employment percentage? A property-management company in the area should have these aggregated.
- How much new for-sale + rental construction is in the pipeline within 1–3 miles? Heavy new supply typically softens prices + rents 12–24 months out; constrained supply supports both.
Investment metrics
- 1% rule
- 0.94% ✗
- Cap rate
- 5.92%
- Cash-on-cash
- -1.32%
- DSCR
- 0.94
- GRM
- 8.8
CMA / ARV
- ARV (median comp)
- $235,422
- List price
- $179,900
- Delta
- -23.58%
- Verdict
- UNDERPRICED
- Comps
- 20 within 1.0 mi
Show comp detail 4 sales within ~0.75 mi
| Address | Dist | Beds/Ba | Sqft | Sold | Price | $/sf | Match |
|---|---|---|---|---|---|---|---|
| 11 Elmwood Ave | 0.10mi | 4/1.5 (+1) | 1,898 (+14%) | 7mo | $152,700 | $80 | 60 |
| 409 Seneca Rd | 0.26mi | 3/2.0 | 1,896 (+14%) | 18mo | $324,900 | $171 | 47 |
| 62 Adsit St | 0.66mi | 4/2.0 (+1) | 1,476 (-11%) | 11mo | $116,000 | $79 | 35 |
| 444 Cleveland Ave | 0.40mi | 4/3.5 (+1) | 1,904 (+15%) | 12mo | $240,000 | $126 | 34 |
Match score weights: distance 35% · size 25% · config 20% · recency 20%. Top-matched comps best support the ARV.
Projected returns pro-forma
3.95% appreciation · 3.0% rent growth · sell at horizon
- IRR
- 9.0%
- Equity multiple
- 1.55×
- Total profit
- $27,460
- Equity at exit
- $90,663
- IRR
- 11.1%
- Equity multiple
- 2.83×
- Total profit
- $91,975
- Equity at exit
- $147,852
Cash invested: $50,372 (down + closing). Projections, not guarantees.
Landlord ↔ Tenant lean methodology
- Overall (STATE)
- 15 Strongly Tenant-Friendly
- State New York
- 15 Strongly Tenant-Friendly · D+10
- County
- — inherits STATE
- City
- — inherits STATE
ZIP-level market 14843
- Home prices YoY
- 1.9%
- Active inventory
- 59
- Price-to-rent
- 8.8×
Monthly cashflow live
- Estimated rent
- $1,700 high interval (Pro) →
- Mortgage (P&I)
- −$943
- Tax from tax record
- −$380 /mo · $4,559/yr
- Insurance
- −$75
- HOA
- −$0
- Vacancy / Maint / Mgmt
- −$357
- Net cashflow
- $-55
Break-even live
UW: 25.0% down · 7.5% · 30yr · 1.5% tax · 5.0% vac · 8.0% maint · 8.0% mgmt
Financing live
Cash to close
- Down payment
- $44,975
- Closing costs
- $5,397
- Reserves months
- —
- Total cash needed
- —
Loan-product check · same deal, 3 products live
Conventional
25% down · 7.5% · 30yr
- Down + closing
- —
- Monthly P&I
- —
- Monthly cashflow
- —
- DSCR
- —
- Eligible?
- —
Personal DTI + credit; lowest rate.
DSCR
20% down · 8.5% · 30yr
- Down + closing
- —
- Monthly P&I
- —
- Monthly cashflow
- —
- DSCR
- —
- Eligible?
- —
No personal income docs; deal must DSCR.
Hard money
10% down · 12.0% · 12mo
- Down + closing
- —
- Monthly P&I
- —
- Monthly cashflow
- —
- DSCR
- —
- Eligible?
- —
Short-term bridge; refi at stabilization.
Rent comps 6 comps
| Address | Beds | Baths | Sqft | Rent | $/sqft | DOM | Units | Dist |
|---|---|---|---|---|---|---|---|---|
| 21 Armory Pl Hornell, NY | 2.0 | 1.0 | 2074 | $1,200 | $0.58 | 43d | 1 | 0.82mi |
| 14 Willow Pl Hornell, NY | 4.0 | 2.0 | 1726 | $2,000 | $1.16 | 43d | 1 | 0.90mi |
| 54 Bemis Ave Hornell, NY | 2.0 | 1.0 | 1801 | $1,300 | $0.72 | 43d | 1 | 1.04mi |
| 15 Hakes Ave Unit 102 Hornell, NY | 4.0 | 2.0 | 2000 | $2,195 | $1.10 | 43d | 1 | 1.17mi |
| 7459 Seneca Rd N Hornell, NY | 4.0 | 1.5 | 1200 | $1,395 | $1.16 | 43d | 1 | 1.33mi |
| 58 Elm St Hornell, NY | 4.0 | 2.0 | 1600 | $2,495 | $1.56 | 43d | 1 | 1.40mi |
Listing history 4 events
-
2026-05-18historical Active Under Contract 427-char remark
Show marketing remark (427 chars)
Welcome to your new home in North Hornell! This house sits on a corner lot and has beautiful wood trim, stained glass, vinyl replacement windows, and front & side porches with composite decking. 3 bedrooms, one with a walk-in closet that could serve as a nursery. Open flex space upstairs for play-room or office. Powder room off the kitchen and full bath upstairs. Laundry on second floor. Large lot ready for expansion!
-
2026-04-27price $179,900 427-char remark
Show marketing remark (427 chars)
Welcome to your new home in North Hornell! This house sits on a corner lot and has beautiful wood trim, stained glass, vinyl replacement windows, and front & side porches with composite decking. 3 bedrooms, one with a walk-in closet that could serve as a nursery. Open flex space upstairs for play-room or office. Powder room off the kitchen and full bath upstairs. Laundry on second floor. Large lot ready for expansion!
-
2026-03-20$184,900 Active 427-char remark
Show marketing remark (427 chars)
Welcome to your new home in North Hornell! This house sits on a corner lot and has beautiful wood trim, stained glass, vinyl replacement windows, and front & side porches with composite decking. 3 bedrooms, one with a walk-in closet that could serve as a nursery. Open flex space upstairs for play-room or office. Powder room off the kitchen and full bath upstairs. Laundry on second floor. Large lot ready for expansion!
-
2007-11-29soldstatus $15,000
ⓘ Source: listings_history table (triggers on properties + properties_extension) + one-shot
backfill from property_details.listing_events for pre-trigger history.
Tax reassessment forecast NY · Partial reset (capped growth)
- Current annual tax
- $4,559 · $380/mo
- Projected year-2 tax
- $4,559 · $380/mo
- Expected delta
- $0/yr ($0/mo · 0.0%)
ⓘ Screening estimate from a state-policy table — verify with the county assessor before closing.
Climate risk First Street
- Flood 1/10 Low FEMA zone X (shaded) · 0% chance over 30 yrs
- Wildfire 2/10 Low
- Heat 3/10 Moderate 8 d/yr ≥92°F today · 18 d/yr by 30 yrs out
- Wind 1/10 Low
- Air quality 1/10 Low 0 unhealthy d/yr today · 0 by 30 yrs out
Nearby sold comps map
Loading sold comps map…
Walkable amenities ~0.75 mi
Loading nearby amenities…
Taxation est. · year 1
- Rental income
- $20,400
- − Mortgage interest
- −$10,077
- − Property taxes
- −$4,559
- − Insurance
- −$900
- − Repairs & maintenance
- −$1,632
- − Management
- −$1,632
- − Depreciation
- −$5,233
- Taxable loss
- −$3,633
- Est. tax savings @ 24.0%
- +$872
- After-tax cash flow
- $209/yr
For passive investors: Depreciation is non-cash, so a rental often shows a tax loss while cash-flowing — sheltering income. Rental losses are passive: they offset passive income freely, and up to $25,000/yr can offset ordinary (W-2) income if you actively participate and your MAGI is under $100k (phasing out to $0 by $150k); unused losses carry forward. On sale, claimed depreciation is recaptured at up to 25%, and gains may owe capital-gains tax (a 1031 exchange can defer both). Figures are a year-1 estimate at your 24.0% rate — not tax advice; consult a CPA.
Schools (NCES district)
- District
- Hornell City School District
- NCES district ID
- 3614820
- Math proficiency
- 33% ▼ -8.00%
- Reading proficiency
- 49% ▲ 6.00%
- Median HH income
- $40,251
- Composite
- 34.33/100
- National rank
- #5234
- State rank
- #519 of 590 in NY
Livability — North Hornell
- Score
- 67/100
- State rank
- #579
- US rank
- #10449
Category grades
Schools grade is shown separately in the Schools card above.
Census & demographics
- Census place
- North Hornell, NY
- County
- Steuben County · 41,193 people
- Metro
- Corning, NY
- Population (ZIP)
- 12,383
- Household income
- $57,874
- Rent vs Own
- Severe rent burden
- 415.0
Population outlook (Steuben County) Hauer SSP2
- Today (2025)
- 93,062 people
- By 2030
- 89,793 · -3.5%
- By 2040
- 82,353 · -11.5%
- By 2050
- 74,286 · -20.2%
- By 2075
- 55,589 · -40.3%
- By 2100
- 37,587 · -59.6%
Race, ethnicity, and origin ACS 2023
- Neighborhood character
- Predominantly White (92%)
- Race & ethnicity
- White 92% Two or more races 3% Hispanic / Latino 3% Black 2%
- Common ancestry
- Lithuanian 3% Romanian 2% Iranian 2%
- Foreign-born
- 4% · Canada
- Languages at home
- 95% English-only · French/Haitian/Cajun 2% Arabic 1% Spanish 1%
Political lean MEDSL · Steuben
- 2024 margin
- Solid R (+31.8) · D 34.1% · R 65.9%
- 2008→2024 swing
- -15.0pp toward R · 2008: -16.8pp · 2024: -31.8pp
- All cycles
- 2024: R+31.8 2020: R+29.6 2016: R+36.2 2012: R+16.4 2008: R+16.8
Not yet ingested
- Civics
- —
Market trends
- HPI YoY
- ▲ 3.95%
- Current HPI
- 210.1986
- Rent YoY
- —
- Metro
- Corning, NY
- State GDP YoY
- ▲ 2.60%
- F500 in state
- 92
Industry mix (Fortune 500 HQ in NY)
| Industry | F500 HQs | Revenue |
|---|---|---|
| Financial Services | 10 | $950B |
|
||
| Consumer Goods | 9 | $162B |
|
||
| Insurance | 4 | $225B |
|
||
| Telecommunications | 2 | $144B |
|
||
| Pharmaceuticals | 2 | $112B |
|
||
| Media / Entertainment | 2 | $69B |
|
||
Price history
+1099.3% since first listed4 events — show timeline
- 2026-05-18 Contingent — UNYREIS
- 2026-04-27 Price Changed $179,900 UNYREIS
- 2026-03-20 Listed $184,900 UNYREIS
- 2007-11-29 Sold (Public Records) $15,000 Public Records
Property tax history
+2.6%/yrLatest (2025): $4,559 · +7.7% YoY. Source: county tax records.
Cash-flow waterfall
monthlySold comps — $/sqft
last 12 mo · ≤1 miLoading sold comps…