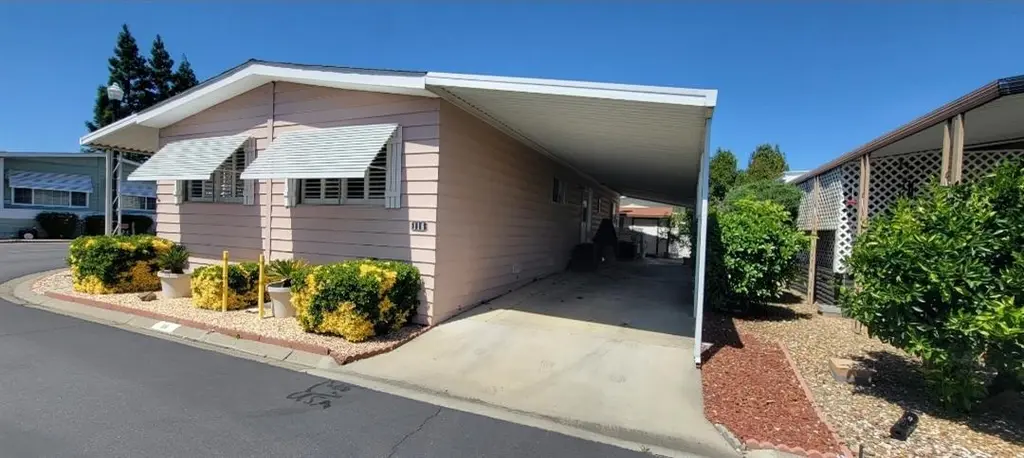
116 Leisureville Cir · Woodland, CA
Flood risk 6/10 · Moderate
- FEMA flood zone
- X (unshaded)
- Chance of flooding over 30 yrs
- 0.7%
- Est. flood insurance / yr
- $507 – $1,088
Fire risk 4/10 · Minor
- Est. fire insurance / yr
- $659 – $1,223
Heat risk 7/10 · Major
- Hot days now (above 104°F)
- 7 days/yr
- Hot days in 30 yrs
- 14 days/yr
Wind risk 1/10 · Minimal
- Chance of severe wind over 30 yrs
- —
Air-quality risk 10/10 · Severe
- Unhealthy air days now
- 26 days/yr
- Unhealthy air days in 30 yrs
- 28 days/yr
Risk factors via First Street. Map © Google.
Why this score? — see what drove the C+ grade
The composite is a weighted blend of 9 inputs, each scored 0–100. Each bar is that input's sub-score; the figure is the points it added to the 100-point composite (weight × sub-score).
- Cash flow +26.0/30.0
- DSCR +8.8/10.0
- 1% rule +6.9/10.0
- ARV discount +6.6/15.0
- Schools +4.0/10.0
- Rent growth +3.9/5.0
- Livability +3.4/5.0
- Condition / age +2.5/5.0
- Appreciation +0.0/10.0
$206,000
🖨 Deal sheet (PDF) 📄 Offer letter ✓ Due diligence
Listing remarks MLS
A well kept 2 bedroom 2 bath double wide mobile home on a large corner lot conveniently located in the well established Leisureville Senior Community which is near several shopping centers and has easy access to I5 and Hwy. 113. This mobile home offers many wonder details including several built-ins and comes with washer, dryer, refrigerater, couch, and a Tuff Shed. Leisureville offers many wonderful amenities including weekly activities, clubhouse, pool, hot tub, patio area, pool table, and much more.
Key facts
- Clubhouse
- Hot tub
- Large corner lot
Tags
Neighborhood map
What this means for you Summary
Snapshot
- This is a 2-bed/2.0-bath manufactured listed at $206k.
Deal economics
- At list price, monthly cash flow is $514 ($6k/yr) — positive.
- The deal already cash-flows at list — no discount required.
- Meets the 1% rule at list price ($2k rent vs $206k).
- Recommended offer: $194k (6.0% below list) — sets the bar for market timing.
- Cap rate 9.3% vs local median 3.4% in Woodland — top-decile yield for the area; either an underpriced asset or a hidden risk that comps aren't pricing in. Stress-test before assuming the spread holds.
Location & tenants
- Location reads 67/100 on livability (#314 in CA) — a middle-class / working-renter tenant base. Strengths: employment A, housing A; Watch: amenities C-, schools F, cost of living F.
- Woodland Joint Unified (suburban): math 34% / reading 58% proficiency, ranked #171 of 517 in CA (top 33%) — families likely to look elsewhere, expect single-tenant / working-renter base with shorter leases.
- Market conditions: Rents rising fast (+5.4%/yr); 99 active listings in the ZIP; 6 comparable units currently listed for rent nearby; rentals at typical pace (median 19d on market — plan ~3-4 weeks tenant-placement turnaround); solid renter incomes; 721 units permitted in Yolo County in 2024 (260 in 5+ unit buildings).
Forward outlook
- Local home prices are declining (-3.0%/yr); year-one equity from $1k of loan paydown is wiped out by about $6k of value loss. Plan a longer hold.
- Yolo County population projected at +31% by 2050 — long-run rental-demand tailwind backs the buy-and-hold thesis.
- At projected returns (-3.0% appreciation + 5.4% rent growth), your $58k cash investment doubles in ~9 years — after that, you're playing with house money.
Negotiation context
- It's been on market 61 days — a 6% lower offer ($194k) is reasonable based on typical stale-listing flexibility.
Risks & watch-outs
- Climate carrying-cost: major flood risk; extreme-heat days projected 7→14/yr by 2055 (HVAC capex compounding) — expect insurance premiums to compound above CPI over the hold.
Questions for the listing agent
- It's been on market 61 days. Have you received any prior offers? Is the seller open to a 6% concession, seller financing, or rate buy-down credit?
- Built in 1976 — when were the roof, HVAC, electrical panel, plumbing, and water heater last replaced?
- Why hasn't it sold? Are there any deal-killer items the seller is aware of (foundation, flood, title, zoning, code violations)?
- Is there a deadline driving the sale (1031 exchange, divorce, estate, relocation)? That informs how much negotiation room exists.
- Schools are F-rated, which usually means shorter tenancies and higher turnover. Who's the typical renter profile here, and what's been the actual vacancy rate?
- What's the average days-on-market for RENTAL listings here right now (not sales)? A rising rental-DOM trend means longer vacancies and softer asking-rent achievability than the comps imply.
- What's the recent tenant-quality profile in this submarket — average credit score on applications, eviction rate, late-payment / NSF rate, and stable-employment percentage? A property-management company in the area should have these aggregated.
- How much new for-sale + rental construction is in the pipeline within 1–3 miles? Heavy new supply typically softens prices + rents 12–24 months out; constrained supply supports both.
Investment metrics
- 1% rule
- 1.19% ✓
- Cap rate
- 9.28%
- Cash-on-cash
- 10.69%
- DSCR
- 1.48
- GRM
- 7.0
CMA / ARV
- ARV (median comp)
- $201,894
- List price
- $206,000
- Delta
- 2.03%
- Verdict
- FAIR
- Comps
- 4 within 1.0 mi
Show comp detail 11 sales within ~0.75 mi
| Address | Dist | Beds/Ba | Sqft | Sold | Price | $/sf | Match |
|---|---|---|---|---|---|---|---|
| 118 Leisureville Cir | 0.09mi | 2/2.0 | 1,440 (0%) | 9mo | $210,000 | $146 | 88 |
| 24 Leisureville Cir | 0.00mi | 2/2.0 | 1,440 (0%) | 14mo | $300,000 | $208 | 88 |
| 85 Sand Point Dr | 0.09mi | 2/2.0 | 1,440 (0%) | 16mo | $115,000 | $80 | 83 |
| 49 Embassy Dr | 0.10mi | 2/2.0 | 1,440 (0%) | 16mo | $160,000 | $111 | 83 |
| 139 Leisureville Cir | 0.09mi | 2/2.0 | 1,344 (-7%) | 3mo | $208,500 | $155 | 82 |
| 55 Embassy Dr | 0.08mi | 3/2.0 (+1) | 1,440 (0%) | 13mo | $235,000 | $163 | 80 |
| 35 Leisureville Cir | 0.07mi | 2/2.0 | 1,440 (0%) | 22mo | $217,000 | $151 | 79 |
| 138 Leisureville Cir | 0.10mi | 2/2.0 | 1,440 (0%) | 21mo | $167,000 | $116 | 78 |
| 54 Embassy Dr | 0.09mi | 2/2.0 | 1,440 (0%) | 22mo | $199,000 | $138 | 77 |
| 59 Embassy Dr | 0.07mi | 2/2.0 | 1,373 (-5%) | 23mo | $265,000 | $193 | 70 |
| 76 Sand Point St | 0.04mi | 2/2.0 | 1,248 (-13%) | 19mo | $155,000 | $124 | 60 |
Match score weights: distance 35% · size 25% · config 20% · recency 20%. Top-matched comps best support the ARV.
Projected returns pro-forma
-3.0% appreciation · 5.4% rent growth · sell at horizon
- IRR
- 2.4%
- Equity multiple
- 1.09×
- Total profit
- $5,433
- Equity at exit
- $30,715
- IRR
- 14.2%
- Equity multiple
- 2.27×
- Total profit
- $73,139
- Equity at exit
- $17,811
Cash invested: $57,680 (down + closing). Projections, not guarantees.
Landlord ↔ Tenant lean methodology
- Overall (STATE)
- 18 Strongly Tenant-Friendly
- State California
- 18 Strongly Tenant-Friendly · D+13
- County
- — inherits STATE
- City
- — inherits STATE
ZIP-level market 95776
- Home prices YoY
- -30.2%
- Rents YoY
- 5.4%
- Active inventory
- 99
- Price-to-rent
- 7.0×
Monthly cashflow live
- Estimated rent
- $2,452 high interval (Pro) →
- Mortgage (P&I)
- −$1,080
- Tax est. 1.5%
- −$258 /mo · $3,090/yr
- Insurance
- −$86
- HOA
- −$0
- Vacancy / Maint / Mgmt
- −$515
- Net cashflow
- $514
Break-even live
Sensitivity live
| Price | -10% $656 | -5% $585 | +0% $514 | +5% $442 | +10% $371 |
|---|---|---|---|---|---|
| Rent | -10% $320 | -5% $417 | +0% $514 | +5% $610 | +10% $707 |
| Rate | -1.0pp $617 | -0.5pp $566 | base $514 | +0.5pp $460 | +1.0pp $406 |
UW: 25.0% down · 7.5% · 30yr · 1.5% tax · 5.0% vac · 8.0% maint · 8.0% mgmt
Financing live
Cash to close
- Down payment
- $51,500
- Closing costs
- $6,180
- Reserves months
- —
- Total cash needed
- —
Loan-product check · same deal, 3 products live
Conventional
25% down · 7.5% · 30yr
- Down + closing
- —
- Monthly P&I
- —
- Monthly cashflow
- —
- DSCR
- —
- Eligible?
- —
Personal DTI + credit; lowest rate.
DSCR
20% down · 8.5% · 30yr
- Down + closing
- —
- Monthly P&I
- —
- Monthly cashflow
- —
- DSCR
- —
- Eligible?
- —
No personal income docs; deal must DSCR.
Hard money
10% down · 12.0% · 12mo
- Down + closing
- —
- Monthly P&I
- —
- Monthly cashflow
- —
- DSCR
- —
- Eligible?
- —
Short-term bridge; refi at stabilization.
Rent comps 6 comps
| Address | Beds | Baths | Sqft | Rent | $/sqft | DOM | Units | Dist |
|---|---|---|---|---|---|---|---|---|
| 1180 Matmor Rd Woodland, CA | 2.0 | 1.0–2.0 | 893 | $1,850 | $2.07 | 3d | 3 | 0.18mi |
| 1455 Hoover Ct Woodland, CA | 3.0 | 2.0 | 1100 | $2,700 | $2.45 | 18d | 1 | 0.50mi |
| 575 Matmor Rd Woodland, CA | 1.0–2.0 | 1.0–2.0 | 840 | $2,105 | $2.51 | 2d | 6 | 0.76mi |
| 1080 Barnes Cir Woodland, CA | 3.0 | 2.0 | 1242 | $2,700 | $2.17 | 5d | 1 | 0.99mi |
| 1231 1/2 Eunice Dr Woodland, CA | 2.0 | 2.5 | 1196 | $2,400 | $2.01 | 44d | 1 | 1.16mi |
| 29 Southwood Dr Woodland, CA | 3.0 | 1.0 | 1120 | $2,595 | $2.32 | 44d | 1 | 1.20mi |
Listing history 15 events
-
2026-06-21days on market $206,000 Active 61 DOM
-
2026-06-18days on market $206,000 Active 58 DOM
-
2026-06-17days on market $206,000 Active 57 DOM
-
2026-06-16days on market $206,000 Active 56 DOM
-
2026-06-15days on market $206,000 Active 55 DOM
-
2026-06-13days on market $206,000 Active 53 DOM
-
2026-06-09days on market $206,000 Active 49 DOM
-
2026-06-08days on market $206,000 Active 48 DOM
-
2026-06-07days on market $206,000 Active 47 DOM
-
2026-06-05days on market $206,000 Active 44 DOM
-
2026-06-03days on market $206,000 Active 43 DOM
-
2026-06-02days on market $206,000 Active 42 DOM
-
2026-06-01days on market $206,000 Active 41 DOM
-
2026-05-31days on market $206,000 Active 40 DOM
-
2026-04-21$206,000 Active 508-char remark
Show marketing remark (508 chars)
A well kept 2 bedroom 2 bath double wide mobile home on a large corner lot conveniently located in the well established Leisureville Senior Community which is near several shopping centers and has easy access to I5 and Hwy. 113. This mobile home offers many wonder details including several built-ins and comes with washer, dryer, refrigerater, couch, and a Tuff Shed. Leisureville offers many wonderful amenities including weekly activities, clubhouse, pool, hot tub, patio area, pool table, and much more.
ⓘ Source: listings_history table (triggers on properties + properties_extension) + one-shot
backfill from property_details.listing_events for pre-trigger history.
Climate risk First Street
- Flood 6/10 Major FEMA zone X (unshaded) · 70% chance over 30 yrs
- Wildfire 4/10 Moderate
- Heat 7/10 Severe 7 d/yr ≥104°F today · 14 d/yr by 30 yrs out
- Wind 1/10 Low
- Air quality 10/10 Extreme 26 unhealthy d/yr today · 28 by 30 yrs out
Nearby sold comps map
Loading sold comps map…
Walkable amenities ~0.75 mi
Loading nearby amenities…
Taxation est. · year 1
- Rental income
- $29,427
- − Mortgage interest
- −$11,539
- − Property taxes
- −$3,090
- − Insurance
- −$1,030
- − Repairs & maintenance
- −$2,354
- − Management
- −$2,354
- − Depreciation
- −$5,993
- Taxable income
- $3,066
- Est. tax owed @ 24.0%
- −$736
- After-tax cash flow
- $5,428/yr
For passive investors: Depreciation is non-cash, so a rental often shows a tax loss while cash-flowing — sheltering income. Rental losses are passive: they offset passive income freely, and up to $25,000/yr can offset ordinary (W-2) income if you actively participate and your MAGI is under $100k (phasing out to $0 by $150k); unused losses carry forward. On sale, claimed depreciation is recaptured at up to 25%, and gains may owe capital-gains tax (a 1031 exchange can defer both). Figures are a year-1 estimate at your 24.0% rate — not tax advice; consult a CPA.
Schools (NCES district)
- District
- Woodland Joint Unified
- NCES district ID
- 0643080
- Math proficiency
- 34% ▲ 6.00%
- Reading proficiency
- 58% ▲ 15.00%
- Median HH income
- $57,556
- Composite
- 40.1/100
- National rank
- #3803
- State rank
- #171 of 517 in CA
Livability — Woodland
- Score
- 67/100
- State rank
- #314
- US rank
- #10682
Category grades
Schools grade is shown separately in the Schools card above.
Census & demographics
- Census place
- Woodland, CA
- County
- Yolo County · 212,115 people
- City population
- 66,420
- Metro
- Sacramento-Roseville-Folsom, CA
- Population (ZIP)
- 28,718
- Household income
- $106,698
- Rent vs Own
- Severe rent burden
- 654.0
Population outlook (Yolo County) Hauer SSP2
- Today (2025)
- 242,183 people
- By 2030
- 257,662 · +6.4%
- By 2040
- 288,050 · +18.9%
- By 2050
- 318,202 · +31.4%
- By 2075
- 392,736 · +62.2%
- By 2100
- 438,150 · +80.9%
Race, ethnicity, and origin ACS 2023
- Neighborhood character
- Diverse neighborhood (Simpson 0.67)
- Race & ethnicity
- Hispanic / Latino 46% White 32% Two or more races 20% Asian 13% Black 2%
- Hispanic origin (detail)
- Mexican 43%
- Common ancestry
- Italian 3% Scotch-Irish 2% Lithuanian 1%
- Foreign-born
- 25% · Canada, China, South Korea
- Languages at home
- 57% English-only · Spanish 31% Other Indo-European 7% Chinese 2%
Political lean MEDSL · Yolo
- 2024 margin
- Solid D (+36.2) · D 66.3% · R 30.1% · Other 3.6%
- 2008→2024 swing
- 0.0pp no change · 2008: 36.2pp · 2024: 36.2pp
- All cycles
- 2024: D+36.2 2020: D+41.4 2016: D+42.0 2012: D+33.2 2008: D+36.2
Not yet ingested
- Civics
- —
Market trends
- HPI YoY
- ▼ -119.41%
- Current HPI
- 276.202
- Rent YoY
- ▲ 5.40%
- Metro
- Sacramento-Roseville-Folsom, CA
- State GDP YoY
- ▲ 3.21%
- F500 in state
- 116
Industry mix (Fortune 500 HQ in CA)
| Industry | F500 HQs | Revenue |
|---|---|---|
| Technology | 27 | $1,492B |
|
||
| Financial Services | 3 | $174B |
|
||
| Retail | 3 | $44B |
|
||
| Insurance | 3 | $26B |
|
||
| Media / Entertainment | 2 | $115B |
|
||
| Pharmaceuticals / Biotech | 2 | $62B |
|
||
Price history
1 event — show timeline
- 2026-04-21 Listed $206,000 CRMLS
Cash-flow waterfall
monthlySold comps — $/sqft
last 12 mo · ≤1 miLoading sold comps…