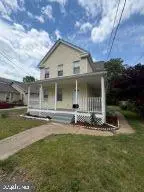
3706 Taylor St · Brentwood, MD
Flood risk 1/10 · Minimal
- FEMA flood zone
- X (shaded)
- Chance of flooding over 30 yrs
- 0.0%
- Est. flood insurance / yr
- $507 – $1,088
Fire risk 1/10 · Minimal
- Est. fire insurance / yr
- $755 – $1,403
Heat risk 7/10 · Major
- Hot days now (above 105°F)
- 7 days/yr
- Hot days in 30 yrs
- 15 days/yr
Wind risk 4/10 · Minor
- Chance of severe wind over 30 yrs
- 17.0%
Air-quality risk 4/10 · Minor
- Unhealthy air days now
- 4 days/yr
- Unhealthy air days in 30 yrs
- 5 days/yr
Risk factors via First Street. Map © Google.
Why this score? — see what drove the C- grade
The composite is a weighted blend of 9 inputs, each scored 0–100. Each bar is that input's sub-score; the figure is the points it added to the 100-point composite (weight × sub-score).
- ARV discount +15.0/15.0
- Cash flow +10.7/30.0
- Appreciation +10.0/10.0
- Livability +4.2/5.0
- DSCR +3.1/10.0
- 1% rule +2.6/10.0
- Rent growth +2.5/5.0
- Condition / age +2.5/5.0
- Schools +1.7/10.0
$409,000
🖨 Deal sheet (PDF) 📄 Offer letter ✓ Due diligence
Listing remarks
Welcome home to 3706 Taylor Street! This charming, detached home is completely remodeled and move-in ready. The entire interior has been renovated. There are two new bathrooms, new central air, new laminate flooring and new kitchen with brand new appliances. The roof was also replaced recently. Relax on the spacious front porch before stepping inside to a bright and inviting main level which features new laminate floors, large living room, separate dining room, new kitchen, new bathroom and utility room. Upstairs you'll find three comfortable bedrooms with new laminate floors and new bathroom. There is a brand-new deck at the back that flows into an expansive backyard. The outside space is
Key facts
- 7,000 sq ft lot
- Built 1900
- Listed 12 days
Property features AI
Finance
- Other: Ownership is fee simple; Above-grade finished area reported as 1,511 (assessor)
Exterior
- Parking: Driveway
- Utilities: Public water; Public sewer
- Home design: Detached structure; Frame construction
- Construction: Crawl space and slab foundation; Above-grade and below-grade structures noted
- Exterior features: Not located on tidal water
Interior
- Bedrooms: Three bedrooms on the upper level
- Bathrooms: Two full bathrooms (one on main level, one on first upper level)
- Heating & cooling: Central heating (electric); Central air conditioning (electric); Natural gas hot water
- Interior features: Living area reported by assessor; No basement
Neighborhood map
What this means for you Summary
Snapshot
- This is a 3-bed/1.0-bath single-family listed at $409k.
Deal economics
- At list price, monthly cash flow is $-194 ($-2k/yr) — negative.
- To cash-flow at today's rent, offer at most $375k (8.4% below list).
- To meet the 1% rule (rent ≥ 1% of price), the offer needs to be $312k (23.6% below list).
- Recommended offer: $312k (23.6% below list) — sets the bar for 1% rule.
Location & tenants
- Location reads 83/100 on livability (#24 in MD, #899 nationally) — a professional / high-income tenant draw. Strengths: commute A+, employment A+, housing A+; Watch: cost of living D-.
- Prince George'S County Public Schools (suburban): math 8% / reading 24% proficiency, ranked #21 of 24 in MD (top 88%) — low school quality limits family demand, transient renter base, plan for 1-2y turnover.
- Zoned schools: Mt Rainier Elementary (math 8% / reading 17%, grade F, #538 of 860 statewide, top 64%, 328 students, 79% FRL); Hyattsville Middle (math 5% / reading 23%, grade F, #196 of 225 statewide, top 88%, 705 students, 83% FRL); Northwestern High (math 15% / reading 32%, grade F, #169 of 222 statewide, top 76%, 2,346 students, 80% FRL) — zoned schools average 81% FRL vs 53% district-wide (27 pts higher); higher-poverty schools than district average — tighter screening recommended.
- Market conditions: 21 active listings in the ZIP; 33 comparable units currently listed for rent nearby; rentals at typical pace (median 21d on market — plan ~3-4 weeks tenant-placement turnaround); solid renter incomes; 1,481 units permitted in Prince George's County in 2024 (0 in 5+ unit buildings).
- This rent runs 41% of the median local income ($92k/yr) — at the standard rent-burdened threshold; future hikes will face affordability resistance.
Forward outlook
- In year one you build about $44k of equity ($3k loan paydown + $41k appreciation (10.0% local appreciation)).
- Prince George's County population projected at +18% by 2050 — long-run rental-demand tailwind backs the buy-and-hold thesis.
- By year 2, paydown + projected appreciation supports a ~$70k cash-out refi (75% LTV) — recoverable capital for the next deal without selling this one.
Negotiation context
- Only 12 days on market — expect competitive offers; lowballing is unlikely to land.
- Current owner paid $38k; list at $409k implies a 991% gain — meaningful room to come down on a strong offer.
Risks & watch-outs
- Watch-outs: built in 1900 — expect roof / HVAC / electrical / plumbing capex.
- Climate carrying-cost: extreme-heat days projected 7→15/yr by 2055 (HVAC capex compounding) — expect insurance premiums to compound above CPI over the hold.
Questions for the listing agent
- What do current leases actually rent for vs. the listed asking? Can we see a recent rent roll and the last 12 months of T-12 income?
- Built in 1900 — when were the roof, HVAC, electrical panel, plumbing, and water heater last replaced?
- Is there a deadline driving the sale (1031 exchange, divorce, estate, relocation)? That informs how much negotiation room exists.
- Schools are D-rated, which usually means shorter tenancies and higher turnover. Who's the typical renter profile here, and what's been the actual vacancy rate?
- What's the average days-on-market for RENTAL listings here right now (not sales)? A rising rental-DOM trend means longer vacancies and softer asking-rent achievability than the comps imply.
- What's the recent tenant-quality profile in this submarket — average credit score on applications, eviction rate, late-payment / NSF rate, and stable-employment percentage? A property-management company in the area should have these aggregated.
- How much new for-sale + rental construction is in the pipeline within 1–3 miles? Heavy new supply typically softens prices + rents 12–24 months out; constrained supply supports both.
Investment metrics
- 1% rule
- 0.76% ✗
- Cap rate
- 5.72%
- Cash-on-cash
- -2.03%
- DSCR
- 0.91
- GRM
- 10.9
CMA / ARV
- ARV (on-the-fly)
- $512,229
- Comps found
- 12
Show comp detail 12 sales within ~0.75 mi
| Address | Dist | Beds/Ba | Sqft | Sold | Price | $/sf | Match |
|---|---|---|---|---|---|---|---|
| 3800 35th St | 0.33mi | 3/2.0 | 1,560 (+3%) | 0mo | $435,000 | $279 | 75 |
| 4014 37th St | 0.12mi | 3/2.5 | 1,584 (+5%) | 7mo | $550,000 | $347 | 75 |
| 3202 Taylor St | 0.33mi | 3/2.0 | 1,578 (+4%) | 1mo | $535,000 | $339 | 72 |
| 4520 37th St | 0.40mi | 3/2.0 | 1,520 (+1%) | 6mo | $331,000 | $218 | 71 |
| 3600 Taylor St | 0.09mi | 4/3.5 (+1) | 1,614 (+7%) | 2mo | $570,000 | $353 | 68 |
| 3212 Upshur St | 0.31mi | 3/1.0 | 1,295 (-14%) | 5mo | $485,000 | $375 | 58 |
| 3713 35th St | 0.50mi | 4/2.0 (+1) | 1,440 (-5%) | 8mo | $430,000 | $299 | 54 |
| 4526 41st Ave | 0.42mi | 3/3.0 | 1,360 (-10%) | 3mo | $335,000 | $246 | 53 |
| 3009 Otis St NE | 0.66mi | 3/3.5 | 1,515 (+0%) | 8mo | $685,000 | $452 | 52 |
| 3211 Varnum St | 0.33mi | 4/2.5 (+1) | 1,326 (-12%) | 3mo | $510,000 | $385 | 51 |
| 4506 41st Ave | 0.37mi | 4/3.5 (+1) | 1,680 (+11%) | 4mo | $455,000 | $271 | 45 |
| 3110 Newton St NE | 0.64mi | 2/1.0 (-1) | 1,371 (-9%) | 6mo | $310,000 | $226 | 45 |
Match score weights: distance 35% · size 25% · config 20% · recency 20%. Top-matched comps best support the ARV.
Projected returns pro-forma
10.0% appreciation · 3.0% rent growth · sell at horizon
- IRR
- 22.8%
- Equity multiple
- 2.84×
- Total profit
- $210,332
- Equity at exit
- $368,460
- IRR
- 20.4%
- Equity multiple
- 6.49×
- Total profit
- $629,010
- Equity at exit
- $794,597
Cash invested: $114,520 (down + closing). Projections, not guarantees.
Landlord ↔ Tenant lean methodology
- Overall (STATE)
- 27 Tenant-Leaning
- State Maryland
- 27 Tenant-Leaning · D+14
- County
- — inherits STATE
- City
- — inherits STATE
ZIP-level market 20722
- Home prices YoY
- 4.1%
- Active inventory
- 21
- Price-to-rent
- 10.9×
Monthly cashflow live
- Estimated rent
- $3,124 high interval (Pro) →
- Mortgage (P&I)
- −$2,145
- Tax from tax record
- −$347 /mo · $4,159/yr
- Insurance
- −$170
- HOA
- −$0
- Vacancy / Maint / Mgmt
- −$656
- Net cashflow
- $-194
Break-even live
Sensitivity live
| Price | -10% $37 | -5% $-78 | +0% $-194 | +5% $-310 | +10% $-426 |
|---|---|---|---|---|---|
| Rent | -10% $-441 | -5% $-318 | +0% $-194 | +5% $-71 | +10% $53 |
| Rate | -1.0pp $12 | -0.5pp $-90 | base $-194 | +0.5pp $-300 | +1.0pp $-408 |
UW: 25.0% down · 7.5% · 30yr · 1.5% tax · 5.0% vac · 8.0% maint · 8.0% mgmt
Financing live
Cash to close
- Down payment
- $102,250
- Closing costs
- $12,270
- Reserves months
- —
- Total cash needed
- —
Loan-product check · same deal, 3 products live
Conventional
25% down · 7.5% · 30yr
- Down + closing
- —
- Monthly P&I
- —
- Monthly cashflow
- —
- DSCR
- —
- Eligible?
- —
Personal DTI + credit; lowest rate.
DSCR
20% down · 8.5% · 30yr
- Down + closing
- —
- Monthly P&I
- —
- Monthly cashflow
- —
- DSCR
- —
- Eligible?
- —
No personal income docs; deal must DSCR.
Hard money
10% down · 12.0% · 12mo
- Down + closing
- —
- Monthly P&I
- —
- Monthly cashflow
- —
- DSCR
- —
- Eligible?
- —
Short-term bridge; refi at stabilization.
Rent comps 33 comps
| Address | Beds | Baths | Sqft | Rent | $/sqft | DOM | Units | Dist |
|---|---|---|---|---|---|---|---|---|
| 3709 Parkwood St Brentwood, MD | 4.0 | 3.0 | 1104 | $2,950 | $2.67 | 45d | 1 | 0.48mi |
| 4519 32nd St Mount Rainier, MD | 3.0 | 2.0 | 1500 | $1,200 | $0.80 | 14d | 1 | 0.50mi |
| 4202 30th St Mount Rainier, MD | 3.0 | 1.0 | 1324 | $2,450 | $1.85 | 26d | 1 | 0.51mi |
| 4531 32nd St Mount Rainier, MD | 3.0 | 2.0 | 1524 | $2,500 | $1.64 | 45d | 1 | 0.54mi |
| 3615 Eastern Ave Mount Rainier, MD | 4.0 | 3.0 | 1223 | $3,500 | $2.86 | 1d | 1 | 0.59mi |
| 4401 29th St Unit A Mt Rainier, MD | 4.0 | 2.0 | 1800 | $3,500 | $1.94 | 7d | 1 | 0.60mi |
| 4221 28th St Mount Rainier, MD | 3.0 | 3.0 | 1800 | $3,500 | $1.94 | 20d | 1 | 0.60mi |
| 3704 42nd Ave Brentwood, MD | 4.0 | 2.0 | 1678 | $3,900 | $2.32 | 13d | 1 | 0.61mi |
| 5042 38th Ave Hyattsville, MD | 1.0–2.0 | 1.0 | 983 | $1,750 | $1.78 | 45d | 1 | 0.74mi |
| 3704 Hamilton St Hyattsville, MD | 4.0 | 3.0 | 1978 | $4,000 | $2.02 | 7d | 1 | 0.82mi |
| 2600 Queens Chapel Rd Hyattsville, MD | 1.0–3.0 | 1.0–2.0 | 1086 | $2,545 | $2.34 | 14d | 9 | 0.83mi |
| 2615 Otis St NE Washington, DC | 3.0 | 2.0 | 2217 | $3,750 | $1.69 | 5d | 1 | 0.83mi |
| 2417 Otis St NE Washington, DC | 3.0 | 2.5 | 1854 | $3,899 | $2.10 | 9d | 1 | 0.91mi |
| 2400 Queens Chapel Rd Hyattsville, MD | 2.0 | 1.0–2.0 | 752 | $2,038 | $2.71 | 0d | 9 | 0.92mi |
| 4812 Crest View Dr Hyattsville, MD | 3.0 | 3.0 | 1280 | $3,500 | $2.73 | 14d | 1 | 0.99mi |
| 3119 S Dakota Ave NE Unit A Washington, DC | 2.0 | 1.0 | 1676 | $1,900 | $1.13 | 26d | 1 | 1.07mi |
| 3119 S Dakota Ave NE Unit B Washington, DC | 2.0 | 1.0 | 1676 | $1,800 | $1.07 | 26d | 1 | 1.07mi |
| 3149 Cherry Rd NE Washington, DC | 3.0 | 3.5 | 1881 | $3,795 | $2.02 | 18d | 1 | 1.11mi |
| 3216 22nd St NE Washington, DC | 3.0 | 2.0 | 2156 | $4,500 | $2.09 | 20d | 1 | 1.21mi |
| 5334 Baltimore Ave Hyattsville, MD | 2.0 | 1.0–2.0 | 903 | $3,501 | $3.88 | 1d | 52 | 1.21mi |
| 3634 Commodore Joshua Barney Dr NE Washington, DC | 4.0 | 4.5 | 2100 | $4,100 | $1.95 | 26d | 1 | 1.25mi |
| 5685 Little Branch Run Hyattsville, MD | 3.0 | 1.0–2.0 | 939 | $4,184 | $4.46 | 0d | 20 | 1.26mi |
| 5701 31st Ave Hyattsville, MD | 3.0 | 2.0 | 1336 | $3,100 | $2.32 | 23d | 1 | 1.27mi |
| 1663 Webster St NE Washington, DC | 4.0 | 2.5 | 1758 | $3,757 | $2.14 | 20d | 1 | 1.31mi |
| 2414 Hamlin Pl NE Washington, DC | 3.0 | 1.5 | 1500 | $2,550 | $1.70 | 20d | 1 | 1.31mi |
| 3801 Oglethorpe St Unit A Hyattsville, MD | 2.0 | 1.0 | 1450 | $2,950 | $2.03 | 20d | 1 | 1.33mi |
| 5501 45th Ave Hyattsville, MD | 2.0 | 1.0–2.0 | 829 | $2,325 | $2.80 | 1d | 22 | 1.33mi |
| 2410 South Dakota Ave NE Washington, DC | 4.0 | 3.5 | 2222 | $4,400 | $1.98 | 16d | 1 | 1.35mi |
| 3011 20th St NE Washington, DC | 3.0 | 2.0 | 1103 | $5,600 | $5.08 | 26d | 1 | 1.38mi |
| 5831 33rd Ave Hyattsville, MD | 3.0 | 2.0 | 1170 | $2,950 | $2.52 | 45d | 1 | 1.39mi |
| 3026 Channing St NE Washington, DC | 2.0 | 1.0 | 1224 | $2,399 | $1.96 | 26d | 1 | 1.40mi |
| 2705 24th St NE Washington, DC | 3.0 | 2.0 | 1900 | $3,150 | $1.66 | 26d | 1 | 1.43mi |
| 5712 45th Ave Hyattsville, MD | 3.0 | 2.5 | 1396 | $3,100 | $2.22 | 45d | 1 | 1.44mi |
Listing history 16 events
-
2026-06-21days on market $409,000 Active 12 DOM
-
2026-06-18days on market $409,000 Active 9 DOM
-
2026-06-17days on market $409,000 Active 8 DOM
-
2026-06-16days on market $409,000 Active 7 DOM
-
2026-06-15days on market $409,000 Active 6 DOM
-
2026-06-13days on market $409,000 Active 4 DOM
-
2026-06-10statusdays on market $409,000 Active 1 DOM
-
2026-06-08days on market $409,000 Coming Soon 18 DOM
-
2026-06-07days on market $409,000 Coming Soon 17 DOM
-
2026-06-04days on market $409,000 Coming Soon 14 DOM
-
2026-06-03days on market $409,000 Coming Soon 13 DOM
-
2026-06-02days on market $409,000 Coming Soon 12 DOM
-
2026-06-01days on market $409,000 Coming Soon 11 DOM
-
2026-05-31days on market $409,000 Coming Soon 10 DOM
-
2026-05-22historical $409,000
-
1978-08-17soldstatus $37,500
ⓘ Source: listings_history table (triggers on properties + properties_extension) + one-shot
backfill from property_details.listing_events for pre-trigger history.
Tax reassessment forecast MD · Partial reset (capped growth)
- Current annual tax
- $4,159 · $347/mo
- Projected year-2 tax
- $4,309 · $359/mo
- Expected delta
- +$150/yr (+$12/mo · 3.6%)
ⓘ Screening estimate from a state-policy table — verify with the county assessor before closing.
Climate risk First Street
- Flood 1/10 Low FEMA zone X (shaded) · 0% chance over 30 yrs
- Wildfire 1/10 Low
- Heat 7/10 Severe 7 d/yr ≥105°F today · 15 d/yr by 30 yrs out
- Wind 4/10 Moderate 17% chance of damaging wind over 30 yrs
- Air quality 4/10 Moderate 4 unhealthy d/yr today · 5 by 30 yrs out
Nearby sold comps map
Loading sold comps map…
Walkable amenities ~0.75 mi
Loading nearby amenities…
Taxation est. · year 1
- Rental income
- $37,484
- − Mortgage interest
- −$22,910
- − Property taxes
- −$4,159
- − Insurance
- −$2,045
- − Repairs & maintenance
- −$2,999
- − Management
- −$2,999
- − Depreciation
- −$11,898
- Taxable loss
- −$9,526
- Est. tax savings @ 24.0%
- +$2,286
- After-tax cash flow
- $-44/yr
For passive investors: Depreciation is non-cash, so a rental often shows a tax loss while cash-flowing — sheltering income. Rental losses are passive: they offset passive income freely, and up to $25,000/yr can offset ordinary (W-2) income if you actively participate and your MAGI is under $100k (phasing out to $0 by $150k); unused losses carry forward. On sale, claimed depreciation is recaptured at up to 25%, and gains may owe capital-gains tax (a 1031 exchange can defer both). Figures are a year-1 estimate at your 24.0% rate — not tax advice; consult a CPA.
Schools (NCES district)
- District
- Prince George'S County Public Schools
- NCES district ID
- 2400510
- Math proficiency
- 8% ▼ -11.00%
- Reading proficiency
- 24% ▼ -9.00%
- Median HH income
- $73,967
- Composite
- 16.82/100
- National rank
- #9151
- State rank
- #21 of 24 in MD
Livability — Brentwood
- Score
- 83/100
- State rank
- #24
- US rank
- #899
Category grades
Schools grade is shown separately in the Schools card above.
Census & demographics
- Census place
- Brentwood, MD
- County
- Prince Georges County · 919,866 people
- Metro
- Washington-Arlington-Alexandria, DC-VA-MD-WV
- Population (ZIP)
- 6,264
- Household income
- $91,875
- Rent vs Own
- Severe rent burden
- 191.0
Population outlook (Prince George's County) Hauer SSP2
- Today (2025)
- 1,005,426 people
- By 2030
- 1,048,416 · +4.3%
- By 2040
- 1,123,425 · +11.7%
- By 2050
- 1,183,220 · +17.7%
- By 2075
- 1,306,202 · +29.9%
- By 2100
- 1,408,179 · +40.1%
Race, ethnicity, and origin ACS 2023
- Neighborhood character
- Diverse neighborhood (Simpson 0.62)
- Race & ethnicity
- Hispanic / Latino 53% Black 29% Two or more races 15% White 10% Native American 3% Asian 3%
- Hispanic origin (detail)
- Mexican 8% Dominican 2%
- Common ancestry
- Slovak 1% Italian 1% Lithuanian 1%
- Foreign-born
- 39% · Canada
- Languages at home
- 45% English-only · Spanish 48% Tagalog/Filipino 2% French/Haitian/Cajun 2%
Political lean MEDSL · Prince George's
- 2024 margin
- Solid D (+75.2) · D 86.3% · R 11.2% · Other 2.5%
- 2008→2024 swing
- -3.3pp toward R · 2008: 78.5pp · 2024: 75.2pp
- All cycles
- 2024: D+75.2 2020: D+80.5 2016: D+81.0 2012: D+80.9 2008: D+78.5
Not yet ingested
- Civics
- —
Market trends
- HPI YoY
- ▲ 16.77%
- Current HPI
- 421.2708
- Rent YoY
- —
- Metro
- Washington-Arlington-Alexandria, DC-VA-MD-WV
- State GDP YoY
- ▲ 2.97%
- F500 in state
- 12
Industry mix (Fortune 500 HQ in MD)
| Industry | F500 HQs | Revenue |
|---|---|---|
| Aerospace / Defense | 1 | $71B |
|
||
| Utilities | 1 | $25B |
|
||
| Hotels | 1 | $24B |
|
||
| Consumer Goods | 1 | $7B |
|
||
| Real Estate | 1 | $6B |
|
||
| Chemicals | 1 | $2B |
|
||
Price history
+990.7% since first listed2 events — show timeline
- 2026-05-22 Coming Soon $409,000 BRIGHT MLS
- 1978-08-17 Sold (Public Records) $37,500 Public Records
Property tax history
+4.8%/yrLatest (2025): $4,159 · +4.3% YoY. Source: county tax records.
Cash-flow waterfall
monthlySold comps — $/sqft
last 12 mo · ≤1 miLoading sold comps…