209 N Willis St · Heyworth, IL
Flood risk 1/10 · Minimal
- FEMA flood zone
- X (unshaded)
- Chance of flooding over 30 yrs
- 0.0%
- Est. flood insurance / yr
- $507 – $1,088
Fire risk 1/10 · Minimal
- Est. fire insurance / yr
- $804 – $1,492
Heat risk 3/10 · Minor
- Hot days now (above 104°F)
- 7 days/yr
- Hot days in 30 yrs
- 18 days/yr
Wind risk 2/10 · Minimal
- Chance of severe wind over 30 yrs
- 2.0%
Air-quality risk 2/10 · Minimal
- Unhealthy air days now
- 1 days/yr
- Unhealthy air days in 30 yrs
- 1 days/yr
Risk factors via First Street. Map © Google.
Why this score? — see what drove the B- grade
The composite is a weighted blend of 9 inputs, each scored 0–100. Each bar is that input's sub-score; the figure is the points it added to the 100-point composite (weight × sub-score).
- Cash flow +30.0/30.0
- 1% rule +10.0/10.0
- DSCR +10.0/10.0
- ARV discount +7.5/15.0
- Livability +3.5/5.0
- Schools +3.0/10.0
- Rent growth +2.5/5.0
- Condition / age +1.0/5.0
- Appreciation +0.0/10.0
$60,000
🖨 Deal sheet (PDF) 📄 Offer letter ✓ Due diligence
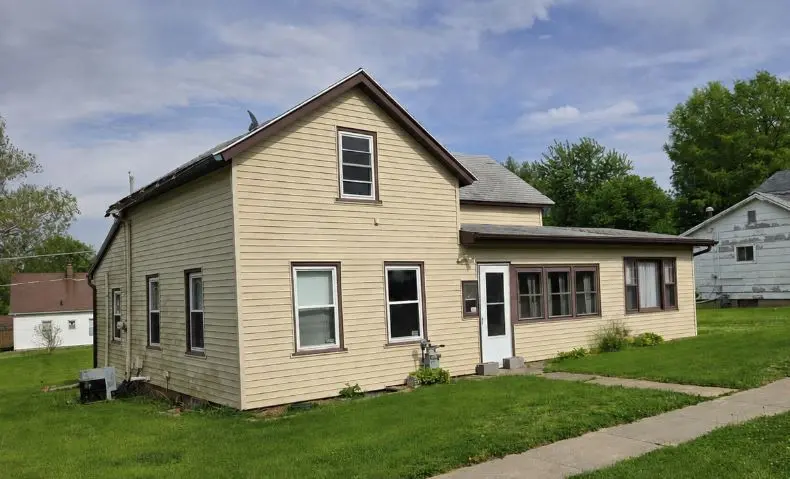
Listing remarks
Investor Opportunity with Endless Potential! This home is a blank canvas ready for your vision and creativity. With most rooms already taken down to the studs, the heavy prep work has been started, giving you the perfect opportunity to design and finish the home exactly the way you want. The layout offers the potential for a 4-bedroom home with 2 bedrooms on the main level and 2 upstairs, including a spacious 12' x 18' primary bedroom. Additional features include two enclosed porches, a 14' x 20' garage, and a large quarter-acre lot with convenient alley access. The oversized yard provides endless possibilities - build a larger garage or shed, add a pool, create a garden oasis, or simply e
Key facts
- Oversized yard
- Two enclosed porches
- 0.26 acre lot
Tags
Property features AI
Finance
- Other: Property not currently leased; Not rebuilt or rehabbed
- Financial info: Special service area: No
- HOA & community: No master association fee required
Exterior
- Parking: Detached garage (1 garage space, 1 total parking space)
- Utilities: Public water; Public sewer
- Home design: Detached single-family home; 1.5-story design; Fee simple ownership; Built over 100 years ago; Vinyl siding
- Construction: Vinyl siding construction; Unfinished basement area (476); Approximately 1,090 total finished area (assessor)
- Exterior features: Lot dimensions approximately 94.4 x 130 x 74.7 x 128.78; Lot size between 0.25 and 0.49 acre
Interior
- Kitchen: Kitchen on main level (10 x 16)
- Bedrooms: 4 bedrooms (Master bedroom on the main level); Bedroom on main level (10 x 14); Bedroom on second level (8 x 14); Bedroom on second level (12 x 14)
- Bathrooms: 1 full bathroom
- Heating & cooling: Natural gas heating
- Interior features: 6 total rooms; Partial cellar basement
- Laundry & utility: Main-level laundry room (8 x 14)
Neighborhood map
What this means for you Summary
Snapshot
- This is a 4-bed/1.0-bath other listed at $60k. Condition is rated poor.
Deal economics
- At list price, monthly cash flow is $441 ($5k/yr) — positive.
- The deal already cash-flows at list — no discount required.
- Meets the 1% rule at list price ($1k rent vs $60k).
- Recommended offer: $58k (3.0% below list) — sets the bar for market timing.
Location & tenants
- Location reads 70/100 on livability (#382 in IL) — a middle-class / working-renter tenant base. Strengths: crime A+, cost of living A+, housing A+; Watch: amenities F, commute F, health & safety F.
- Heyworth CUSD 4 (town): math 28% / reading 35% proficiency, ranked #204 of 620 in IL (top 33%) — families likely to look elsewhere, expect single-tenant / working-renter base with shorter leases.
- Zoned schools: Heyworth Elem School (math 32% / reading 41%, grade F, #497 of 2,056 statewide, top 24%, 490 students, 0% FRL); Heyworth Jr-Sr High School (math 24% / reading 28%, grade F, #244 of 693 statewide, top 35%, 408 students, 0% FRL) — zoned schools average 0% FRL vs 20% district-wide (20 pts lower); this property's tenant base skews higher-income than the district average.
- Market conditions: 8 active listings in the ZIP; 247 units permitted in McLean County in 2024 (54 in 5+ unit buildings).
Forward outlook
- Local home prices are declining (-3.0%/yr); year-one equity from $415 of loan paydown is wiped out by about $2k of value loss. Plan a longer hold.
- At projected returns (-3.0% appreciation + 3.0% rent growth), your $17k cash investment doubles in ~4 years — after that, you're playing with house money.
Negotiation context
- It's been on market 38 days — a 3% lower offer ($58k) is reasonable based on typical stale-listing flexibility.
Risks & watch-outs
- Watch-outs: property tax is 3.3% of price; built in 1899 — expect roof / HVAC / electrical / plumbing capex.
Questions for the listing agent
- It's been on market 38 days. Have you received any prior offers? Is the seller open to a 3% concession, seller financing, or rate buy-down credit?
- Have any recent inspections been done? Can we get a copy of the seller's disclosures and any deferred-maintenance estimates?
- Built in 1899 — when were the roof, HVAC, electrical panel, plumbing, and water heater last replaced?
- Property tax is high relative to price — has the assessment been appealed recently, and will the sale trigger a re-assessment?
- Is there a deadline driving the sale (1031 exchange, divorce, estate, relocation)? That informs how much negotiation room exists.
- What's the average days-on-market for RENTAL listings here right now (not sales)? A rising rental-DOM trend means longer vacancies and softer asking-rent achievability than the comps imply.
- What's the recent tenant-quality profile in this submarket — average credit score on applications, eviction rate, late-payment / NSF rate, and stable-employment percentage? A property-management company in the area should have these aggregated.
- How much new for-sale + rental construction is in the pipeline within 1–3 miles? Heavy new supply typically softens prices + rents 12–24 months out; constrained supply supports both.
Investment metrics
- 1% rule
- 1.99% ✓
- Cap rate
- 15.11%
- Cash-on-cash
- 31.48%
- DSCR
- 2.40
- GRM
- 4.2
CMA / ARV
- ARV (median comp)
- $165,091
- List price
- $60,000
- Delta
- -63.66%
- Verdict
- UNDERPRICED
- Comps
- 20 within 1.0 mi
Projected returns pro-forma
-3.0% appreciation · 3.0% rent growth · sell at horizon
- IRR
- 26.4%
- Equity multiple
- 2.10×
- Total profit
- $18,421
- Equity at exit
- $8,946
- IRR
- 34.1%
- Equity multiple
- 4.12×
- Total profit
- $52,479
- Equity at exit
- $5,188
Cash invested: $16,800 (down + closing). Projections, not guarantees.
Landlord ↔ Tenant lean methodology
- Overall (STATE)
- 43 Moderately Tenant-Leaning
- State Illinois
- 43 Moderately Tenant-Leaning · D+7
- County
- — inherits STATE
- City
- — inherits STATE
ZIP-level market 61745
- Home prices YoY
- -25.1%
- Active inventory
- 8
- Price-to-rent
- 4.2×
Monthly cashflow live
- Estimated rent
- $1,194 medium interval (Pro) →
- Mortgage (P&I)
- −$315
- Tax from tax record
- −$163 /mo · $1,955/yr
- Insurance
- −$25
- HOA
- −$0
- Vacancy / Maint / Mgmt
- −$251
- Net cashflow
- $441
Break-even live
Sensitivity live
| Price | -10% $475 | -5% $458 | +0% $441 | +5% $424 | +10% $407 |
|---|---|---|---|---|---|
| Rent | -10% $346 | -5% $394 | +0% $441 | +5% $488 | +10% $535 |
| Rate | -1.0pp $471 | -0.5pp $456 | base $441 | +0.5pp $425 | +1.0pp $409 |
UW: 25.0% down · 7.5% · 30yr · 1.5% tax · 5.0% vac · 8.0% maint · 8.0% mgmt
Financing live
Cash to close
- Down payment
- $15,000
- Closing costs
- $1,800
- Reserves months
- —
- Total cash needed
- —
Loan-product check · same deal, 3 products live
Conventional
25% down · 7.5% · 30yr
- Down + closing
- —
- Monthly P&I
- —
- Monthly cashflow
- —
- DSCR
- —
- Eligible?
- —
Personal DTI + credit; lowest rate.
DSCR
20% down · 8.5% · 30yr
- Down + closing
- —
- Monthly P&I
- —
- Monthly cashflow
- —
- DSCR
- —
- Eligible?
- —
No personal income docs; deal must DSCR.
Hard money
10% down · 12.0% · 12mo
- Down + closing
- —
- Monthly P&I
- —
- Monthly cashflow
- —
- DSCR
- —
- Eligible?
- —
Short-term bridge; refi at stabilization.
Listing history 16 events
-
2026-06-21days on market $60,000 Active 38 DOM
-
2026-06-18days on market $60,000 Active 36 DOM
-
2026-06-17days on market $60,000 Active 35 DOM
-
2026-06-16days on market $60,000 Active 34 DOM
-
2026-06-15days on market $60,000 Active 33 DOM
-
2026-06-13days on market $60,000 Active 31 DOM
-
2026-06-12days on market $60,000 Active 30 DOM
-
2026-06-09days on market $60,000 Active 27 DOM
-
2026-06-08days on market $60,000 Active 26 DOM
-
2026-06-07days on market $60,000 Active 25 DOM
-
2026-06-04days on market $60,000 Active 21 DOM
-
2026-06-02days on market $60,000 Active 20 DOM
-
2026-06-01days on market $60,000 Active 19 DOM
-
2026-05-31days on market $60,000 Active 18 DOM
-
2026-05-31days on market $60,000 Active 17 DOM
-
2026-05-13$60,000 Active 893-char remark
ⓘ Source: listings_history table (triggers on properties + properties_extension) + one-shot
backfill from property_details.listing_events for pre-trigger history.
Tax reassessment forecast IL · Partial reset (capped growth)
- Current annual tax
- $1,955 · $163/mo
- Projected year-2 tax
- $1,955 · $163/mo
- Expected delta
- $0/yr ($0/mo · -0.0%)
ⓘ Screening estimate from a state-policy table — verify with the county assessor before closing.
Climate risk First Street
- Flood 1/10 Low FEMA zone X (unshaded) · 0% chance over 30 yrs
- Wildfire 1/10 Low
- Heat 3/10 Moderate 7 d/yr ≥104°F today · 18 d/yr by 30 yrs out
- Wind 2/10 Low 2% chance of damaging wind over 30 yrs
- Air quality 2/10 Low 1 unhealthy d/yr today · 1 by 30 yrs out
Nearby sold comps map
Loading sold comps map…
Walkable amenities ~0.75 mi
Loading nearby amenities…
Taxation est. · year 1
- Rental income
- $14,329
- − Mortgage interest
- −$3,361
- − Property taxes
- −$1,955
- − Insurance
- −$300
- − Repairs & maintenance
- −$1,146
- − Management
- −$1,146
- − Depreciation
- −$1,745
- Taxable income
- $4,675
- Est. tax owed @ 24.0%
- −$1,122
- After-tax cash flow
- $4,167/yr
For passive investors: Depreciation is non-cash, so a rental often shows a tax loss while cash-flowing — sheltering income. Rental losses are passive: they offset passive income freely, and up to $25,000/yr can offset ordinary (W-2) income if you actively participate and your MAGI is under $100k (phasing out to $0 by $150k); unused losses carry forward. On sale, claimed depreciation is recaptured at up to 25%, and gains may owe capital-gains tax (a 1031 exchange can defer both). Figures are a year-1 estimate at your 24.0% rate — not tax advice; consult a CPA.
Condition & rehab AI · 3 photos
This property requires extensive renovation, including new siding and roof, to become move-in ready. Significant potential exists for increasing its value through thorough updates.
Repairs flagged
- Major siding — Severe weathering
- Major roof — Signs of wear
Value-add opportunities
- Both New siding and roof — Both improve aesthetics and functionality
- Both Interior updates — Enhances living space and appeal
- Both Landscaping — Enhances curb appeal and property value
Renovation cost estimate screening
| Repair item | Severity | Est. cost |
|---|---|---|
| siding · Severe weathering | Major | $15,000–50,000 |
| roof · Signs of wear | Major | $15,000–50,000 |
| Total estimated repair cost · 2 items | $30,000–100,000 |
Value-add ROI direction
- Both New siding and roof — Both improve aesthetics and functionality ↑
- Both Interior updates — Enhances living space and appeal ↑
- Both Landscaping — Enhances curb appeal and property value ↑
ⓘ Cost ranges are severity-bucket heuristics (US national rule-of-thumb). Get contractor quotes + a written scope before underwriting a rehab budget.
Schools (NCES district)
- District
- Heyworth CUSD 4
- NCES district ID
- 1718870
- Math proficiency
- 28% ▼ -9.00%
- Reading proficiency
- 35% ▼ -6.00%
- Median HH income
- $72,799
- Composite
- 29.61/100
- National rank
- #6473
- State rank
- #204 of 620 in IL
Livability — Heyworth
- Score
- 70/100
- State rank
- #382
- US rank
- #7974
Category grades
Schools grade is shown separately in the Schools card above.
Census & demographics
- Census place
- Heyworth, IL
- City population
- 4,506
- Population (ZIP)
- 4,506
Population outlook (McLean County) Hauer SSP2
- Today (2025)
- 176,468 people
- By 2030
- 178,002 · +0.9%
- By 2040
- 178,592 · +1.2%
- By 2050
- 177,090 · +0.4%
- By 2075
- 173,224 · -1.8%
- By 2100
- 158,425 · -10.2%
Race, ethnicity, and origin ACS 2023
- Neighborhood character
- Predominantly White (88%)
- Race & ethnicity
- White 88% Hispanic / Latino 8% Two or more races 4%
- Hispanic origin (detail)
- Mexican 8%
- Common ancestry
- Romanian 3% Iranian 1% Italian 1%
- Foreign-born
- 1% · Canada, China
- Languages at home
- 98% English-only · Spanish 2%
Political lean MEDSL · McLean
- 2024 margin
- Toss-up / Even · D 51.6% · R 46.8% · Other 1.6%
- 2008→2024 swing
- +3.7pp toward D · 2008: 1.2pp · 2024: 4.9pp
- All cycles
- 2024: D+4.9 2020: D+3.9 2016: R+1.5 2012: R+11.1 2008: D+1.2
Not yet ingested
- Civics
- —
Market trends
- HPI YoY
- ▼ -60.21%
- Current HPI
- 180.1597
- Rent YoY
- —
- Metro
- —
- State GDP YoY
- ▲ 1.59%
- F500 in state
- 60
Industry mix (Fortune 500 HQ in IL)
| Industry | F500 HQs | Revenue |
|---|---|---|
| Insurance | 4 | $201B |
|
||
| Consumer Goods | 4 | $87B |
|
||
| Industrial Machinery | 3 | $64B |
|
||
| Healthcare | 2 | $55B |
|
||
| Retail / Pharmacy | 1 | $148B |
|
||
| Agriculture / Food | 1 | $86B |
|
||
Price history
1 event — show timeline
- 2026-05-13 Listed $60,000 MRED as Distributed by MLS Grid
Property tax history
+3.0%/yrLatest (2024): $1,955 · +8.2% YoY. Source: county tax records.
Cash-flow waterfall
monthlySold comps — $/sqft
last 12 mo · ≤1 miLoading sold comps…