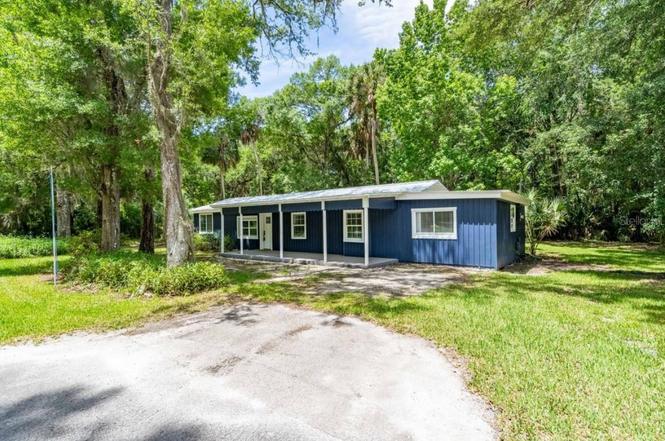
5360 S Elm Ave · Homosassa, FL
Flood risk 10/10 · Severe
- FEMA flood zone
- AE
- Chance of flooding over 30 yrs
- 0.99%
- Est. flood insurance / yr
- $1,737 – $8,500
Fire risk 3/10 · Minor
- Est. fire insurance / yr
- $947 – $1,759
Heat risk 9/10 · Severe
- Hot days now (above 110°F)
- 7 days/yr
- Hot days in 30 yrs
- 25 days/yr
Wind risk 9/10 · Severe
- Chance of severe wind over 30 yrs
- 99.0%
Air-quality risk 1/10 · Minimal
- Unhealthy air days now
- 0 days/yr
- Unhealthy air days in 30 yrs
- 0 days/yr
Risk factors via First Street. Map © Google.
Why this score? — see what drove the B- grade
The composite is a weighted blend of 9 inputs, each scored 0–100. Each bar is that input's sub-score; the figure is the points it added to the 100-point composite (weight × sub-score).
- Cash flow +30.0/30.0
- 1% rule +10.0/10.0
- DSCR +10.0/10.0
- ARV discount +7.5/15.0
- Schools +4.1/10.0
- Livability +3.1/5.0
- Rent growth +2.5/5.0
- Condition / age +2.5/5.0
- Appreciation +0.0/10.0
$169,900
🖨 Deal sheet (PDF) 📄 Offer letter ✓ Due diligence
Listing remarks
Short Sale. Charming 3 bed, 2 bath ranch-style home situated on a spacious lot in the heart of Homosassa. The property was flooded during a 2024 hurricane but was quickly gutted, and a full remodel was started. Many cosmetic upgrades have already been completed, however, the renovation is not yet finished, offering a great opportunity for someone to add their final touches. The home is on septic and county water, with no HOA or deed restrictions. Just minutes from the Homosassa River, this property has excellent potential as a short-term rental on Airbnb or VRBO.
Key facts
- Full remodel started
- Spacious lot
- No hoa
Tags
Property features AI
Finance
- Other: Approximately 0.3 acre lot (about 1/4 to less than 1/2 acre)
Exterior
- Parking: Paved road access
- Utilities: Public water; Septic tank sewer; Electricity connected; Water connected; Sewer connected
- Home design: Single-family residence; One level; Faces east
- Construction: Vinyl siding on frame construction; Metal roof; Slab foundation; Built on one level
- Exterior features: Covered, enclosed and screened rear patio/porch; Patio; Rear porch
Interior
- Kitchen: No appliances included
- Bedrooms: 3 bedrooms
- Flooring: Vinyl flooring
- Bathrooms: 2 full bathrooms
- Heating & cooling: Central heating (electric); Central air conditioning
- Interior features: Open floorplan
- Laundry & utility: Inside laundry in a laundry closet
Neighborhood map
What this means for you Summary
Snapshot
- This is a 3-bed/2.0-bath single-family listed at $170k.
Deal economics
- At list price, monthly cash flow is $649 ($8k/yr) — positive.
- The deal already cash-flows at list — no discount required.
- Meets the 1% rule at list price ($3k rent vs $170k).
- Recommended offer: $150k (12.0% below list) — sets the bar for market timing.
- Cap rate 13.9% vs local median 1.8% in Homosassa — top-decile yield for the area; either an underpriced asset or a hidden risk that comps aren't pricing in. Stress-test before assuming the spread holds.
Location & tenants
- Location reads 62/100 on livability (#749 in FL) — a middle-class / working-renter tenant base. Strengths: crime A+; Watch: health & safety C-, employment D+, amenities F.
- Citrus (rural): math 49% / reading 50% proficiency, ranked #44 of 73 in FL (top 60%) — families likely to look elsewhere, expect single-tenant / working-renter base with shorter leases.
- Zoned schools: Homosassa Elementary School (math 62% / reading 47%, grade C, #892 of 2,144 statewide, top 44%, 411 students, 78% FRL); Crystal River Middle School (math 49% / reading 47%, grade C-, #286 of 571 statewide, top 50%, 900 students, 64% FRL); Crystal River High School (math 31% / reading 44%, grade F, #336 of 667 statewide, top 51%, 1,249 students, 56% FRL).
- Market conditions: 311 active listings in the ZIP; 6 comparable units currently listed for rent nearby; rentals at typical pace (median 23d on market — plan ~3-4 weeks tenant-placement turnaround); 2,443 units permitted in Citrus County in 2024 (0 in 5+ unit buildings).
Forward outlook
- Local home prices are declining (-3.0%/yr); year-one equity from $1k of loan paydown is wiped out by about $5k of value loss. Plan a longer hold.
- Citrus County population projected to shrink 10% by 2050 — rents likely to lag national; underwrite the cash flow, not the appreciation.
- At projected returns (-3.0% appreciation + 3.0% rent growth), your $48k cash investment doubles in ~8 years — after that, you're playing with house money.
Negotiation context
- It's been on market 246 days — a 12% lower offer ($150k) is reasonable based on typical stale-listing flexibility.
- 6 sale attempts since 16y ago; this cycle's ask has dropped $49k (22%) from the opening price — seller is motivated, your offer sets the floor, not the list.
- Current owner paid $62k; list at $170k implies a 172% gain — meaningful room to come down on a strong offer.
Risks & watch-outs
- Watch-outs: flood insurance adds $427/mo.
- Climate carrying-cost: in FEMA flood zone AE (mandatory federal flood insurance); severe wind risk, 99% chance of damaging wind over 30y; extreme-heat days projected 7→25/yr by 2055 (HVAC capex compounding) — expect insurance premiums to compound above CPI over the hold.
Questions for the listing agent
- It's been on market 246 days. Have you received any prior offers? Is the seller open to a 12% concession, seller financing, or rate buy-down credit?
- Built in 1965 — when were the roof, HVAC, electrical panel, plumbing, and water heater last replaced?
- What's the actual annual flood-insurance premium (NFIP or private), and is the property in a SFHA with mandatory coverage?
- Why hasn't it sold? Are there any deal-killer items the seller is aware of (foundation, flood, title, zoning, code violations)?
- Is there a deadline driving the sale (1031 exchange, divorce, estate, relocation)? That informs how much negotiation room exists.
- What's the average days-on-market for RENTAL listings here right now (not sales)? A rising rental-DOM trend means longer vacancies and softer asking-rent achievability than the comps imply.
- What's the recent tenant-quality profile in this submarket — average credit score on applications, eviction rate, late-payment / NSF rate, and stable-employment percentage? A property-management company in the area should have these aggregated.
- How much new for-sale + rental construction is in the pipeline within 1–3 miles? Heavy new supply typically softens prices + rents 12–24 months out; constrained supply supports both.
Investment metrics
- 1% rule
- 1.66% ✓
- Cap rate
- 13.89%
- Cash-on-cash
- 27.12%
- DSCR
- 2.21
- GRM
- 5.0
CMA / ARV
- ARV (on-the-fly)
- $51,480
- Comps found
- 1
Show comp detail 1 sale within ~0.75 mi
| Address | Dist | Beds/Ba | Sqft | Sold | Price | $/sf | Match |
|---|---|---|---|---|---|---|---|
| 10840 W Palmetto St | 0.65mi | 3/1.0 | 1,282 (-3%) | 7mo | $50,000 | $39 | 55 |
Match score weights: distance 35% · size 25% · config 20% · recency 20%. Top-matched comps best support the ARV.
Projected returns pro-forma
-3.0% appreciation · 3.0% rent growth · sell at horizon
- IRR
- 7.6%
- Equity multiple
- 1.30×
- Total profit
- $14,082
- Equity at exit
- $25,333
- IRR
- 17.0%
- Equity multiple
- 2.40×
- Total profit
- $66,665
- Equity at exit
- $14,690
Cash invested: $47,572 (down + closing). Projections, not guarantees.
Landlord ↔ Tenant lean methodology
- Overall (STATE)
- 87 Strongly Landlord-Friendly
- State Florida
- 87 Strongly Landlord-Friendly · R+3
- County
- — inherits STATE
- City
- — inherits STATE
ZIP-level market 34448
- Home prices YoY
- -26.1%
- Active inventory
- 311
- Price-to-rent
- 5.0×
Monthly cashflow live
- Estimated rent
- $2,828 high interval (Pro) →
- Mortgage (P&I)
- −$891
- Tax from tax record
- −$197 /mo · $2,365/yr
- Insurance
- −$71
- Flood insurance flood zone
- −$427 /mo · $5,118/yr
- HOA
- −$0
- Vacancy / Maint / Mgmt
- −$594
- Net cashflow
- $649
Break-even live
Sensitivity live
| Price | -10% $745 | -5% $697 | +0% $649 | +5% $601 | +10% $553 |
|---|---|---|---|---|---|
| Rent | -10% $425 | -5% $537 | +0% $649 | +5% $760 | +10% $872 |
| Rate | -1.0pp $734 | -0.5pp $692 | base $649 | +0.5pp $605 | +1.0pp $560 |
UW: 25.0% down · 7.5% · 30yr · 1.5% tax · 5.0% vac · 8.0% maint · 8.0% mgmt
Financing live
Cash to close
- Down payment
- $42,475
- Closing costs
- $5,097
- Reserves months
- —
- Total cash needed
- —
Loan-product check · same deal, 3 products live
Conventional
25% down · 7.5% · 30yr
- Down + closing
- —
- Monthly P&I
- —
- Monthly cashflow
- —
- DSCR
- —
- Eligible?
- —
Personal DTI + credit; lowest rate.
DSCR
20% down · 8.5% · 30yr
- Down + closing
- —
- Monthly P&I
- —
- Monthly cashflow
- —
- DSCR
- —
- Eligible?
- —
No personal income docs; deal must DSCR.
Hard money
10% down · 12.0% · 12mo
- Down + closing
- —
- Monthly P&I
- —
- Monthly cashflow
- —
- DSCR
- —
- Eligible?
- —
Short-term bridge; refi at stabilization.
Rent comps 6 comps
| Address | Beds | Baths | Sqft | Rent | $/sqft | DOM | Units | Dist |
|---|---|---|---|---|---|---|---|---|
| 5111 S Gray Pelican Way Unit 5111 Homosassa, FL | 2.0 | 2.0 | 1543 | $3,200 | $2.07 | 23d | 1 | 0.94mi |
| 11445 W Riverhaven Dr Homosassa, FL | 2.0 | 2.0 | 1493 | $2,900 | $1.94 | 23d | 1 | 1.20mi |
| 11459 W Riverhaven Dr Homosassa, FL | 2.0 | 2.0 | 1699 | $3,000 | $1.77 | 23d | 1 | 1.22mi |
| 11481 W Riverhaven Dr Homosassa, FL | 2.0 | 2.0 | 1149 | $3,000 | $2.61 | 23d | 1 | 1.23mi |
| 5230 S View Pt Homosassa, FL | 2.0 | 2.0 | 1149 | $2,800 | $2.44 | 23d | 1 | 1.27mi |
| 11643 W Riverhaven Dr Homosassa, FL | 3.0 | 2.5 | 1821 | $2,900 | $1.59 | 23d | 1 | 1.43mi |
Listing history 43 events
-
2026-06-21days on market $169,900 Active 246 DOM
-
2026-06-19days on market $169,900 Active 244 DOM
-
2026-06-18days on market $169,900 Active 243 DOM
-
2026-06-17days on market $169,900 Active 242 DOM
-
2026-06-16days on market $169,900 Active 241 DOM
-
2026-06-15days on market $169,900 Active 240 DOM
-
2026-06-14days on market $169,900 Active 238 DOM
-
2026-06-13days on market $169,900 Active 237 DOM
-
2026-06-09days on market $169,900 Active 234 DOM
-
2026-06-08days on market $169,900 Active 233 DOM
-
2026-06-03days on market $169,900 Active 228 DOM
-
2026-06-02days on market $169,900 Active 227 DOM
-
2026-06-01days on market $169,900 Active 226 DOM
-
2026-05-31days on market $169,900 Active 225 DOM
-
2026-05-30days on market $169,900 Active 224 DOM
-
2026-05-19price $169,900
-
2026-01-27price $179,900
-
2026-01-07status Active
-
2025-09-08price $209,900
-
2025-08-13price $218,500
-
2025-07-31$219,000 Active
-
2024-09-06historical
-
2024-08-21price $229,900
-
2024-08-21price $229,900
-
2024-08-01price $239,900
-
2024-08-01price $239,900
-
2024-07-29$249,000 Active
-
2024-07-11price $249,000
-
2024-06-14price $259,000
-
2024-04-14historical
-
2024-04-03price $269,000
-
2024-04-03price $269,000
-
2024-03-21price $279,000
-
2024-03-21price $279,000
-
2024-02-02price $289,000
-
2024-01-18$299,000 Active
-
2019-09-25historical
-
2019-08-07$144,900
-
2019-04-24soldstatus $62,500
-
2010-03-17soldstatus $72,000
-
2010-03-03soldstatus $72,000
-
2010-01-12$78,500
-
2005-06-17soldstatus $45,000
ⓘ Source: listings_history table (triggers on properties + properties_extension) + one-shot
backfill from property_details.listing_events for pre-trigger history.
Tax reassessment forecast FL · Resets to sale price
- Current annual tax
- $2,365 · $197/mo
- Projected year-2 tax
- $2,365 · $197/mo
- Expected delta
- $0/yr ($0/mo · 0.0%)
ⓘ Screening estimate from a state-policy table — verify with the county assessor before closing.
Climate risk First Street
- Flood 10/10 Extreme FEMA zone AE · 99% chance over 30 yrs
- Wildfire 3/10 Moderate
- Heat 9/10 Extreme 7 d/yr ≥110°F today · 25 d/yr by 30 yrs out
- Wind 9/10 Extreme 99% chance of damaging wind over 30 yrs
- Air quality 1/10 Low 0 unhealthy d/yr today · 0 by 30 yrs out
Nearby sold comps map
Loading sold comps map…
Walkable amenities ~0.75 mi
Loading nearby amenities…
Taxation est. · year 1
- Rental income
- $33,936
- − Mortgage interest
- −$9,517
- − Property taxes
- −$2,365
- − Insurance
- −$5,968
- − Repairs & maintenance
- −$2,715
- − Management
- −$2,715
- − Depreciation
- −$4,943
- Taxable income
- $5,714
- Est. tax owed @ 24.0%
- −$1,371
- After-tax cash flow
- $6,413/yr
For passive investors: Depreciation is non-cash, so a rental often shows a tax loss while cash-flowing — sheltering income. Rental losses are passive: they offset passive income freely, and up to $25,000/yr can offset ordinary (W-2) income if you actively participate and your MAGI is under $100k (phasing out to $0 by $150k); unused losses carry forward. On sale, claimed depreciation is recaptured at up to 25%, and gains may owe capital-gains tax (a 1031 exchange can defer both). Figures are a year-1 estimate at your 24.0% rate — not tax advice; consult a CPA.
Schools (NCES district)
- District
- Citrus
- NCES district ID
- 1200270
- Math proficiency
- 49% ▼ -10.00%
- Reading proficiency
- 50% ▼ -6.00%
- Median HH income
- $38,618
- Composite
- 41.28/100
- National rank
- #3519
- State rank
- #44 of 73 in FL
Livability — Homosassa
- Score
- 62/100
- State rank
- #749
- US rank
- #16240
Category grades
Schools grade is shown separately in the Schools card above.
Census & demographics
- Census place
- Homosassa, FL
- County
- Citrus County · 111,314 people
- City population
- 29,919
- Metro
- Homosassa Springs, FL
- Population (ZIP)
- 10,817
- Household income
- $45,916
- Rent vs Own
- Severe rent burden
- 113.0
Population outlook (Citrus County) Hauer SSP2
- Today (2025)
- 138,622 people
- By 2030
- 136,886 · -1.3%
- By 2040
- 132,009 · -4.8%
- By 2050
- 125,196 · -9.7%
- By 2075
- 108,570 · -21.7%
- By 2100
- 84,454 · -39.1%
Race, ethnicity, and origin ACS 2023
- Neighborhood character
- Predominantly White (94%)
- Race & ethnicity
- White 94% Two or more races 3% Hispanic / Latino 3% Black 1%
- Common ancestry
- Slovak 3% Scotch-Irish 2% Lithuanian 2%
- Foreign-born
- 2% · Canada
- Languages at home
- 96% English-only · Spanish 2% Russian/Polish/Slavic 1%
Political lean MEDSL · Citrus
- 2024 margin
- Solid R (+45.9) · D 26.8% · R 72.6%
- 2008→2024 swing
- -29.8pp toward R · 2008: -16.1pp · 2024: -45.9pp
- All cycles
- 2024: R+45.9 2020: R+41.0 2016: R+39.7 2012: R+21.9 2008: R+16.1
Not yet ingested
- Civics
- —
Market trends
- HPI YoY
- ▼ -110.27%
- Current HPI
- 312.4302
- Rent YoY
- —
- Metro
- Homosassa Springs, FL
- State GDP YoY
- ▲ 3.28%
- F500 in state
- 36
Industry mix (Fortune 500 HQ in FL)
| Industry | F500 HQs | Revenue |
|---|---|---|
| Industrial Technology | 2 | $29B |
|
||
| Insurance | 2 | $17B |
|
||
| Retail | 1 | $60B |
|
||
| Technology Distribution | 1 | $58B |
|
||
| Homebuilding | 1 | $35B |
|
||
| Technology Manufacturing | 1 | $35B |
|
||
Price history
+277.6% since first listed28 events — show timeline
- 2026-05-19 Price Changed $169,900 Stellar MLS as Distributed by MLS Grid
- 2026-01-27 Price Changed $179,900 Stellar MLS as Distributed by MLS Grid
- 2026-01-07 Relisted — Stellar MLS as Distributed by MLS Grid
- 2025-09-08 Price Changed $209,900 Stellar MLS as Distributed by MLS Grid
- 2025-08-13 Price Changed $218,500 Stellar MLS as Distributed by MLS Grid
- 2025-07-31 Listed $219,000 Stellar MLS as Distributed by MLS Grid
- 2024-09-06 Listing Removed — Stellar MLS as Distributed by MLS Grid
- 2024-08-21 Price Changed $229,900 RACC
- 2024-08-21 Price Changed $229,900 Stellar MLS as Distributed by MLS Grid
- 2024-08-01 Price Changed $239,900 RACC
- 2024-08-01 Price Changed $239,900 Stellar MLS as Distributed by MLS Grid
- 2024-07-29 Listed $249,000 Stellar MLS as Distributed by MLS Grid
- 2024-07-11 Price Changed $249,000 RACC
- 2024-06-14 Price Changed $259,000 RACC
- 2024-04-14 Listing Removed — Stellar MLS as Distributed by MLS Grid
- 2024-04-03 Price Changed $269,000 RACC
- 2024-04-03 Price Changed $269,000 Stellar MLS as Distributed by MLS Grid
- 2024-03-21 Price Changed $279,000 RACC
- 2024-03-21 Price Changed $279,000 Stellar MLS as Distributed by MLS Grid
- 2024-02-02 Price Changed $289,000 Stellar MLS as Distributed by MLS Grid
- 2024-01-18 Listed $299,000 Stellar MLS as Distributed by MLS Grid
- 2019-09-25 Listing Removed — Stellar MLS as Distributed by MLS Grid
- 2019-08-07 Listed $144,900 Stellar MLS as Distributed by MLS Grid
- 2019-04-24 Sold (Public Records) $62,500 Public Records
- 2010-03-17 Sold (Public Records) $72,000 Public Records
- 2010-03-03 Sold (MLS) $72,000 RACC
- 2010-01-12 Listed $78,500 RACC
- 2005-06-17 Sold (Public Records) $45,000 Public Records
Property tax history
+15.5%/yrLatest (2025): $2,365 · -2.5% YoY. Source: county tax records.
Cash-flow waterfall
monthlySold comps — $/sqft
last 12 mo · ≤1 miLoading sold comps…