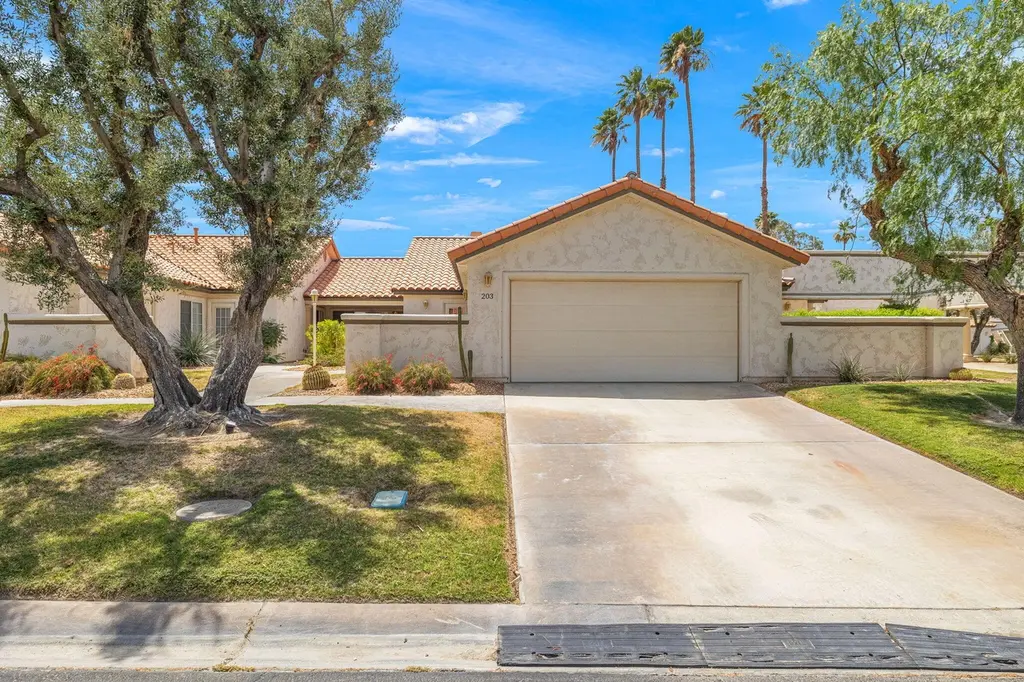
203 Desert Falls Dr E · Palm Desert, CA
Flood risk 1/10 · Minimal
- FEMA flood zone
- X (unshaded)
- Chance of flooding over 30 yrs
- 0.0%
- Est. flood insurance / yr
- $507 – $1,088
Fire risk 4/10 · Minor
- Est. fire insurance / yr
- $659 – $1,223
Heat risk 9/10 · Severe
- Hot days now (above 114°F)
- 5 days/yr
- Hot days in 30 yrs
- 14 days/yr
Wind risk 1/10 · Minimal
- Chance of severe wind over 30 yrs
- —
Air-quality risk 4/10 · Minor
- Unhealthy air days now
- 5 days/yr
- Unhealthy air days in 30 yrs
- 7 days/yr
Risk factors via First Street. Map © Google.
Why this score? — see what drove the C grade
The composite is a weighted blend of 9 inputs, each scored 0–100. Each bar is that input's sub-score; the figure is the points it added to the 100-point composite (weight × sub-score).
- Cash flow +24.4/30.0
- 1% rule +8.9/10.0
- DSCR +7.9/10.0
- ARV discount +7.5/15.0
- Schools +3.8/10.0
- Livability +2.6/5.0
- Condition / age +2.5/5.0
- Rent growth +2.4/5.0
- Appreciation +0.0/10.0
$350,000
🖨 Deal sheet (PDF) 📄 Offer letter ✓ Due diligence
Listing remarks
Single Story unit!!!! Welcome to 203 Desert Falls Drive E, a beautifully maintained turnkey furnished 2 bedroom, 2 bathroom condo located inside the highly desirable Desert Falls Country Club in Palm Desert. Priced at only $350,000, this home offers an incredible opportunity for a full-time residence, seasonal getaway, or investment property. This light and bright condo features an open floor plan, spacious living areas, and move-in ready furnishings, allowing the next owner to immediately enjoy the desert lifestyle or begin generating rental income. Desert Falls Country Club allows short-term rentals, making this an attractive opportunity for investors seeking STR potential in a prime Palm
Key facts
- Gated community
- Turnkey furnished
- Centrally located
Tags
Property features AI
Finance
- Other: Short-term rentals allowed; Listing terms include Conventional, Fannie Mae, FHA, and Cash; CC&R disclosures
- HOA & community: Monthly HOA fee of $871; HOA covers building & grounds, utilities, trash, sewer, security, insurance, cable TV, clubhouse; Community amenities include clubhouse, fitness center, banquet facilities, recreation room, tennis courts, sport court, paddle tennis, pickleball courts, guest parking, golf course and lake/pond; development has golf course
Exterior
- Parking: Attached garage with 2 spaces; 2 total parking spaces; Driveway parking; On-street parking
- Security: Gated community with 24-hour security
- Utilities: Sewer: in-street paid; Cable TV available
- Home design: Condominium, attached; Single-story (ground level, no unit above)
- Construction: Clay tile roof; Year built: other source
- Exterior features: Clay tile roof; Concrete slab patio; Built-in gas BBQ; Sprinkler system and drip irrigation; Community pool (in-ground); Community heated spa (in-ground); Mountain views; Fee simple land
Interior
- Kitchen: Granite counters; Gas cooktop; Gas range; Microwave; Refrigerator; Dishwasher
- Flooring: Carpet; Ceramic tile
- Bathrooms: 2 full bathrooms
- Heating & cooling: Central heating; Air conditioning
- Interior features: Ground-level no-step entry; Fully furnished; Living room with gas-log fireplace (1)
- Laundry & utility: Washer; Dryer; Laundry in a dedicated room
Neighborhood map
What this means for you Summary
Snapshot
- This is a 2-bed/2.0-bath condo listed at $350k.
Deal economics
- At list price, monthly cash flow is $709 ($9k/yr) — positive.
- The deal already cash-flows at list — no discount required.
- Meets the 1% rule at list price ($5k rent vs $350k).
- Recommended offer: $345k (1.5% below list) — sets the bar for market timing.
- Cap rate 8.7% vs local median 3.4% in Palm Desert — top-decile yield for the area; either an underpriced asset or a hidden risk that comps aren't pricing in. Stress-test before assuming the spread holds.
Location & tenants
- Location reads 51/100 on livability (#1,050 in CA) — a working-class tenant base; expect higher turnover. Strengths: employment B+, housing B; Watch: crime D, amenities F, commute F.
- Desert Sands Unified (suburban): math 31% / reading 56% proficiency, ranked #199 of 517 in CA (top 38%) — families likely to look elsewhere, expect single-tenant / working-renter base with shorter leases.
- Zoned schools: James Earl Carter Elementary (516 students, 53% FRL); Colonel Mitchell Paige Middle (math 10% / reading 10%, grade F, #474 of 498 statewide, top 99%, 436 students, 74% FRL); Palm Desert High (math 42% / reading 67%, grade C-, #256 of 1,170 statewide, top 24%, 2,050 students, 57% FRL).
- Market conditions: Rents soft (-0.3%/yr); 636 active listings in the ZIP; 40 comparable units currently listed for rent nearby; rentals lingering (median 46d on market — plan ~5-8 weeks vacancy on turnover, expect pricing pressure); 78% of comp listings sitting > 30 days — soft ceiling on asking rent; solid renter incomes; 9,195 units permitted in Riverside County in 2024 (1,512 in 5+ unit buildings).
- At $4,859/mo this rent would consume 66% of the median local household income ($88k/yr) (locally 1181% of renters already pay >50% of income on rent) — very limited rent-growth headroom before tenants either downsize or default.
Forward outlook
- Local home prices are declining (-3.0%/yr); year-one equity from $2k of loan paydown is wiped out by about $10k of value loss. Plan a longer hold.
- Riverside County population projected at +22% by 2050 — long-run rental-demand tailwind backs the buy-and-hold thesis.
Negotiation context
- It's been on market 24 days — a 2% lower offer ($345k) is reasonable based on typical stale-listing flexibility.
- Current owner paid $132k; list at $350k implies a 165% gain — meaningful room to come down on a strong offer.
Risks & watch-outs
- Climate carrying-cost: extreme-heat days projected 5→14/yr by 2055 (HVAC capex compounding) — expect insurance premiums to compound above CPI over the hold.
Questions for the listing agent
- What does the HOA fee cover, when was the last increase, and are there any pending special assessments or reserve-fund shortfalls?
- Any open or pending special assessments — roof, HVAC, plumbing, elevator, façade? What's the per-unit balance and payoff schedule, and is the seller paying it off at close or rolling it to the buyer?
- Is there a deadline driving the sale (1031 exchange, divorce, estate, relocation)? That informs how much negotiation room exists.
- Schools are A-rated — typically a magnet for longer-tenancy family renters. What's the average tenant stay here, and is there a school-zone premium baked into asking?
- Crime grade is D in this area — have there been break-ins, vandalism, or insurance claims at this property in the last 3 years? What carrier currently insures it and at what premium?
- What's the average days-on-market for RENTAL listings here right now (not sales)? A rising rental-DOM trend means longer vacancies and softer asking-rent achievability than the comps imply.
- What's the recent tenant-quality profile in this submarket — average credit score on applications, eviction rate, late-payment / NSF rate, and stable-employment percentage? A property-management company in the area should have these aggregated.
- How much new apartment / multifamily construction is in the pipeline within 1–3 miles? Heavy new supply (>2% of stock underway) typically softens rents 12–24 months out; light construction supports rent growth.
Investment metrics
- 1% rule
- 1.39% ✓
- Cap rate
- 8.72%
- Cash-on-cash
- 8.68%
- DSCR
- 1.39
- GRM
- 6.0
CMA / ARV
No comps found within radius.
Projected returns pro-forma
-3.0% appreciation · 0.0% rent growth · sell at horizon
- IRR
- -7.3%
- Equity multiple
- 0.74×
- Total profit
- $-25,296
- Equity at exit
- $52,186
- IRR
- -3.1%
- Equity multiple
- 0.83×
- Total profit
- $-16,850
- Equity at exit
- $30,262
Cash invested: $98,000 (down + closing). Projections, not guarantees.
Landlord ↔ Tenant lean methodology
- Overall (STATE)
- 18 Strongly Tenant-Friendly
- State California
- 18 Strongly Tenant-Friendly · D+13
- County
- — inherits STATE
- City
- — inherits STATE
ZIP-level market 92211
- Rents YoY
- -0.3%
- Active inventory
- 636
- Price-to-rent
- 6.0×
Monthly cashflow live
- Estimated rent
- $4,859 high interval (Pro) →
- Mortgage (P&I)
- −$1,835
- Tax from tax record
- −$277 /mo · $3,329/yr
- Insurance
- −$146
- HOA
- −$871
- Vacancy / Maint / Mgmt
- −$1,020
- Net cashflow
- $709
Break-even live
Sensitivity live
| Price | -10% $907 | -5% $808 | +0% $709 | +5% $610 | +10% $511 |
|---|---|---|---|---|---|
| Rent | -10% $325 | -5% $517 | +0% $709 | +5% $901 | +10% $1,093 |
| Rate | -1.0pp $885 | -0.5pp $798 | base $709 | +0.5pp $618 | +1.0pp $526 |
UW: 25.0% down · 7.5% · 30yr · 1.5% tax · 5.0% vac · 8.0% maint · 8.0% mgmt
Financing live
Cash to close
- Down payment
- $87,500
- Closing costs
- $10,500
- Reserves months
- —
- Total cash needed
- —
Loan-product check · same deal, 3 products live
Conventional
25% down · 7.5% · 30yr
- Down + closing
- —
- Monthly P&I
- —
- Monthly cashflow
- —
- DSCR
- —
- Eligible?
- —
Personal DTI + credit; lowest rate.
DSCR
20% down · 8.5% · 30yr
- Down + closing
- —
- Monthly P&I
- —
- Monthly cashflow
- —
- DSCR
- —
- Eligible?
- —
No personal income docs; deal must DSCR.
Hard money
10% down · 12.0% · 12mo
- Down + closing
- —
- Monthly P&I
- —
- Monthly cashflow
- —
- DSCR
- —
- Eligible?
- —
Short-term bridge; refi at stabilization.
Rent comps 40 comps
| Address | Beds | Baths | Sqft | Rent | $/sqft | DOM | Units | Dist |
|---|---|---|---|---|---|---|---|---|
| 199 Desert Falls Dr E Palm Desert, CA | 2.0 | 2.0 | 1330 | $6,200 | $4.66 | 45d | 1 | 0.03mi |
| 216 Desert Falls Dr E Palm Desert, CA | 2.0 | 2.0 | 1330 | $3,250 | $2.44 | 45d | 1 | 0.03mi |
| 207 Desert Falls Cir Palm Desert, CA | 2.0 | 2.0 | 1330 | $6,200 | $4.66 | 45d | 1 | 0.04mi |
| 156 Falls Ct Palm Desert, CA | 3.0 | 2.5 | 1814 | $6,000 | $3.31 | 45d | 1 | 0.08mi |
| 189 Desert Falls Cir Palm Desert, CA | 2.0 | 2.5 | 1814 | $6,500 | $3.58 | 45d | 1 | 0.09mi |
| 187 Desert Falls Cir Palm Desert, CA | 3.0 | 2.5 | 1814 | $5,999 | $3.31 | 45d | 1 | 0.09mi |
| 182 Desert Falls Cir Palm Desert, CA | 2.0 | 2.0 | 1330 | $6,200 | $4.66 | 45d | 1 | 0.09mi |
| 139 Villa Ct Palm Desert, CA | 2.0 | 2.0 | 1330 | $6,200 | $4.66 | 45d | 1 | 0.12mi |
| 164 Desert Falls Dr E Palm Desert, CA | 2.0 | 2.0 | 1330 | $3,000 | $2.26 | 45d | 1 | 0.14mi |
| 127 Villa Ct Palm Desert, CA | 2.0 | 2.0 | 1330 | $6,800 | $5.11 | 45d | 1 | 0.15mi |
| 160 Desert Falls Cir Palm Desert, CA | 2.0 | 2.0 | 1330 | $4,000 | $3.01 | 3d | 1 | 0.15mi |
| 272 Desert Falls Dr E Palm Desert, CA | 2.0 | 2.0 | 1330 | $6,250 | $4.70 | 45d | 1 | 0.22mi |
| 136 Desert Falls Dr E Palm Desert, CA | 3.0 | 2.5 | 1814 | $3,200 | $1.76 | 45d | 1 | 0.23mi |
| 221 Vista Royale Cir E Palm Desert, CA | 2.0 | 2.0 | 1360 | $5,900 | $4.34 | 26d | 1 | 0.29mi |
| 221 Vista Royale Cir W Palm Desert, CA | 2.0 | 2.5 | 1360 | $5,900 | $4.34 | 26d | 1 | 0.31mi |
| 38941 Kilimanjaro Dr Palm Desert, CA | 2.0 | 2.0 | 1731 | $7,000 | $4.04 | 45d | 1 | 0.34mi |
| 270 Vista Royale Cir E Palm Desert, CA | 3.0 | 2.5 | 1814 | $3,250 | $1.79 | 45d | 1 | 0.35mi |
| 270 Vista Royale Cir E Palm Desert, CA | 3.0 | 2.5 | 1814 | $3,250 | $1.79 | 7d | 1 | 0.35mi |
| 237 Vista Royale Cir W Palm Desert, CA | 3.0 | 2.5 | 1814 | $6,200 | $3.42 | 45d | 1 | 0.35mi |
| 248 Vista Royale Cir W Palm Desert, CA | 2.0 | 2.0 | 1330 | $4,999 | $3.76 | 45d | 1 | 0.36mi |
| 274 Vista Royale Cir E Palm Desert, CA | 3.0 | 2.5 | 1814 | $2,900 | $1.60 | 26d | 1 | 0.37mi |
| 117 Trento Cir Palm Desert, CA | 2.0 | 2.0 | 1157 | $5,500 | $4.75 | 45d | 1 | 0.38mi |
| 321 Bouquet Canyon Dr Palm Desert, CA | 3.0 | 2.0 | 1818 | $2,995 | $1.65 | 4d | 1 | 0.38mi |
| 116 Avellino Cir Palm Desert, CA | 2.0 | 2.0 | 1426 | $6,200 | $4.35 | 45d | 1 | 0.41mi |
| 259 Vista Royale Cir W Palm Desert, CA | 2.0 | 2.0 | 1330 | $5,600 | $4.21 | 45d | 1 | 0.41mi |
| 319 Vista Royale Dr Palm Desert, CA | 3.0 | 2.5 | 1814 | $2,900 | $1.60 | 45d | 1 | 0.45mi |
| 107 Avellino Cir Palm Desert, CA | 2.0 | 2.0 | 1528 | $5,900 | $3.86 | 45d | 1 | 0.46mi |
| 101 Avellino Cir Palm Desert, CA | 2.0 | 2.0 | 1500 | $3,000 | $2.00 | 23d | 1 | 0.48mi |
| 781 Montana Vista Dr Palm Desert, CA | 2.0 | 2.0 | 1330 | $6,000 | $4.51 | 45d | 1 | 0.48mi |
| 38780 Tandika Trl N Palm Desert, CA | 2.0 | 2.0 | 1815 | $3,900 | $2.15 | 45d | 1 | 0.49mi |
| 100 Brandigo Cir Palm Desert, CA | 2.0 | 2.0 | 1609 | $4,500 | $2.80 | 22d | 1 | 0.50mi |
| 709 Vista Lago Cir N Palm Desert, CA | 2.0 | 2.0 | 1360 | $2,700 | $1.99 | 45d | 1 | 0.50mi |
| 778 Montana Vista Dr Palm Desert, CA | 3.0 | 2.5 | 1814 | $6,500 | $3.58 | 45d | 1 | 0.51mi |
| 39856 Narcissus Way Palm Desert, CA | 1.0 | 2.0 | 1000 | $2,695 | $2.69 | 45d | 1 | 0.53mi |
| 39856 Narcissus Way Palm Desert, CA | 1.0 | 1.5 | 1000 | $2,495 | $2.50 | 26d | 1 | 0.53mi |
| 726 Vista Lago Dr N Palm Desert, CA | 3.0 | 2.5 | 1814 | $4,900 | $2.70 | 45d | 1 | 0.55mi |
| 413 Desert Falls Dr N Palm Desert, CA | 2.0 | 2.0 | 1330 | $6,200 | $4.66 | 45d | 1 | 0.59mi |
| 651 Vista Lago Cir N Palm Desert, CA | 2.0 | 2.0 | 1330 | $5,700 | $4.29 | 45d | 1 | 0.61mi |
| 491 Desert Falls Dr N Palm Desert, CA | 2.0 | 2.0 | 1360 | $6,500 | $4.78 | 45d | 1 | 0.62mi |
| 432 Desert Falls Dr N Palm Desert, CA | 3.0 | 2.5 | 1814 | $4,800 | $2.65 | 45d | 1 | 0.64mi |
HOA detail condo
- Monthly dues
- $871 · $10,452/yr
- Assessments
- None detected in remarks — confirm with the listing agent.
Listing history 16 events
-
2026-06-21statusdays on market $350,000 Pending 24 DOM
-
2026-06-18days on market $350,000 Active 22 DOM
-
2026-06-17days on market $350,000 Active 21 DOM
-
2026-06-16days on market $350,000 Active 20 DOM
-
2026-06-15days on market $350,000 Active 19 DOM
-
2026-06-13days on market $350,000 Active 17 DOM
-
2026-06-09days on market $350,000 Active 13 DOM
-
2026-06-08days on market $350,000 Active 12 DOM
-
2026-06-07days on market $350,000 Active 11 DOM
-
2026-06-04days on market $350,000 Active 8 DOM
-
2026-06-03days on market $350,000 Active 7 DOM
-
2026-06-02days on market $350,000 Active 6 DOM
-
2026-06-01days on market $350,000 Active 5 DOM
-
2026-05-31days on market $350,000 Active 4 DOM
-
2026-05-12$350,000 Active
-
1991-12-09soldstatus $132,000
ⓘ Source: listings_history table (triggers on properties + properties_extension) + one-shot
backfill from property_details.listing_events for pre-trigger history.
Tax reassessment forecast CA · Resets to sale price
- Current annual tax
- $3,329 · $277/mo
- Projected year-2 tax
- $3,329 · $277/mo
- Expected delta
- $0/yr ($0/mo · 0.0%)
ⓘ Screening estimate from a state-policy table — verify with the county assessor before closing.
Climate risk First Street
- Flood 1/10 Low FEMA zone X (unshaded) · 0% chance over 30 yrs
- Wildfire 4/10 Moderate
- Heat 9/10 Extreme 5 d/yr ≥114°F today · 14 d/yr by 30 yrs out
- Wind 1/10 Low
- Air quality 4/10 Moderate 5 unhealthy d/yr today · 7 by 30 yrs out
Nearby sold comps map
Loading sold comps map…
Walkable amenities ~0.75 mi
Loading nearby amenities…
Taxation est. · year 1
- Rental income
- $58,307
- − Mortgage interest
- −$19,605
- − Property taxes
- −$3,329
- − Insurance
- −$1,750
- − Repairs & maintenance
- −$4,665
- − Management
- −$4,665
- − HOA
- −$10,452
- − Depreciation
- −$10,182
- Taxable income
- $3,660
- Est. tax owed @ 24.0%
- −$878
- After-tax cash flow
- $7,628/yr
For passive investors: Depreciation is non-cash, so a rental often shows a tax loss while cash-flowing — sheltering income. Rental losses are passive: they offset passive income freely, and up to $25,000/yr can offset ordinary (W-2) income if you actively participate and your MAGI is under $100k (phasing out to $0 by $150k); unused losses carry forward. On sale, claimed depreciation is recaptured at up to 25%, and gains may owe capital-gains tax (a 1031 exchange can defer both). Figures are a year-1 estimate at your 24.0% rate — not tax advice; consult a CPA.
Schools (NCES district)
- District
- Desert Sands Unified
- NCES district ID
- 0611110
- Math proficiency
- 31% ▼ -4.00%
- Reading proficiency
- 56% ▲ 7.00%
- Median HH income
- $54,957
- Composite
- 37.77/100
- National rank
- #4346
- State rank
- #199 of 517 in CA
Livability — Palm Desert
- Score
- 51/100
- State rank
- #1050
- US rank
- #25164
Category grades
Schools grade is shown separately in the Schools card above.
Census & demographics
- Census place
- Palm Desert, CA
- County
- Riverside County · 2,287,001 people
- City population
- 58,615
- Metro
- Riverside-San Bernardino-Ontario, CA
- Population (ZIP)
- 28,092
- Household income
- $88,477
- Rent vs Own
- Severe rent burden
- 1181.0
Population outlook (Riverside County) Hauer SSP2
- Today (2025)
- 2,664,475 people
- By 2030
- 2,802,692 · +5.2%
- By 2040
- 3,050,904 · +14.5%
- By 2050
- 3,256,783 · +22.2%
- By 2075
- 3,655,058 · +37.2%
- By 2100
- 3,766,594 · +41.4%
Race, ethnicity, and origin ACS 2023
- Neighborhood character
- Predominantly White (75%)
- Race & ethnicity
- White 75% Hispanic / Latino 16% Two or more races 11% Asian 4% Black 3% Native American 1%
- Hispanic origin (detail)
- Mexican 12%
- Common ancestry
- Scotch-Irish 3% Slovak 3% Romanian 3%
- Foreign-born
- 16% · Canada, China
- Languages at home
- 85% English-only · Spanish 9% Other Indo-European 2% Tagalog/Filipino 1%
Political lean MEDSL · Riverside
- 2024 margin
- Toss-up / Even · D 48.0% · R 49.3% · Other 2.6%
- 2008→2024 swing
- -3.6pp toward R · 2008: 2.3pp · 2024: -1.3pp
- All cycles
- 2024: R+1.3 2020: D+8.0 2016: D+4.3 2012: R+0.4 2008: D+2.3
Not yet ingested
- Civics
- —
Market trends
- HPI YoY
- ▼ -166.92%
- Current HPI
- 233.4619
- Rent YoY
- ▼ -0.30%
- Metro
- Riverside-San Bernardino-Ontario, CA
- State GDP YoY
- ▲ 3.21%
- F500 in state
- 116
Industry mix (Fortune 500 HQ in CA)
| Industry | F500 HQs | Revenue |
|---|---|---|
| Technology | 27 | $1,492B |
|
||
| Financial Services | 3 | $174B |
|
||
| Retail | 3 | $44B |
|
||
| Insurance | 3 | $26B |
|
||
| Media / Entertainment | 2 | $115B |
|
||
| Pharmaceuticals / Biotech | 2 | $62B |
|
||
Price history
+165.2% since first listed2 events — show timeline
- 2026-05-12 Listed $350,000 GPSMLS
- 1991-12-09 Sold (Public Records) $132,000 Public Records
Property tax history
+2.5%/yrLatest (2025): $3,329 · +3.3% YoY. Source: county tax records.
Cash-flow waterfall
monthlySold comps — $/sqft
last 12 mo · ≤1 miLoading sold comps…