 Triplex
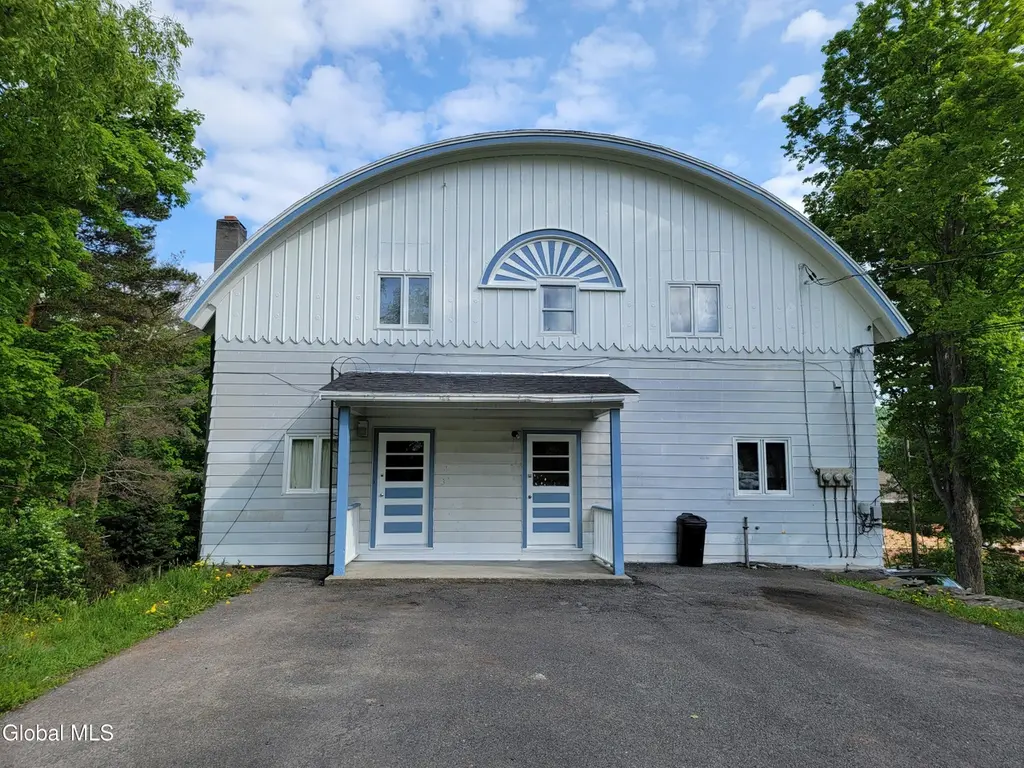
7 Holly Tree Rd · Stamford, NY
Flood risk 1/10 · Minimal
- FEMA flood zone
- X (unshaded)
- Chance of flooding over 30 yrs
- 0.0%
- Est. flood insurance / yr
- $507 – $1,088
Fire risk 2/10 · Minimal
- Est. fire insurance / yr
- $691 – $1,283
Heat risk 1/10 · Minimal
- Hot days now (above 87°F)
- 8 days/yr
- Hot days in 30 yrs
- 19 days/yr
Wind risk 2/10 · Minimal
- Chance of severe wind over 30 yrs
- 2.0%
Air-quality risk 1/10 · Minimal
- Unhealthy air days now
- 0 days/yr
- Unhealthy air days in 30 yrs
- 0 days/yr
Risk factors via First Street. Map © Google.
Why this score? — see what drove the B+ grade
The composite is a weighted blend of 9 inputs, each scored 0–100. Each bar is that input's sub-score; the figure is the points it added to the 100-point composite (weight × sub-score).
- Cash flow +30.0/30.0
- 1% rule +10.0/10.0
- DSCR +10.0/10.0
- Appreciation +7.6/10.0
- ARV discount +7.5/15.0
- Schools +3.4/10.0
- Livability +3.4/5.0
- Rent growth +2.5/5.0
- Condition / age +2.5/5.0
$649,000
🖨 Deal sheet 📄 Offer letter ✓ Due diligence
Multi-family units
County records classify this as Multi-Family (5+ Unit). Listing-text estimate: 3 units. estimate disagrees with records
5+ unit building — per-unit beds/baths from public records are typically unavailable; the breakdown below (if shown) is an estimate from the listing text.
Listing remarks MLS
Excellent Income opportunity. 3 Apartments. 13 Bedrooms 5 Baths. All units have a private entry and use of the yard. Apt 1 is a 4 Bedroom 1 Bath, Apt 2 is a 4 Bedroom 2 Bath, Apt 3 is a 5 Bedroom 2 Bath. Units Fully occupied Generating positive cash flow. All units metered separately. Each tenant has their own heat source. Tenant pays for their own heat and electric. New roof, 2 new furnaces. Landlord takes care of lawn care and snow removal. Room to develop another rental income. Or use for landlord storage. Annual Gross Rent income $60,000. Financial information furnished upon request.
Key facts
- Own heat source
- Use of the yard
- Private entry
Tags
Neighborhood map
What this means for you Summary
Snapshot
- This is a 1×4bd/1ba + 1×4bd/2ba + 1×5bd/2ba units multifamily listed at $649k.
Deal economics
- At list price, monthly cash flow is $4k ($54k/yr) — positive. Per door: $1k/mo.
- The deal already cash-flows at list — no discount required.
- Meets the 1% rule at list price ($11k rent vs $649k).
- Recommended offer: $571k (12.0% below list) — sets the bar for market timing.
- Cap rate 14.6% vs local median 5.3% in Stamford — top-decile yield for the area; either an underpriced asset or a hidden risk that comps aren't pricing in. Stress-test before assuming the spread holds.
Location & tenants
- Location reads 67/100 on livability (#574 in NY) — a middle-class / working-renter tenant base. Strengths: housing A+, cost of living A, crime A-; Watch: employment C-, schools D-, amenities F.
- Stamford Central School District (rural): math 40% / reading 35% proficiency, ranked #675 of 755 in NY (top 89%) — families likely to look elsewhere, expect single-tenant / working-renter base with shorter leases.
- Market conditions: 36 active listings in the ZIP; 66 units permitted in Delaware County in 2024 (0 in 5+ unit buildings).
Forward outlook
- In year one you build about $38k of equity ($4k loan paydown + $34k appreciation (5.2% local appreciation)).
- Delaware County population projected at -27% by 2050 — secular population decline; favor cash flow + early exit over multi-decade hold.
- At projected returns (5.2% appreciation + 3.0% rent growth), your $182k cash investment doubles in ~2 years — after that, you're playing with house money.
- By year 2, paydown + projected appreciation supports a ~$61k cash-out refi (75% LTV) — recoverable capital for the next deal without selling this one.
Negotiation context
- It's been on market 153 days — a 12% lower offer ($571k) is reasonable based on typical stale-listing flexibility.
- 3 sale attempts since 5y ago with the ask held roughly flat each time — persistent listings suggest the price (not the market) is what's stuck; bring a comps-based counter.
- Current owner paid $72k; list at $649k implies a 808% gain — meaningful room to come down on a strong offer.
Questions for the listing agent
- It's been on market 153 days. Have you received any prior offers? Is the seller open to a 12% concession, seller financing, or rate buy-down credit?
- Can we see the unit-by-unit rent roll, current vacancy, and any below-market leases? What's the average tenancy length?
- What capital expenditures (roof, boiler, parking lot, exteriors) have been made in the last 5 years, and what's planned in the next 2?
- Built in 1968 — when were the roof, HVAC, electrical panel, plumbing, and water heater last replaced?
- Why hasn't it sold? Are there any deal-killer items the seller is aware of (foundation, flood, title, zoning, code violations)?
- Is there a deadline driving the sale (1031 exchange, divorce, estate, relocation)? That informs how much negotiation room exists.
- Schools are D-rated, which usually means shorter tenancies and higher turnover. Who's the typical renter profile here, and what's been the actual vacancy rate?
- What's the average days-on-market for RENTAL listings here right now (not sales)? A rising rental-DOM trend means longer vacancies and softer asking-rent achievability than the comps imply.
- What's the recent tenant-quality profile in this submarket — average credit score on applications, eviction rate, late-payment / NSF rate, and stable-employment percentage? A property-management company in the area should have these aggregated.
- How much new apartment / multifamily construction is in the pipeline within 1–3 miles? Heavy new supply (>2% of stock underway) typically softens rents 12–24 months out; light construction supports rent growth.
Investment metrics
- 1% rule
- 1.70% ✓
- Cap rate
- 14.59%
- Cash-on-cash
- 29.63%
- DSCR
- 2.32
- GRM
- 4.9
CMA / ARV
- ARV (median comp)
- $310,000
- List price
- $649,000
- Delta
- 109.35%
- Verdict
- OVERPRICED
- Comps
- 1 within 2.0 mi
Projected returns pro-forma
5.21% appreciation · 3.0% rent growth · sell at horizon
- IRR
- 39.2%
- Equity multiple
- 3.44×
- Total profit
- $443,064
- Equity at exit
- $375,969
- IRR
- 37.1%
- Equity multiple
- 6.99×
- Total profit
- $1,088,966
- Equity at exit
- $655,746
Cash invested: $181,720 (down + closing). Projections, not guarantees.
Landlord ↔ Tenant lean methodology
- Overall (STATE)
- 15 Strongly Tenant-Friendly
- State New York
- 15 Strongly Tenant-Friendly · D+10
- County
- — inherits STATE
- City
- — inherits STATE
ZIP-level market 12167
- Home prices YoY
- 1.4%
- Active inventory
- 36
- Price-to-rent
- 14.9×
Monthly cashflow live
- Estimated rent
- $11,048 medium interval (Pro) →
- Mortgage (P&I)
- −$3,403
- Tax from tax record
- −$567 /mo · $6,808/yr
- Insurance
- −$270
- HOA
- −$0
- Vacancy / Maint / Mgmt
- −$2,320
- Net cashflow
- $4,487
Break-even live
3-unit breakdown (identical units grouped — click to expand)
| Units | Beds | Baths | Est. rent |
|---|---|---|---|
| 1× unit | 4 | 1 | $3,637 |
| 1× unit | 4 | 2 | $3,637 |
| 1× unit | 5 | 2 | $3,773 |
| Total (3 units) | $11,048 | ||
UW: 25.0% down · 7.5% · 30yr · 1.5% tax · 5.0% vac · 8.0% maint · 8.0% mgmt
Financing live
Cash to close
- Down payment
- $162,250
- Closing costs
- $19,470
- Reserves months
- —
- Total cash needed
- —
Loan-product check · same deal, 3 products live
Conventional
25% down · 7.5% · 30yr
- Down + closing
- —
- Monthly P&I
- —
- Monthly cashflow
- —
- DSCR
- —
- Eligible?
- —
Personal DTI + credit; lowest rate.
DSCR
20% down · 8.5% · 30yr
- Down + closing
- —
- Monthly P&I
- —
- Monthly cashflow
- —
- DSCR
- —
- Eligible?
- —
No personal income docs; deal must DSCR.
Hard money
10% down · 12.0% · 12mo
- Down + closing
- —
- Monthly P&I
- —
- Monthly cashflow
- —
- DSCR
- —
- Eligible?
- —
Short-term bridge; refi at stabilization.
Listing history 18 events
-
2026-06-18days on market $649,000 Active 153 DOM
-
2026-06-17days on market $649,000 Active 152 DOM
-
2026-06-16days on market $649,000 Active 151 DOM
-
2026-06-15days on market $649,000 Active 150 DOM
-
2026-06-13days on market $649,000 Active 148 DOM
-
2026-06-12days on market $649,000 Active 147 DOM
-
2026-06-09days on market $649,000 Active 144 DOM
-
2026-06-08days on market $649,000 Active 143 DOM
-
2026-06-07days on market $649,000 Active 142 DOM
-
2026-06-07days on market $649,000 Active 141 DOM
-
2026-06-04days on market $649,000 Active 138 DOM
-
2026-06-02days on market $649,000 Active 137 DOM
-
2026-06-01days on market $649,000 Active 136 DOM
-
2026-05-31days on market $649,000 Active 135 DOM
-
2026-01-12$649,000 Active 594-char remark
Show marketing remark (594 chars)
Excellent Income opportunity. 3 Apartments. 13 Bedrooms 5 Baths. All units have a private entry and use of the yard. Apt 1 is a 4 Bedroom 1 Bath, Apt 2 is a 4 Bedroom 2 Bath, Apt 3 is a 5 Bedroom 2 Bath. Units Fully occupied Generating positive cash flow. All units metered separately. Each tenant has their own heat source. Tenant pays for their own heat and electric. New roof, 2 new furnaces. Landlord takes care of lawn care and snow removal. Room to develop another rental income. Or use for landlord storage. Annual Gross Rent income $60,000. Financial information furnished upon request.
-
2021-09-12$500,000
-
2021-05-24$500,000
-
2002-08-06soldstatus $71,500
ⓘ Source: listings_history table (triggers on properties + properties_extension) + one-shot
backfill from property_details.listing_events for pre-trigger history.
Tax reassessment forecast NY · Partial reset (capped growth)
- Current annual tax
- $6,808 · $567/mo
- Projected year-2 tax
- $8,888 · $741/mo
- Expected delta
- +$2,080/yr (+$173/mo · 30.6%)
ⓘ Screening estimate from a state-policy table — verify with the county assessor before closing.
Climate risk First Street
- Flood 1/10 Low FEMA zone X (unshaded) · 0% chance over 30 yrs
- Wildfire 2/10 Low
- Heat 1/10 Low 8 d/yr ≥87°F today · 19 d/yr by 30 yrs out
- Wind 2/10 Low 2% chance of damaging wind over 30 yrs
- Air quality 1/10 Low 0 unhealthy d/yr today · 0 by 30 yrs out
Nearby sold comps map
Loading sold comps map…
Walkable amenities ~0.75 mi
Loading nearby amenities…
Taxation est. · year 1
- Rental income
- $132,576
- − Mortgage interest
- −$36,354
- − Property taxes
- −$6,808
- − Insurance
- −$3,245
- − Repairs & maintenance
- −$10,606
- − Management
- −$10,606
- − Depreciation
- −$18,880
- Taxable income
- $46,077
- Est. tax owed @ 24.0%
- −$11,058
- After-tax cash flow
- $42,783/yr
For passive investors: Depreciation is non-cash, so a rental often shows a tax loss while cash-flowing — sheltering income. Rental losses are passive: they offset passive income freely, and up to $25,000/yr can offset ordinary (W-2) income if you actively participate and your MAGI is under $100k (phasing out to $0 by $150k); unused losses carry forward. On sale, claimed depreciation is recaptured at up to 25%, and gains may owe capital-gains tax (a 1031 exchange can defer both). Figures are a year-1 estimate at your 24.0% rate — not tax advice; consult a CPA.
Schools (NCES district)
- District
- Stamford Central School District
- NCES district ID
- 3628020
- Math proficiency
- 40% ▼ -10.00%
- Reading proficiency
- 35% ▼ -10.00%
- Median HH income
- $42,968
- Composite
- 34.29/100
- National rank
- #10231
- State rank
- #675 of 755 in NY
Livability — Stamford
- Score
- 67/100
- State rank
- #574
- US rank
- #10332
Category grades
Schools grade is shown separately in the Schools card above.
Census & demographics
- Census place
- Stamford, NY
- Population (ZIP)
- 2,257
Population outlook (Delaware County) Hauer SSP2
- Today (2025)
- 42,668 people
- By 2030
- 40,337 · -5.5%
- By 2040
- 35,514 · -16.8%
- By 2050
- 31,265 · -26.7%
- By 2075
- 24,455 · -42.7%
- By 2100
- 19,529 · -54.2%
Race, ethnicity, and origin ACS 2023
- Neighborhood character
- Predominantly White (94%)
- Race & ethnicity
- White 94% Two or more races 4% Hispanic / Latino 2%
- Common ancestry
- Romanian 8% Iranian 3% Lithuanian 2%
- Foreign-born
- 3% · Canada, China
- Languages at home
- 94% English-only · Other Indo-European 3% Spanish 1% Russian/Polish/Slavic 1%
Political lean MEDSL · Delaware
- 2024 margin
- R (+19.8) · D 40.1% · R 59.9%
- 2008→2024 swing
- -14.6pp toward R · 2008: -5.2pp · 2024: -19.8pp
- All cycles
- 2024: R+19.8 2020: R+18.4 2016: R+29.2 2012: R+9.6 2008: R+5.2
Not yet ingested
- Civics
- —
Market trends
- HPI YoY
- ▲ 5.21%
- Current HPI
- 368.4492
- Rent YoY
- —
- Metro
- —
- State GDP YoY
- ▲ 2.60%
- F500 in state
- 92
Industry mix (Fortune 500 HQ in NY)
| Industry | F500 HQs | Revenue |
|---|---|---|
| Financial Services | 10 | $950B |
|
||
| Consumer Goods | 9 | $162B |
|
||
| Insurance | 4 | $225B |
|
||
| Telecommunications | 2 | $144B |
|
||
| Pharmaceuticals | 2 | $112B |
|
||
| Media / Entertainment | 2 | $69B |
|
||
Price history
+807.7% since first listed4 events — show timeline
- 2026-01-12 Listed $649,000 Global MLS
- 2021-09-12 Listed $500,000 UNYREIS
- 2021-05-24 Listed $500,000 UNYREIS
- 2002-08-06 Sold (Public Records) $71,500 Public Records
Property tax history
+2.1%/yrLatest (2025): $6,808 · +3.0% YoY. Source: county tax records.
Cash-flow waterfall
monthlySold comps — $/sqft
last 12 mo · ≤1 miLoading sold comps…