42724 Tango Ct · Indio, CA
Flood risk 1/10 · Minimal
- FEMA flood zone
- X (unshaded)
- Chance of flooding over 30 yrs
- 0.0%
- Est. flood insurance / yr
- $507 – $1,088
Fire risk 6/10 · Moderate
- Est. fire insurance / yr
- $659 – $1,223
Heat risk 10/10 · Severe
- Hot days now (above 114°F)
- 6 days/yr
- Hot days in 30 yrs
- 16 days/yr
Wind risk 1/10 · Minimal
- Chance of severe wind over 30 yrs
- —
Air-quality risk 3/10 · Minor
- Unhealthy air days now
- 3 days/yr
- Unhealthy air days in 30 yrs
- 5 days/yr
Risk factors via First Street. Map © Google.
Why this score? — see what drove the D grade
The composite is a weighted blend of 9 inputs, each scored 0–100. Each bar is that input's sub-score; the figure is the points it added to the 100-point composite (weight × sub-score).
- ARV discount +13.0/15.0
- Cash flow +11.0/30.0
- Rent growth +5.0/5.0
- Schools +3.8/10.0
- 1% rule +3.3/10.0
- DSCR +3.2/10.0
- Livability +2.7/5.0
- Condition / age +2.5/5.0
- Appreciation +0.0/10.0
$550,000
🖨 Deal sheet 📄 Offer letter ✓ Due diligence
Listing remarks
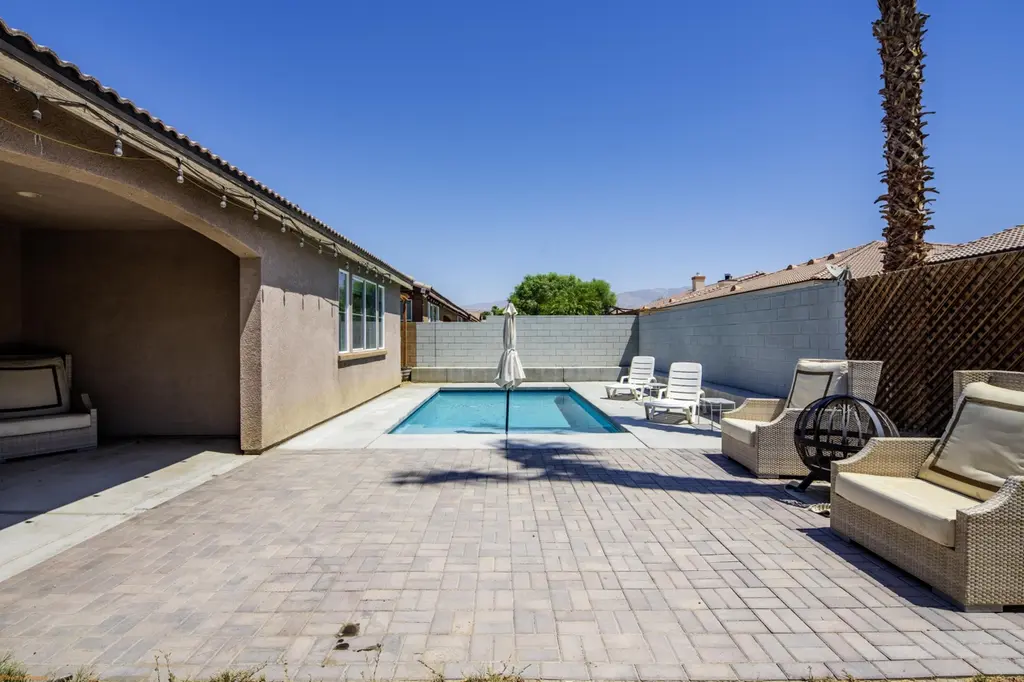
Priced for a quick sale, this is one of the lowest priced homes available in the desirable Haciendas community! This spacious 2,657 sq. ft. home features 4 bedrooms, 3 bathrooms, a premium corner lot, and a private pool!!! The open floor plan offers plenty of space for living and entertaining, while the primary suite provides a comfortable retreat. Low HOA fees, a sought after location, and a backyard made for relaxation make this an exceptional opportunity. Don't miss your chance to own a pool home on a corner lot at an incredible value this one won't last long!
Key facts
- Premium corner lot
- Open floor plan
- Private pool
Tags
Property features AI
Finance
- Other: Property type listed as single family residence; Fee simple land
- HOA & community: HOA dues $130.00 per month; Association provides additional community amenities
Exterior
- Parking: Attached 2-car garage; Two additional uncovered/assigned parking spaces (total 4 parking spaces)
- Security: Gated community
- Utilities: Sewer is connected and paid; PUD: Yes
- Home design: Single family residence, detached; One story (ground level)
- Construction: Year built per assessor; Has sprinklers
- Exterior features: Private in-ground pool; Sprinkler system; Gated community (security listed under exterior features)
Interior
- Flooring: Other flooring
- Bathrooms: Three full bathrooms
- Heating & cooling: Central heating; Central air conditioning
- Interior features: Unfurnished; Gas fireplace located in the kitchen
Neighborhood map
What this means for you Summary
Snapshot
- This is a 4-bed/3.0-bath single-family listed at $550k.
Deal economics
- At list price, monthly cash flow is $-229 ($-3k/yr) — negative.
- To cash-flow at today's rent, offer at most $510k (7.4% below list).
- To meet the 1% rule (rent ≥ 1% of price), the offer needs to be $454k (17.4% below list).
- Recommended offer: $454k (17.4% below list) — sets the bar for 1% rule.
- Cap rate 5.8% vs local median 4.3% in Indio — top-decile yield for the area; either an underpriced asset or a hidden risk that comps aren't pricing in. Stress-test before assuming the spread holds.
Location & tenants
- Location reads 53/100 on livability (#927 in CA) — a working-class tenant base; expect higher turnover. Strengths: housing B+; Watch: employment D, schools F, crime F.
- Desert Sands Unified (suburban): math 31% / reading 56% proficiency, ranked #199 of 517 in CA (top 38%) — families likely to look elsewhere, expect single-tenant / working-renter base with shorter leases.
- Market conditions: Rents rising fast (+11.6%/yr); 441 active listings in the ZIP; 26 comparable units currently listed for rent nearby; rentals lingering (median 44d on market — plan ~5-8 weeks vacancy on turnover, expect pricing pressure); 65% of comp listings sitting > 30 days — soft ceiling on asking rent; solid renter incomes; 9,195 units permitted in Riverside County in 2024 (1,512 in 5+ unit buildings).
- At $4,543/mo this rent would consume 56% of the median local household income ($97k/yr) (locally 565% of renters already pay >50% of income on rent) — very limited rent-growth headroom before tenants either downsize or default.
Forward outlook
- Local home prices are declining (-3.0%/yr); year-one equity from $4k of loan paydown is wiped out by about $16k of value loss. Plan a longer hold.
- Riverside County population projected at +22% by 2050 — long-run rental-demand tailwind backs the buy-and-hold thesis.
Negotiation context
- Only 5 days on market — expect competitive offers; lowballing is unlikely to land.
- 2 sale attempts with the ask held roughly flat each time — persistent listings suggest the price (not the market) is what's stuck; bring a comps-based counter.
Risks & watch-outs
- Climate carrying-cost: major wildfire risk; extreme-heat days projected 6→16/yr by 2055 (HVAC capex compounding) — expect insurance premiums to compound above CPI over the hold.
Questions for the listing agent
- What do current leases actually rent for vs. the listed asking? Can we see a recent rent roll and the last 12 months of T-12 income?
- What does the HOA fee cover, when was the last increase, and are there any pending special assessments or reserve-fund shortfalls?
- Is there a deadline driving the sale (1031 exchange, divorce, estate, relocation)? That informs how much negotiation room exists.
- Schools are F-rated, which usually means shorter tenancies and higher turnover. Who's the typical renter profile here, and what's been the actual vacancy rate?
- Crime grade is F in this area — have there been break-ins, vandalism, or insurance claims at this property in the last 3 years? What carrier currently insures it and at what premium?
- The area grade is low — what's the realistic commute time and amenity access for the typical tenant pool here? Any planned neighborhood developments (good or bad) we should know about?
- What's the average days-on-market for RENTAL listings here right now (not sales)? A rising rental-DOM trend means longer vacancies and softer asking-rent achievability than the comps imply.
- What's the recent tenant-quality profile in this submarket — average credit score on applications, eviction rate, late-payment / NSF rate, and stable-employment percentage? A property-management company in the area should have these aggregated.
- How much new for-sale + rental construction is in the pipeline within 1–3 miles? Heavy new supply typically softens prices + rents 12–24 months out; constrained supply supports both.
Investment metrics
- 1% rule
- 0.83% ✗
- Cap rate
- 5.79%
- Cash-on-cash
- -1.78%
- DSCR
- 0.92
- GRM
- 10.1
CMA / ARV
- ARV (on-the-fly)
- $627,052
- Comps found
- 12
Show comp detail 12 sales within ~0.75 mi
| Address | Dist | Beds/Ba | Sqft | Sold | Price | $/sf | Match |
|---|---|---|---|---|---|---|---|
| 42694 La Danza Ct | 0.05mi | 4/3.0 | 2,657 (0%) | 1mo | $550,000 | $207 | 97 |
| 83740 Durazo Ln | 0.17mi | 4/3.0 | 2,502 (-6%) | 1mo | $590,000 | $236 | 82 |
| 42727 Saint Lucia St | 0.17mi | 4/3.0 | 2,804 (+6%) | 6mo | $599,999 | $214 | 78 |
| 42912 Gazapo Ct | 0.30mi | 4/3.0 | 2,502 (-6%) | 2mo | $605,000 | $242 | 74 |
| 84101 Novello Dr | 0.25mi | 3/3.0 (-1) | 2,554 (-4%) | 6mo | $599,990 | $235 | 72 |
| 83587 Moroccan Dr | 0.32mi | 4/3.0 | 2,811 (+6%) | 6mo | $600,000 | $213 | 71 |
| 83315 Stagecoach Rd | 0.59mi | 4/3.0 | 2,749 (+4%) | 4mo | $575,000 | $209 | 64 |
| 83822 Collection Dr | 0.16mi | 3/3.0 (-1) | 2,273 (-14%) | 2mo | $575,000 | $253 | 61 |
| 84450 Onda Dr | 0.68mi | 4/2.5 | 2,478 (-7%) | 2mo | $800,000 | $323 | 53 |
| 43635 Aquila St | 0.60mi | 5/3.5 (+1) | 2,815 (+6%) | 4mo | $649,000 | $231 | 52 |
| 42776 Del Lago Ct | 0.63mi | 5/3.0 (+1) | 2,431 (-8%) | 6mo | $915,000 | $376 | 46 |
| 84317 Falco Ct | 0.70mi | 4/3.0 | 2,284 (-14%) | 6mo | $610,000 | $267 | 39 |
Match score weights: distance 35% · size 25% · config 20% · recency 20%. Top-matched comps best support the ARV.
Projected returns pro-forma
-3.0% appreciation · 8.0% rent growth · sell at horizon
- IRR
- -13.8%
- Equity multiple
- 0.48×
- Total profit
- $-79,612
- Equity at exit
- $82,007
- IRR
- 1.6%
- Equity multiple
- 1.14×
- Total profit
- $21,501
- Equity at exit
- $47,554
Cash invested: $154,000 (down + closing). Projections, not guarantees.
Landlord ↔ Tenant lean methodology
- Overall (STATE)
- 18 Strongly Tenant-Friendly
- State California
- 18 Strongly Tenant-Friendly · D+13
- County
- — inherits STATE
- City
- — inherits STATE
ZIP-level market 92203
- Home prices YoY
- -25.0%
- Rents YoY
- 11.6%
- Active inventory
- 441
- Price-to-rent
- 10.1×
Monthly cashflow live
- Estimated rent
- $4,543 high interval (Pro) →
- Mortgage (P&I)
- −$2,884
- Tax from tax record
- −$574 /mo · $6,893/yr
- Insurance
- −$229
- HOA
- −$130
- Vacancy / Maint / Mgmt
- −$954
- Net cashflow
- $-229
Break-even live
UW: 25.0% down · 7.5% · 30yr · 1.5% tax · 5.0% vac · 8.0% maint · 8.0% mgmt
Financing live
Cash to close
- Down payment
- $137,500
- Closing costs
- $16,500
- Reserves months
- —
- Total cash needed
- —
Loan-product check · same deal, 3 products live
Conventional
25% down · 7.5% · 30yr
- Down + closing
- —
- Monthly P&I
- —
- Monthly cashflow
- —
- DSCR
- —
- Eligible?
- —
Personal DTI + credit; lowest rate.
DSCR
20% down · 8.5% · 30yr
- Down + closing
- —
- Monthly P&I
- —
- Monthly cashflow
- —
- DSCR
- —
- Eligible?
- —
No personal income docs; deal must DSCR.
Hard money
10% down · 12.0% · 12mo
- Down + closing
- —
- Monthly P&I
- —
- Monthly cashflow
- —
- DSCR
- —
- Eligible?
- —
Short-term bridge; refi at stabilization.
Rent comps 26 comps
| Address | Beds | Baths | Sqft | Rent | $/sqft | DOM | Units | Dist |
|---|---|---|---|---|---|---|---|---|
| 83907 Avenida Serena Indio, CA | 4.0 | 2.0 | 1765 | $3,200 | $1.81 | 44d | 1 | 0.22mi |
| 42753 Della Pl Indio, CA | 4.0 | 3.0 | 2338 | $6,500 | $2.78 | 5d | 1 | 0.23mi |
| 42753 Della Pl Indio, CA | 4.0 | 3.0 | 2338 | $6,000 | $2.57 | 44d | 1 | 0.23mi |
| 83721 Mirabella Dr Indio, CA | 3.0 | 2.5 | 1995 | $5,000 | $2.51 | 44d | 1 | 0.25mi |
| 84136 Olona Ct Indio, CA | 4.0 | 3.0 | 1920 | $5,000 | $2.60 | 44d | 1 | 0.29mi |
| 42696 Saragoza Ct Indio, CA | 4.0 | 3.0 | 2502 | $3,195 | $1.28 | 3d | 1 | 0.30mi |
| 83631 Himilaya Dr Indio, CA | 3.0 | 2.0 | 1930 | $3,300 | $1.71 | 44d | 1 | 0.37mi |
| 83448 Wagon Rd Indio, CA | 4.0 | 3.5 | 3147 | $3,500 | $1.11 | 44d | 1 | 0.42mi |
| 43275 Passagio Lago Way Indio, CA | 4.0 | 4.0 | 2697 | $4,000 | $1.48 | 44d | 1 | 0.58mi |
| 43329 Passagio Lago Way Indio, CA | 4.0 | 4.0 | 2697 | $4,200 | $1.56 | 11d | 1 | 0.60mi |
| 84401 Passagio Lago Way Indio, CA | 4.0 | 5.0 | 2680 | $3,195 | $1.19 | 24d | 1 | 0.66mi |
| 42816 Dell Lago Ct Indio, CA | 3.0 | 2.0 | 2012 | $25,000 | $12.43 | 44d | 1 | 0.66mi |
| 42942 Dell Lago Ct Indio, CA | 4.0 | 3.0 | 2234 | $10,500 | $4.70 | 44d | 1 | 0.67mi |
| 43180 Portuale Ct Indio, CA | 4.0 | 4.5 | 2697 | $6,495 | $2.41 | 44d | 1 | 0.77mi |
| 43073 Traccia Way Indio, CA | 4.0 | 3.0 | 2234 | $5,995 | $2.68 | 44d | 1 | 0.78mi |
| 84546 Miliare Ct Indio, CA | 4.0 | 4.5 | 2697 | $6,995 | $2.59 | 44d | 1 | 0.79mi |
| 84644 Pavone Way Indio, CA | 4.0 | 3.0 | 2472 | $5,500 | $2.22 | 44d | 1 | 0.82mi |
| 84649 Pavone Way Indio, CA | 3.0 | 2.0 | 2012 | $3,950 | $1.96 | 24d | 1 | 0.84mi |
| 43627 Regata Ct Indio, CA | 5.0 | 2.5 | 2697 | $4,000 | $1.48 | 44d | 1 | 0.86mi |
| 84638 Litorale Ct Indio, CA | 4.0 | 4.5 | 2697 | $5,900 | $2.19 | 5d | 1 | 0.87mi |
| 43426 Lago Breeza Dr Indio, CA | 4.0 | 3.0 | 2431 | $4,000 | $1.65 | 11d | 1 | 0.94mi |
| 43784 Riunione Pl Indio, CA | 5.0 | 2.0 | 2200 | $5,500 | $2.50 | 44d | 1 | 0.95mi |
| 43760 Spiaggia Pl Indio, CA | 4.0 | 3.0 | 3142 | $4,500 | $1.43 | 44d | 1 | 1.01mi |
| 82814 Plymouth Dr Indio, CA | 4.0 | 3.0 | 2451 | $3,200 | $1.31 | 11d | 1 | 1.32mi |
| 82563 Tivoli Ct Indio, CA | 5.0 | 3.0 | 2626 | $4,000 | $1.52 | 44d | 1 | 1.40mi |
| 82686 Castleton Dr Indio, CA | 3.0 | 2.0 | 1841 | $2,700 | $1.47 | 2d | 1 | 1.50mi |
HOA detail
- Monthly dues
- $130 · $1,560/yr
- Likely covers
- pool
Listing history 4 events
-
2026-06-15status $550,000 Pending 5 DOM
-
2026-06-13days on market $550,000 Active 5 DOM
-
2026-06-09remarks 569-char remark
-
2026-06-09$550,000 Active 1 DOM
ⓘ Source: listings_history table (triggers on properties + properties_extension) + one-shot
backfill from property_details.listing_events for pre-trigger history.
Tax reassessment forecast CA · Resets to sale price
- Current annual tax
- $6,893 · $574/mo
- Projected year-2 tax
- $6,893 · $574/mo
- Expected delta
- $0/yr ($0/mo · 0.0%)
ⓘ Screening estimate from a state-policy table — verify with the county assessor before closing.
Climate risk First Street
- Flood 1/10 Low FEMA zone X (unshaded) · 0% chance over 30 yrs
- Wildfire 6/10 Major
- Heat 10/10 Extreme 6 d/yr ≥114°F today · 16 d/yr by 30 yrs out
- Wind 1/10 Low
- Air quality 3/10 Moderate 3 unhealthy d/yr today · 5 by 30 yrs out
Nearby sold comps map
Loading sold comps map…
Walkable amenities ~0.75 mi
Loading nearby amenities…
Taxation est. · year 1
- Rental income
- $54,516
- − Mortgage interest
- −$30,809
- − Property taxes
- −$6,893
- − Insurance
- −$2,750
- − Repairs & maintenance
- −$4,361
- − Management
- −$4,361
- − HOA
- −$1,560
- − Depreciation
- −$16,000
- Taxable loss
- −$12,218
- Est. tax savings @ 24.0%
- +$2,932
- After-tax cash flow
- $186/yr
For passive investors: Depreciation is non-cash, so a rental often shows a tax loss while cash-flowing — sheltering income. Rental losses are passive: they offset passive income freely, and up to $25,000/yr can offset ordinary (W-2) income if you actively participate and your MAGI is under $100k (phasing out to $0 by $150k); unused losses carry forward. On sale, claimed depreciation is recaptured at up to 25%, and gains may owe capital-gains tax (a 1031 exchange can defer both). Figures are a year-1 estimate at your 24.0% rate — not tax advice; consult a CPA.
Schools (NCES district)
- District
- Desert Sands Unified
- NCES district ID
- 0611110
- Math proficiency
- 31% ▼ -4.00%
- Reading proficiency
- 56% ▲ 7.00%
- Median HH income
- $54,957
- Composite
- 37.77/100
- National rank
- #4346
- State rank
- #199 of 517 in CA
Livability — Indio
- Score
- 53/100
- State rank
- #927
- US rank
- #24244
Category grades
Schools grade is shown separately in the Schools card above.
Census & demographics
- Census place
- Indio, CA
- County
- Riverside County · 2,287,001 people
- City population
- 100,560
- Metro
- Riverside-San Bernardino-Ontario, CA
- Population (ZIP)
- 34,735
- Household income
- $97,311
- Rent vs Own
- Severe rent burden
- 565.0
Population outlook (Riverside County) Hauer SSP2
- Today (2025)
- 2,664,475 people
- By 2030
- 2,802,692 · +5.2%
- By 2040
- 3,050,904 · +14.5%
- By 2050
- 3,256,783 · +22.2%
- By 2075
- 3,655,058 · +37.2%
- By 2100
- 3,766,594 · +41.4%
Race, ethnicity, and origin ACS 2023
- Neighborhood character
- Diverse neighborhood (Simpson 0.57)
- Race & ethnicity
- Hispanic / Latino 51% White 41% Two or more races 29% Asian 3% Black 2%
- Hispanic origin (detail)
- Mexican 48%
- Common ancestry
- Italian 3% Lithuanian 2% Romanian 2%
- Foreign-born
- 14% · Canada
- Languages at home
- 64% English-only · Spanish 33% Tagalog/Filipino 1% Other Indo-European 1%
Political lean MEDSL · Riverside
- 2024 margin
- Toss-up / Even · D 48.0% · R 49.3% · Other 2.6%
- 2008→2024 swing
- -3.6pp toward R · 2008: 2.3pp · 2024: -1.3pp
- All cycles
- 2024: R+1.3 2020: D+8.0 2016: D+4.3 2012: R+0.4 2008: D+2.3
Not yet ingested
- Civics
- —
Market trends
- HPI YoY
- ▼ -98.51%
- Current HPI
- 295.6456
- Rent YoY
- ▲ 11.64%
- Metro
- Riverside-San Bernardino-Ontario, CA
- State GDP YoY
- ▲ 3.21%
- F500 in state
- 116
Industry mix (Fortune 500 HQ in CA)
| Industry | F500 HQs | Revenue |
|---|---|---|
| Technology | 27 | $1,492B |
|
||
| Financial Services | 3 | $174B |
|
||
| Retail | 3 | $44B |
|
||
| Insurance | 3 | $26B |
|
||
| Media / Entertainment | 2 | $115B |
|
||
| Pharmaceuticals / Biotech | 2 | $62B |
|
||
Price history
-6.6% since first listed3 events — show timeline
- 2026-06-08 Listed $550,000 GPSMLS
- 2026-04-09 Listing Removed — GPSMLS
- 2025-10-31 Listed $589,000 GPSMLS
Property tax history
+8.7%/yrLatest (2025): $6,893 · +0.4% YoY. Source: county tax records.
Cash-flow waterfall
monthlySold comps — $/sqft
last 12 mo · ≤1 miLoading sold comps…