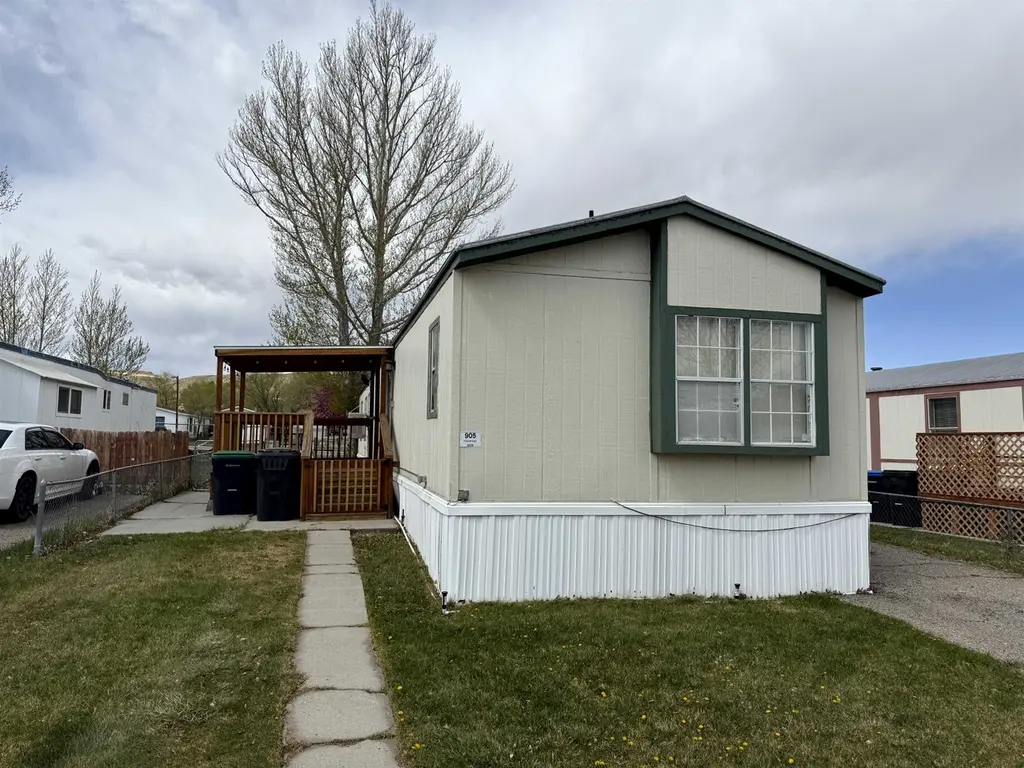
905 Daniel Boone · Green River, WY
Flood risk 1/10 · Minimal
- FEMA flood zone
- X
- Chance of flooding over 30 yrs
- 0.0%
- Est. flood insurance / yr
- $507 – $1,088
Fire risk 4/10 · Minor
- Est. fire insurance / yr
- $564 – $1,046
Heat risk 3/10 · Minor
- Hot days now (above 88°F)
- 7 days/yr
- Hot days in 30 yrs
- 19 days/yr
Wind risk 1/10 · Minimal
- Chance of severe wind over 30 yrs
- —
Air-quality risk 2/10 · Minimal
- Unhealthy air days now
- 1 days/yr
- Unhealthy air days in 30 yrs
- 1 days/yr
Risk factors via First Street. Map © Google.
Why this score? — see what drove the D grade
The composite is a weighted blend of 9 inputs, each scored 0–100. Each bar is that input's sub-score; the figure is the points it added to the 100-point composite (weight × sub-score).
- Cash flow +10.1/30.0
- 1% rule +10.0/10.0
- ARV discount +7.5/15.0
- Schools +5.4/10.0
- Livability +3.7/5.0
- DSCR +2.9/10.0
- Rent growth +2.5/5.0
- Condition / age +2.2/5.0
- Appreciation +0.0/10.0
$43,000
🖨 Deal sheet (PDF) 📄 Offer letter ✓ Due diligence
Key facts
- En suite bathroom
- Well-located
- Functional layout
Tags
Property features AI
Finance
- HOA & community: Homeowners association with a $606 monthly fee
Exterior
- Parking: No garage
- Utilities: Public water; Public sewer; Natural gas available
- Home design: Residential mobile home; Mobile/Mfd detached
- Construction: Vinyl siding; Asphalt roof
- Exterior features: Deck
Interior
- Kitchen: Refrigerator; Range; Oven
- Flooring: Carpet; Laminate
- Heating & cooling: Forced air heating
- Interior features: Dishwasher; Disposal
- Laundry & utility: Washer; Dryer
Neighborhood map
What this means for you Summary
Snapshot
- This is a 3-bed/2.0-bath manufactured listed at $43k. Condition is rated fair.
Deal economics
- At list price, monthly cash flow is $-25 ($-299/yr) — negative.
- To cash-flow at today's rent, offer at most $39k (8.4% below list).
- Meets the 1% rule at list price ($1k rent vs $43k).
- Recommended offer: $39k (8.4% below list) — sets the bar for cash-flow.
- Cap rate 5.6% vs local median 2.9% in Green River — top-decile yield for the area; either an underpriced asset or a hidden risk that comps aren't pricing in. Stress-test before assuming the spread holds.
Location & tenants
- Location reads 74/100 on livability (#19 in WY, #4,785 nationally) — a middle-class / working-renter tenant base. Strengths: employment A+, cost of living A+, housing A+; Watch: amenities F, commute F, health & safety F.
- Sweetwater County School District #2 (town): math 62% / reading 61% proficiency, ranked #6 of 41 in WY (top 15%) — acceptable for families but not a draw, mixed tenant base, ~2y average lease.
- Zoned schools: Lincoln Middle School (math 59% / reading 58%, grade B, #21 of 55 statewide, top 39%, 557 students, 27% FRL).
- Market conditions: 75 active listings in the ZIP; 47 units permitted in Sweetwater County in 2024 (0 in 5+ unit buildings).
Forward outlook
- Local home prices are declining (-3.0%/yr); year-one equity from $297 of loan paydown is wiped out by about $1k of value loss. Plan a longer hold.
- Sweetwater County population projected at +12% by 2050 — modest demand growth; plan on rents tracking national, not racing it.
Negotiation context
- It's been on market 60 days — a 3% lower offer ($42k) is reasonable based on typical stale-listing flexibility.
Risks & watch-outs
- Watch-outs: HOA is 55% of rent.
Questions for the listing agent
- What do current leases actually rent for vs. the listed asking? Can we see a recent rent roll and the last 12 months of T-12 income?
- It's been on market 60 days. Have you received any prior offers? Is the seller open to a 8% concession, seller financing, or rate buy-down credit?
- Have any recent inspections been done? Can we get a copy of the seller's disclosures and any deferred-maintenance estimates?
- What does the HOA fee cover, when was the last increase, and are there any pending special assessments or reserve-fund shortfalls?
- Is there a deadline driving the sale (1031 exchange, divorce, estate, relocation)? That informs how much negotiation room exists.
- Schools are A-rated — typically a magnet for longer-tenancy family renters. What's the average tenant stay here, and is there a school-zone premium baked into asking?
- The area grade is low — what's the realistic commute time and amenity access for the typical tenant pool here? Any planned neighborhood developments (good or bad) we should know about?
- What's the average days-on-market for RENTAL listings here right now (not sales)? A rising rental-DOM trend means longer vacancies and softer asking-rent achievability than the comps imply.
- What's the recent tenant-quality profile in this submarket — average credit score on applications, eviction rate, late-payment / NSF rate, and stable-employment percentage? A property-management company in the area should have these aggregated.
- How much new for-sale + rental construction is in the pipeline within 1–3 miles? Heavy new supply typically softens prices + rents 12–24 months out; constrained supply supports both.
Investment metrics
- 1% rule
- 2.59% ✓
- Cap rate
- 5.60%
- Cash-on-cash
- -2.48%
- DSCR
- 0.89
- GRM
- 3.2
CMA / ARV
- ARV (median comp)
- $90,833
- List price
- $43,000
- Delta
- -52.66%
- Verdict
- UNDERPRICED
- Comps
- 2 within 2.0 mi
Show comp detail 2 sales within ~0.75 mi
| Address | Dist | Beds/Ba | Sqft | Sold | Price | $/sf | Match |
|---|---|---|---|---|---|---|---|
| 805 Homestead Dr | 0.16mi | 2/1.2 (-1) | 1,280 (+5%) | 14mo | $108,500 | $85 | 63 |
| 624 Evers St | 0.56mi | 3/1.5 | 1,275 (+5%) | 7mo | $170,000 | $133 | 58 |
Match score weights: distance 35% · size 25% · config 20% · recency 20%. Top-matched comps best support the ARV.
Projected returns pro-forma
-3.0% appreciation · 3.0% rent growth · sell at horizon
- IRR
- -19.2%
- Equity multiple
- 0.32×
- Total profit
- $-8,163
- Equity at exit
- $6,411
- IRR
- -9.8%
- Equity multiple
- 0.37×
- Total profit
- $-7,568
- Equity at exit
- $3,718
Cash invested: $12,040 (down + closing). Projections, not guarantees.
Landlord ↔ Tenant lean methodology
- Overall (STATE)
- 90 Strongly Landlord-Friendly
- State Wyoming
- 90 Strongly Landlord-Friendly · R+25
- County
- — inherits STATE
- City
- — inherits STATE
ZIP-level market 82935
- Active inventory
- 75
- Price-to-rent
- 3.2×
Monthly cashflow live
- Estimated rent
- $1,112 medium interval (Pro) →
- Mortgage (P&I)
- −$225
- Tax est. 1.5%
- −$54 /mo · $645/yr
- Insurance
- −$18
- HOA
- −$606
- Vacancy / Maint / Mgmt
- −$233
- Net cashflow
- $-25
Break-even live
Sensitivity live
| Price | -10% $5 | -5% $-10 | +0% $-25 | +5% $-40 | +10% $-55 |
|---|---|---|---|---|---|
| Rent | -10% $-113 | -5% $-69 | +0% $-25 | +5% $19 | +10% $63 |
| Rate | -1.0pp $-3 | -0.5pp $-14 | base $-25 | +0.5pp $-36 | +1.0pp $-47 |
UW: 25.0% down · 7.5% · 30yr · 1.5% tax · 5.0% vac · 8.0% maint · 8.0% mgmt
Financing live
Cash to close
- Down payment
- $10,750
- Closing costs
- $1,290
- Reserves months
- —
- Total cash needed
- —
Loan-product check · same deal, 3 products live
Conventional
25% down · 7.5% · 30yr
- Down + closing
- —
- Monthly P&I
- —
- Monthly cashflow
- —
- DSCR
- —
- Eligible?
- —
Personal DTI + credit; lowest rate.
DSCR
20% down · 8.5% · 30yr
- Down + closing
- —
- Monthly P&I
- —
- Monthly cashflow
- —
- DSCR
- —
- Eligible?
- —
No personal income docs; deal must DSCR.
Hard money
10% down · 12.0% · 12mo
- Down + closing
- —
- Monthly P&I
- —
- Monthly cashflow
- —
- DSCR
- —
- Eligible?
- —
Short-term bridge; refi at stabilization.
HOA detail
- Monthly dues
- $606 · $7,272/yr
Listing history 17 events
-
2026-06-19days on market $43,000 Active 60 DOM
-
2026-06-18days on market $43,000 Active 59 DOM
-
2026-06-17days on market $43,000 Active 58 DOM
-
2026-06-16days on market $43,000 Active 57 DOM
-
2026-06-15days on market $43,000 Active 56 DOM
-
2026-06-14days on market $43,000 Active 54 DOM
-
2026-06-12days on market $43,000 Active 53 DOM
-
2026-06-09days on market $43,000 Active 50 DOM
-
2026-06-08days on market $43,000 Active 49 DOM
-
2026-06-07days on market $43,000 Active 48 DOM
-
2026-06-05days on market $43,000 Active 45 DOM
-
2026-06-03days on market $43,000 Active 44 DOM
-
2026-06-02days on market $43,000 Active 43 DOM
-
2026-06-01days on market $43,000 Active 42 DOM
-
2026-05-31days on market $43,000 Active 41 DOM
-
2026-05-30days on market $43,000 Active 40 DOM
-
2026-04-20$43,000 Active 904-char remark
ⓘ Source: listings_history table (triggers on properties + properties_extension) + one-shot
backfill from property_details.listing_events for pre-trigger history.
Climate risk First Street
- Flood 1/10 Low FEMA zone X · 0% chance over 30 yrs
- Wildfire 4/10 Moderate
- Heat 3/10 Moderate 7 d/yr ≥88°F today · 19 d/yr by 30 yrs out
- Wind 1/10 Low
- Air quality 2/10 Low 1 unhealthy d/yr today · 1 by 30 yrs out
Nearby sold comps map
Loading sold comps map…
Walkable amenities ~0.75 mi
Loading nearby amenities…
Taxation est. · year 1
- Rental income
- $13,341
- − Mortgage interest
- −$2,409
- − Property taxes
- −$645
- − Insurance
- −$215
- − Repairs & maintenance
- −$1,067
- − Management
- −$1,067
- − HOA
- −$7,272
- − Depreciation
- −$1,251
- Taxable loss
- −$585
- Est. tax savings @ 24.0%
- +$140
- After-tax cash flow
- $-158/yr
For passive investors: Depreciation is non-cash, so a rental often shows a tax loss while cash-flowing — sheltering income. Rental losses are passive: they offset passive income freely, and up to $25,000/yr can offset ordinary (W-2) income if you actively participate and your MAGI is under $100k (phasing out to $0 by $150k); unused losses carry forward. On sale, claimed depreciation is recaptured at up to 25%, and gains may owe capital-gains tax (a 1031 exchange can defer both). Figures are a year-1 estimate at your 24.0% rate — not tax advice; consult a CPA.
Condition & rehab AI · 13 photos
This manufactured home requires moderate repairs and maintenance, including exterior siding and paint, to improve its condition and value.
Repairs flagged
- Major exterior siding — visible wear and tear
- Major roof — not visible
- Major exterior paint — visible wear and tear
Value-add opportunities
- Both paint exterior — enhances curb appeal and value
- Both repair exterior siding — improves structural integrity and appearance
- Both update flooring — modernizes the home and improves aesthetics
Renovation cost estimate screening
| Repair item | Severity | Est. cost |
|---|---|---|
| exterior siding · visible wear and tear | Major | $15,000–50,000 |
| roof · not visible | Major | $15,000–50,000 |
| exterior paint · visible wear and tear | Major | $15,000–50,000 |
| Total estimated repair cost · 3 items | $45,000–150,000 |
Value-add ROI direction
- Both paint exterior — enhances curb appeal and value ↑
- Both repair exterior siding — improves structural integrity and appearance ↑
- Both update flooring — modernizes the home and improves aesthetics ↑
ⓘ Cost ranges are severity-bucket heuristics (US national rule-of-thumb). Get contractor quotes + a written scope before underwriting a rehab budget.
Schools (NCES district)
- District
- Sweetwater County School District #2
- NCES district ID
- 5605762
- Math proficiency
- 62% ▲ 2.00%
- Reading proficiency
- 61% ▬ 0.00%
- Median HH income
- $69,339
- Composite
- 54.18/100
- National rank
- #1379
- State rank
- #6 of 41 in WY
Livability — Green River
- Score
- 74/100
- State rank
- #19
- US rank
- #4785
Category grades
Schools grade is shown separately in the Schools card above.
Census & demographics
- Census place
- Green River, WY
- Population (ZIP)
- 12,135
Population outlook (Sweetwater County) Hauer SSP2
- Today (2025)
- 48,212 people
- By 2030
- 49,664 · +3.0%
- By 2040
- 51,984 · +7.8%
- By 2050
- 54,005 · +12.0%
- By 2075
- 57,684 · +19.6%
- By 2100
- 57,857 · +20.0%
Race, ethnicity, and origin ACS 2023
- Neighborhood character
- Predominantly White (84%)
- Race & ethnicity
- White 84% Hispanic / Latino 12% Two or more races 10%
- Hispanic origin (detail)
- Mexican 10%
- Common ancestry
- Italian 6% Portuguese 3% Slovak 3%
- Foreign-born
- 3% · Canada
- Languages at home
- 95% English-only · Spanish 4% Other Indo-European 1%
Political lean MEDSL · Sweetwater
- 2024 margin
- Solid R (+53.2) · D 22.5% · R 75.7% · Other 1.8%
- 2008→2024 swing
- -25.7pp toward R · 2008: -27.5pp · 2024: -53.2pp
- All cycles
- 2024: R+53.2 2020: R+50.6 2016: R+53.5 2012: R+39.7 2008: R+27.5
Not yet ingested
- Civics
- —
Market trends
- HPI YoY
- ▼ -306.53%
- Current HPI
- 158.3212
- Rent YoY
- —
- Metro
- —
- State GDP YoY
- —
- F500 in state
- 0
Price history
1 event — show timeline
- 2026-04-20 Listed $43,000 WMLS
Cash-flow waterfall
monthlySold comps — $/sqft
last 12 mo · ≤1 miLoading sold comps…