 🏗️ New Construction
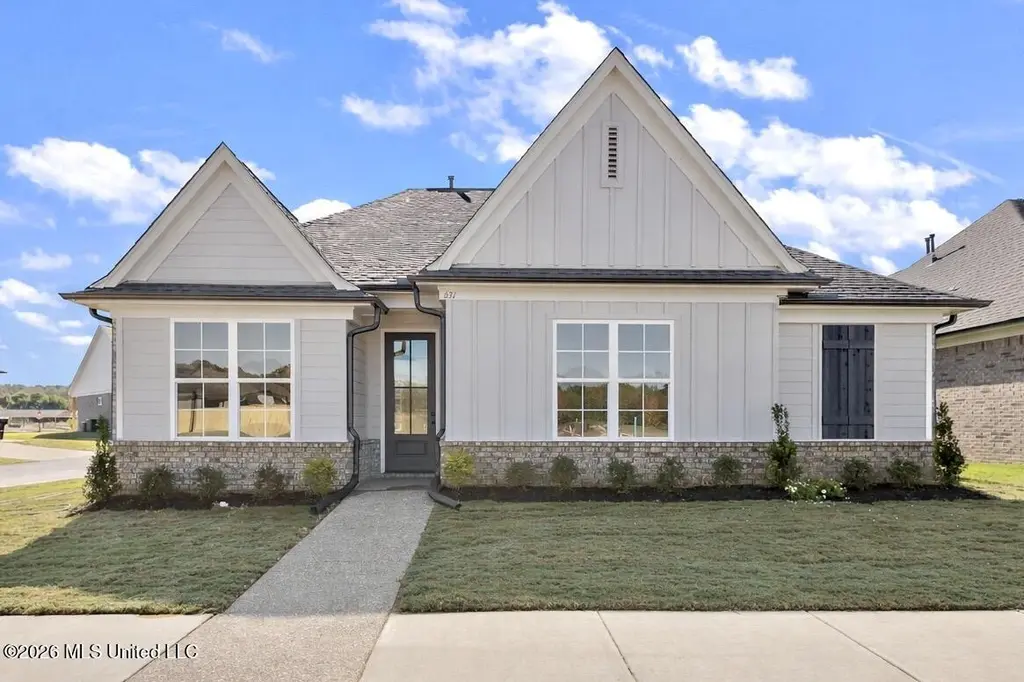
433 Sunflower St · Hernando, MS
Flood risk No data
- FEMA flood zone
- —
- Chance of flooding over 30 yrs
- —
- Est. flood insurance / yr
- —
Fire risk No data
- Est. fire insurance / yr
- —
Heat risk No data
- Hot days now (above threshold)
- —
- Hot days in 30 yrs
- —
Wind risk No data
- Chance of severe wind over 30 yrs
- —
Air-quality risk No data
- Unhealthy air days now
- —
- Unhealthy air days in 30 yrs
- —
Risk factors via First Street. Map © Google.
Why this score? — see what drove the C- grade
The composite is a weighted blend of 9 inputs, each scored 0–100. Each bar is that input's sub-score; the figure is the points it added to the 100-point composite (weight × sub-score).
- Cash flow +17.6/30.0
- ARV discount +7.5/15.0
- DSCR +5.5/10.0
- 1% rule +4.9/10.0
- Condition / age +4.8/5.0
- Schools +4.0/10.0
- Livability +3.5/5.0
- Rent growth +2.5/5.0
- Appreciation +0.0/10.0
$326,900
🖨 Deal sheet (PDF) 📄 Offer letter ✓ Due diligence
Listing remarks
Welcome to more than just a home--welcome to a new way of life at Delta Landing, brought to you by Sky Lake Construction. The LeFlore Subdivision offers traditional homes with plenty of space for creating lasting memories. But this is more than a house; it's a vibrant community. Located just off McInvale, north of Highway 269 and across from the brand-new Hernando High School, this neighborhood will feature shops, restaurants, parks, and, above all, ultimate convenience. The Lexington Plan welcomes you with a spacious family room with 9-foot ceilings. You'll be greeted by an array of natural light streaming through oversized windows, and a gas fireplace to make the space even more inviting.
Key facts
- Open-concept design
- Natural light
- Gas fireplace
Tags
Neighborhood map
What this means for you Summary
Snapshot
- This is a 3-bed/2.0-bath single-family listed at $327k. Condition is rated excellent.
Deal economics
- At list price, monthly cash flow is $253 ($3k/yr) — positive.
- The deal already cash-flows at list — no discount required.
- To meet the 1% rule (rent ≥ 1% of price), the offer needs to be $322k (1.4% below list).
- Recommended offer: $322k (1.5% below list) — sets the bar for market timing.
- Cap rate 7.2% vs local median 4.2% in Hernando — top-decile yield for the area; either an underpriced asset or a hidden risk that comps aren't pricing in. Stress-test before assuming the spread holds.
Location & tenants
- Location reads 70/100 on livability (#44 in MS) — a middle-class / working-renter tenant base. Strengths: crime A+, cost of living A+, housing A+; Watch: amenities F, commute F, health & safety F.
- Desoto County School District (suburban): math 48% / reading 42% proficiency, ranked #20 of 130 in MS (top 15%) — families likely to look elsewhere, expect single-tenant / working-renter base with shorter leases.
- Zoned schools: Hernando Hills Elementary (math 68% / reading 61%, grade B, #16 of 375 statewide, top 4%, 692 students, 100% FRL); Hernando Middle School (math 75% / reading 57%, grade A-, #2 of 179 statewide, top 1%, 1,150 students, 100% FRL); Hernando High School (math 69% / reading 62%, grade B, #2 of 197 statewide, top 1%, 1,419 students, 100% FRL) — zoned schools average 100% FRL vs 43% district-wide (56 pts higher); higher-poverty schools than district average — tighter screening recommended.
- Zoned-school proficiency averages 65% at this address vs 45% district-wide (+20 pts) — the actual schools serving this property are materially stronger than the Desoto County School District average implies; a family-tenant draw the district grade alone would hide.
- Market conditions: 121 active listings in the ZIP; 2 comparable units currently listed for rent nearby; 1,155 units permitted in DeSoto County in 2024 (0 in 5+ unit buildings).
Forward outlook
- Local home prices are declining (-3.0%/yr); year-one equity from $2k of loan paydown is wiped out by about $10k of value loss. Plan a longer hold.
- DeSoto County population projected at +33% by 2050 — long-run rental-demand tailwind backs the buy-and-hold thesis.
Negotiation context
- It's been on market 22 days — a 2% lower offer ($322k) is reasonable based on typical stale-listing flexibility.
Questions for the listing agent
- What does the HOA fee cover, when was the last increase, and are there any pending special assessments or reserve-fund shortfalls?
- Is there a deadline driving the sale (1031 exchange, divorce, estate, relocation)? That informs how much negotiation room exists.
- Schools are B-rated — typically a magnet for longer-tenancy family renters. What's the average tenant stay here, and is there a school-zone premium baked into asking?
- What's the average days-on-market for RENTAL listings here right now (not sales)? A rising rental-DOM trend means longer vacancies and softer asking-rent achievability than the comps imply.
- What's the recent tenant-quality profile in this submarket — average credit score on applications, eviction rate, late-payment / NSF rate, and stable-employment percentage? A property-management company in the area should have these aggregated.
- How much new for-sale + rental construction is in the pipeline within 1–3 miles? Heavy new supply typically softens prices + rents 12–24 months out; constrained supply supports both.
Investment metrics
- 1% rule
- 0.99% ✗
- Cap rate
- 7.23%
- Cash-on-cash
- 3.35%
- DSCR
- 1.15
- GRM
- 8.4
CMA / ARV
- ARV (on-the-fly)
- $323,990
- Comps found
- 12
Show comp detail 12 sales within ~0.75 mi
| Address | Dist | Beds/Ba | Sqft | Sold | Price | $/sf | Match |
|---|---|---|---|---|---|---|---|
| 433 Sunflower St | 0.00mi | 3/2.0 | 1,810 (0%) | 1mo | $326,900 | $181 | 99 |
| 526 Bolivar Dr | 0.07mi | 3/2.0 | 1,813 (+0%) | 2mo | $326,900 | $180 | 95 |
| 432 Bolivar Dr | 0.05mi | 3/2.0 | 1,810 (0%) | 4mo | $323,900 | $179 | 94 |
| 550 Bolivar Dr | 0.09mi | 3/2.0 | 1,810 (0%) | 4mo | $326,900 | $181 | 93 |
| 538 Bolivar Dr | 0.08mi | 3/2.0 | 1,874 (+4%) | 1mo | $338,900 | $181 | 90 |
| 514 Bolivar Dr | 0.06mi | 4/2.0 (+1) | 1,876 (+4%) | 1mo | $338,900 | $181 | 85 |
| 502 Bolivar Dr | 0.05mi | 3/2.5 | 1,933 (+7%) | 0mo | $346,900 | $179 | 84 |
| 818 W Quitman Ct | 0.31mi | 3/2.0 | 1,843 (+2%) | 2mo | $329,900 | $179 | 81 |
| 763 W Quitman Ct | 0.29mi | 4/2.0 (+1) | 1,887 (+4%) | 2mo | $337,900 | $179 | 73 |
| 828 W Quitman Ct | 0.31mi | 4/2.0 (+1) | 1,986 (+10%) | 0mo | $355,900 | $179 | 64 |
| 542 Sunflower St | 0.09mi | 4/2.5 (+1) | 2,071 (+14%) | 1mo | $370,900 | $179 | 64 |
| 654 Tallahatchie St | 0.35mi | 4/2.0 (+1) | 2,073 (+14%) | 1mo | $371,900 | $179 | 53 |
Match score weights: distance 35% · size 25% · config 20% · recency 20%. Top-matched comps best support the ARV.
Projected returns pro-forma
-3.0% appreciation · 3.0% rent growth · sell at horizon
- IRR
- -11.0%
- Equity multiple
- 0.60×
- Total profit
- $-36,278
- Equity at exit
- $48,308
- IRR
- -1.7%
- Equity multiple
- 0.88×
- Total profit
- $-10,475
- Equity at exit
- $28,013
Cash invested: $90,717 (down + closing). Projections, not guarantees.
Landlord ↔ Tenant lean methodology
- Overall (STATE)
- 90 Strongly Landlord-Friendly
- State Mississippi
- 90 Strongly Landlord-Friendly · R+11
- County
- — inherits STATE
- City
- — inherits STATE
ZIP-level market 38651
- Home prices YoY
- -28.9%
- Active inventory
- 121
- Price-to-rent
- 8.5×
Monthly cashflow live
- Estimated rent
- $3,223 medium interval (Pro) →
- Mortgage (P&I)
- −$1,699
- Tax est. 1.5%
- −$405 /mo · $4,860/yr
- Insurance
- −$135
- HOA
- −$54
- Vacancy / Maint / Mgmt
- −$677
- Net cashflow
- $253
Break-even live
Sensitivity live
| Price | -10% $477 | -5% $365 | +0% $253 | +5% $141 | +10% $30 |
|---|---|---|---|---|---|
| Rent | -10% $-1 | -5% $126 | +0% $253 | +5% $381 | +10% $508 |
| Rate | -1.0pp $417 | -0.5pp $336 | base $253 | +0.5pp $169 | +1.0pp $84 |
UW: 25.0% down · 7.5% · 30yr · 1.5% tax · 5.0% vac · 8.0% maint · 8.0% mgmt
Financing live
Cash to close
- Down payment
- $80,998
- Closing costs
- $9,720
- Reserves months
- —
- Total cash needed
- —
Loan-product check · same deal, 3 products live
Conventional
25% down · 7.5% · 30yr
- Down + closing
- —
- Monthly P&I
- —
- Monthly cashflow
- —
- DSCR
- —
- Eligible?
- —
Personal DTI + credit; lowest rate.
DSCR
20% down · 8.5% · 30yr
- Down + closing
- —
- Monthly P&I
- —
- Monthly cashflow
- —
- DSCR
- —
- Eligible?
- —
No personal income docs; deal must DSCR.
Hard money
10% down · 12.0% · 12mo
- Down + closing
- —
- Monthly P&I
- —
- Monthly cashflow
- —
- DSCR
- —
- Eligible?
- —
Short-term bridge; refi at stabilization.
Rent comps 2 comps
| Address | Beds | Baths | Sqft | Rent | $/sqft | DOM | Units | Dist |
|---|---|---|---|---|---|---|---|---|
| 272 Fairway Trace Dr Lot $3800 Hernando, MS | 4.0 | 2.0 | 2000 | $3,800 | $1.90 | 44d | 1 | 1.06mi |
| 947 Clubhouse Dr Hernando, MS | 4.0 | 2.0 | 1713 | $2,495 | $1.46 | 44d | 1 | 1.40mi |
HOA detail
- Monthly dues
- $54 · $648/yr
- Likely covers
- gas
Listing history 2 events
-
2026-04-22status Pending
-
2026-03-31$326,900 Active
ⓘ Source: listings_history table (triggers on properties + properties_extension) + one-shot
backfill from property_details.listing_events for pre-trigger history.
Nearby sold comps map
Loading sold comps map…
Walkable amenities ~0.75 mi
Loading nearby amenities…
Taxation est. · year 1
- Rental income
- $38,680
- − Mortgage interest
- −$18,148
- − Property taxes
- −$4,860
- − Insurance
- −$1,620
- − Repairs & maintenance
- −$3,094
- − Management
- −$3,094
- − HOA
- −$648
- − Depreciation
- −$9,425
- Taxable loss
- −$2,210
- Est. tax savings @ 24.0%
- +$530
- After-tax cash flow
- $3,571/yr
For passive investors: Depreciation is non-cash, so a rental often shows a tax loss while cash-flowing — sheltering income. Rental losses are passive: they offset passive income freely, and up to $25,000/yr can offset ordinary (W-2) income if you actively participate and your MAGI is under $100k (phasing out to $0 by $150k); unused losses carry forward. On sale, claimed depreciation is recaptured at up to 25%, and gains may owe capital-gains tax (a 1031 exchange can defer both). Figures are a year-1 estimate at your 24.0% rate — not tax advice; consult a CPA.
Condition & rehab AI · 13 photos
This home is in excellent condition with no visible repairs needed. It's move-in ready and offers a great value with potential for further improvements to enhance its curb appeal and modernize it.
Value-add opportunities
- Both Painting exterior and interior walls — Fresh paint enhances curb appeal and interior aesthetics
- Both Landscaping and curb appeal improvements — Well-maintained landscaping increases curb appeal and property value
- Both Add smart home features — Modern technology can increase both resale and rental value
Renovation cost estimate screening
Value-add ROI direction
- Both Painting exterior and interior walls — Fresh paint enhances curb appeal and interior aesthetics ↑
- Both Landscaping and curb appeal improvements — Well-maintained landscaping increases curb appeal and property value ↑
- Both Add smart home features — Modern technology can increase both resale and rental value ↑
ⓘ Cost ranges are severity-bucket heuristics (US national rule-of-thumb). Get contractor quotes + a written scope before underwriting a rehab budget.
Schools (NCES district)
- District
- Desoto County School District
- NCES district ID
- 2801320
- Math proficiency
- 48% ▼ -13.00%
- Reading proficiency
- 42% ▼ -6.00%
- Median HH income
- $59,272
- Composite
- 39.56/100
- National rank
- #3933
- State rank
- #20 of 130 in MS
Livability — Hernando
- Score
- 70/100
- State rank
- #44
- US rank
- #8034
Category grades
Schools grade is shown separately in the Schools card above.
Census & demographics
- Census place
- Hernando, MS
- City population
- 31,374
- Population (ZIP)
- 8,491
Population outlook (DeSoto County) Hauer SSP2
- Today (2025)
- 203,338 people
- By 2030
- 217,692 · +7.1%
- By 2040
- 245,320 · +20.6%
- By 2050
- 270,133 · +32.8%
- By 2075
- 323,341 · +59.0%
- By 2100
- 348,742 · +71.5%
Race, ethnicity, and origin ACS 2023
- Neighborhood character
- Predominantly White (66%)
- Race & ethnicity
- White 66% Black 20% Hispanic / Latino 12% Two or more races 4%
- Hispanic origin (detail)
- Mexican 10%
- Common ancestry
- Lithuanian 2% Serbian 1% Romanian 1%
- Foreign-born
- 8% · Canada, Guatemala, Jamaica
- Languages at home
- 88% English-only · Spanish 12%
Political lean MEDSL · DeSoto
- 2024 margin
- Strong R (+24.1) · D 36.7% · R 60.8% · Other 2.5%
- 2008→2024 swing
- +14.2pp toward D · 2008: -38.2pp · 2024: -24.1pp
- All cycles
- 2024: R+24.1 2020: R+23.9 2016: R+34.8 2012: R+33.5 2008: R+38.2
Not yet ingested
- Civics
- —
Market trends
- HPI YoY
- ▼ -71.47%
- Current HPI
- 176.28
- Rent YoY
- —
- Metro
- —
- State GDP YoY
- —
- F500 in state
- 0
Price history
2 events — show timeline
- 2026-04-22 Pending — MLSU
- 2026-03-31 Listed $326,900 MLSU
Cash-flow waterfall
monthlySold comps — $/sqft
last 12 mo · ≤1 miLoading sold comps…