12163 Snell · Sherwood Shores, TX
Flood risk No data
- FEMA flood zone
- —
- Chance of flooding over 30 yrs
- —
- Est. flood insurance / yr
- —
Fire risk No data
- Est. fire insurance / yr
- —
Heat risk No data
- Hot days now (above threshold)
- —
- Hot days in 30 yrs
- —
Wind risk No data
- Chance of severe wind over 30 yrs
- —
Air-quality risk No data
- Unhealthy air days now
- —
- Unhealthy air days in 30 yrs
- —
Risk factors via First Street. Map © Google.
Why this score? — see what drove the B grade
The composite is a weighted blend of 9 inputs, each scored 0–100. Each bar is that input's sub-score; the figure is the points it added to the 100-point composite (weight × sub-score).
- Cash flow +25.3/30.0
- ARV discount +15.0/15.0
- Appreciation +10.0/10.0
- DSCR +8.3/10.0
- 1% rule +5.7/10.0
- Rent growth +2.5/5.0
- Schools +2.5/10.0
- Livability +2.5/5.0
- Condition / age +2.5/5.0
$215,000
🖨 Deal sheet 📄 Offer letter ✓ Due diligence
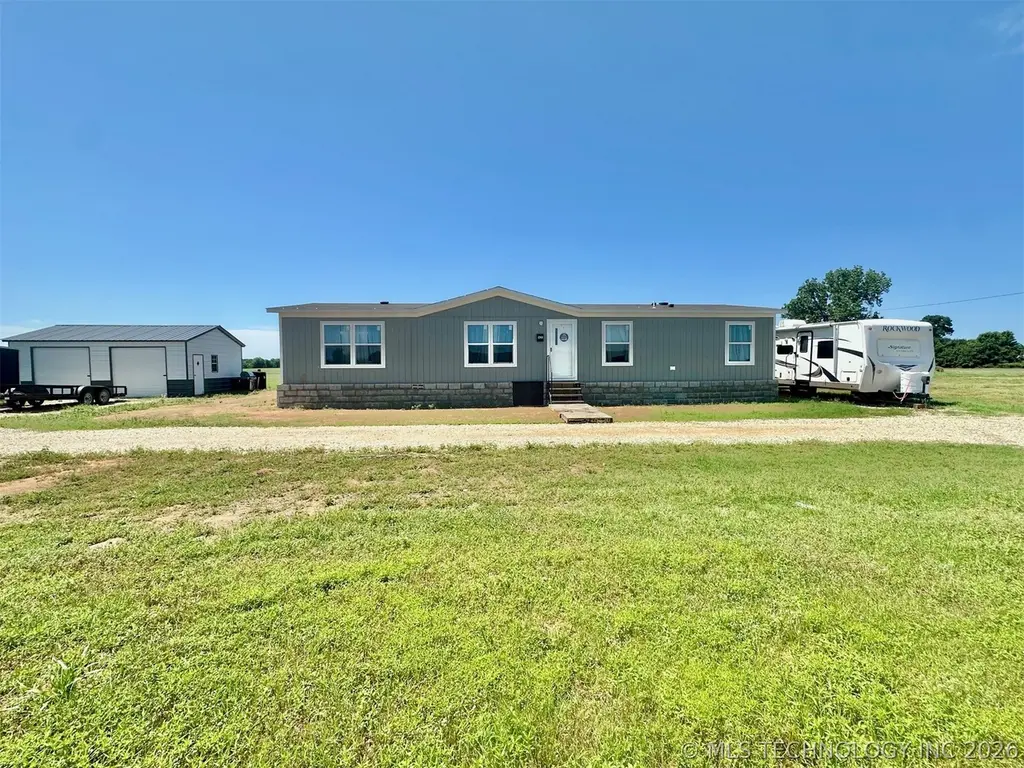
Listing remarks
Large newer double wide home at Lake Texoma! This home provides 4 bedrooms, 2 full bathrooms, open floor plan, formal dining, gravel circle drive, and 20x25 metal storage building. Close to several restaurants, boat ramps and sandy beaches of Texoma!
Key facts
- 0.75 acre lot
- Built 2024
- Listed 5 days
Property features AI
Finance
- Other: Property is less than 5 miles to Texoma Lake
Exterior
- Security: Smoke detector(s); No safety shelter
- Utilities: Electricity available; Water available (rural water source); Septic tank
- Home design: Double-wide manufactured home; Single-story; Home faces north; Crawlspace foundation
- Construction: HardiPlank exterior; Manufactured construction; Asphalt/fiberglass roof; Owner-reported year built
- Exterior features: Storage building; Workshop; No exterior features listed
Interior
- Kitchen: Built-in oven; Cooktop; Range; Oven; Dishwasher; Refrigerator
- Flooring: Laminate flooring; Vinyl flooring
- Bathrooms: 2 full bathrooms
- Heating & cooling: Central heating; Central air conditioning
- Interior features: Vaulted ceilings; Laminate countertops; Insulated vinyl windows; Electric range connection
- Laundry & utility: Electric dryer hookup; Electric water heater
Neighborhood map
What this means for you Summary
Snapshot
- This is a 3-bed/2.0-bath manufactured listed at $215k.
Deal economics
- At list price, monthly cash flow is $487 ($6k/yr) — positive.
- The deal already cash-flows at list — no discount required.
- Meets the 1% rule at list price ($2k rent vs $215k).
- Cap rate 9.0% vs local median 2.8% in Sherwood Shores — top-decile yield for the area; either an underpriced asset or a hidden risk that comps aren't pricing in. Stress-test before assuming the spread holds.
Location & tenants
- Location reads 49/100 on livability (#1,519 in TX) — a working-class tenant base; expect higher turnover. Strengths: cost of living A+, housing A+; Watch: schools F, crime F, amenities F.
- Kingston (rural): math 27% / reading 32% proficiency, ranked #70 of 270 in OK (top 26%) — low school quality limits family demand, transient renter base, plan for 1-2y turnover; 76% free/reduced lunch — lower-income household profile, screen leases tightly.
- Market conditions: 42 units permitted in Marshall County in 2024 (0 in 5+ unit buildings).
Forward outlook
- In year one you build about $23k of equity ($1k loan paydown + $22k appreciation (10.0% local appreciation)).
- Marshall County population projected at +22% by 2050 — long-run rental-demand tailwind backs the buy-and-hold thesis.
- At projected returns (10.0% appreciation + 3.0% rent growth), your $60k cash investment doubles in ~2 years — after that, you're playing with house money.
- By year 2, paydown + projected appreciation supports a ~$37k cash-out refi (75% LTV) — recoverable capital for the next deal without selling this one.
Negotiation context
- Only 6 days on market — expect competitive offers; lowballing is unlikely to land.
- 4 sale attempts since 2y ago; this cycle's ask has dropped $35k (14%) from the opening price — seller is motivated, your offer sets the floor, not the list.
- Current owner paid $49k; list at $215k implies a 339% gain — meaningful room to come down on a strong offer.
Questions for the listing agent
- Is there a deadline driving the sale (1031 exchange, divorce, estate, relocation)? That informs how much negotiation room exists.
- Schools are F-rated, which usually means shorter tenancies and higher turnover. Who's the typical renter profile here, and what's been the actual vacancy rate?
- Crime grade is F in this area — have there been break-ins, vandalism, or insurance claims at this property in the last 3 years? What carrier currently insures it and at what premium?
- What's the average days-on-market for RENTAL listings here right now (not sales)? A rising rental-DOM trend means longer vacancies and softer asking-rent achievability than the comps imply.
- What's the recent tenant-quality profile in this submarket — average credit score on applications, eviction rate, late-payment / NSF rate, and stable-employment percentage? A property-management company in the area should have these aggregated.
- How much new for-sale + rental construction is in the pipeline within 1–3 miles? Heavy new supply typically softens prices + rents 12–24 months out; constrained supply supports both.
Investment metrics
- 1% rule
- 1.07% ✓
- Cap rate
- 9.01%
- Cash-on-cash
- 9.71%
- DSCR
- 1.43
- GRM
- 7.8
CMA / ARV
- ARV (on-the-fly)
- $317,520
- Comps found
- 2
Show comp detail 2 sales within ~0.75 mi
| Address | Dist | Beds/Ba | Sqft | Sold | Price | $/sf | Match |
|---|---|---|---|---|---|---|---|
| 12315 Pineview Cir | 0.47mi | 3/2.0 | 1,578 (+4%) | 17mo | $153,800 | $97 | 56 |
| 5420 Sweetwater Rd | 0.74mi | 3/2.0 | 1,620 (+7%) | 9mo | $339,500 | $210 | 46 |
Match score weights: distance 35% · size 25% · config 20% · recency 20%. Top-matched comps best support the ARV.
Projected returns pro-forma
10.0% appreciation · 3.0% rent growth · sell at horizon
- IRR
- 31.4%
- Equity multiple
- 3.46×
- Total profit
- $148,047
- Equity at exit
- $193,689
- IRR
- 27.1%
- Equity multiple
- 7.83×
- Total profit
- $411,464
- Equity at exit
- $417,698
Cash invested: $60,200 (down + closing). Projections, not guarantees.
Landlord ↔ Tenant lean methodology
- Overall (STATE)
- 87 Strongly Landlord-Friendly
- State Texas
- 87 Strongly Landlord-Friendly · R+5
- County
- — inherits STATE
- City
- — inherits STATE
ZIP-level market 73439
- Home prices YoY
- 12.3%
- Price-to-rent
- 7.8×
Monthly cashflow live
- Estimated rent
- $2,301 medium interval (Pro) →
- Mortgage (P&I)
- −$1,127
- Tax from tax record
- −$113 /mo · $1,361/yr
- Insurance
- −$90
- HOA
- −$0
- Vacancy / Maint / Mgmt
- −$483
- Net cashflow
- $487
Break-even live
UW: 25.0% down · 7.5% · 30yr · 1.5% tax · 5.0% vac · 8.0% maint · 8.0% mgmt
Financing live
Cash to close
- Down payment
- $53,750
- Closing costs
- $6,450
- Reserves months
- —
- Total cash needed
- —
Loan-product check · same deal, 3 products live
Conventional
25% down · 7.5% · 30yr
- Down + closing
- —
- Monthly P&I
- —
- Monthly cashflow
- —
- DSCR
- —
- Eligible?
- —
Personal DTI + credit; lowest rate.
DSCR
20% down · 8.5% · 30yr
- Down + closing
- —
- Monthly P&I
- —
- Monthly cashflow
- —
- DSCR
- —
- Eligible?
- —
No personal income docs; deal must DSCR.
Hard money
10% down · 12.0% · 12mo
- Down + closing
- —
- Monthly P&I
- —
- Monthly cashflow
- —
- DSCR
- —
- Eligible?
- —
Short-term bridge; refi at stabilization.
Listing history 32 events
-
2026-06-19days on market $215,000 Active 6 DOM
-
2026-06-18days on market $215,000 Active 5 DOM
-
2026-06-17days on market $215,000 Active 4 DOM
-
2026-06-16days on market $215,000 Active 3 DOM
-
2026-06-15days on market $215,000 Active 2 DOM
-
2026-06-14pricedays on market $215,000 Active 1 DOM
-
2026-06-13days on market $220,000 Active 182 DOM
-
2026-06-10days on market $220,000 Active 180 DOM
-
2026-06-09days on market $220,000 Active 179 DOM
-
2026-06-08days on market $220,000 Active 178 DOM
-
2026-06-07days on market $220,000 Active 177 DOM
-
2026-06-05days on market $220,000 Active 174 DOM
-
2026-06-02days on market $220,000 Active 172 DOM
-
2026-06-01days on market $220,000 Active 171 DOM
-
2026-05-31days on market $220,000 Active 170 DOM
-
2026-05-30days on market $220,000 Active 169 DOM
-
2026-04-08price $220,000
-
2026-04-03price $215,000
-
2026-02-23price $220,000
-
2026-01-21price $245,000
-
2025-12-12$250,000 Active
-
2025-12-11historical
-
2025-08-26price $250,000
-
2025-07-14price $265,000
-
2025-06-11$279,000 Active
-
2025-05-11historical
-
2024-11-20$349,900 Active
-
2024-08-16soldstatus $49,000 Closed
-
2024-07-15status Pending
-
2024-06-25price $52,800
-
2024-06-25price $52,900
-
2024-06-25$49,900 Active
ⓘ Source: listings_history table (triggers on properties + properties_extension) + one-shot
backfill from property_details.listing_events for pre-trigger history.
Tax reassessment forecast TX · Resets to sale price
- Current annual tax
- $1,361 · $113/mo
- Projected year-2 tax
- $3,934 · $328/mo
- Expected delta
- +$2,574/yr (+$214/mo · 189.1%)
ⓘ Screening estimate from a state-policy table — verify with the county assessor before closing.
Nearby sold comps map
Loading sold comps map…
Walkable amenities ~0.75 mi
Loading nearby amenities…
Taxation est. · year 1
- Rental income
- $27,606
- − Mortgage interest
- −$12,043
- − Property taxes
- −$1,361
- − Insurance
- −$1,075
- − Repairs & maintenance
- −$2,208
- − Management
- −$2,208
- − Depreciation
- −$6,255
- Taxable income
- $2,455
- Est. tax owed @ 24.0%
- −$589
- After-tax cash flow
- $5,254/yr
For passive investors: Depreciation is non-cash, so a rental often shows a tax loss while cash-flowing — sheltering income. Rental losses are passive: they offset passive income freely, and up to $25,000/yr can offset ordinary (W-2) income if you actively participate and your MAGI is under $100k (phasing out to $0 by $150k); unused losses carry forward. On sale, claimed depreciation is recaptured at up to 25%, and gains may owe capital-gains tax (a 1031 exchange can defer both). Figures are a year-1 estimate at your 24.0% rate — not tax advice; consult a CPA.
Schools (NCES district)
- District
- Kingston
- NCES district ID
- 4016590
- Math proficiency
- 27% ▼ -7.00%
- Reading proficiency
- 32% ▼ -7.00%
- Median HH income
- $40,655
- Composite
- 24.88/100
- National rank
- #7585
- State rank
- #70 of 270 in OK
Livability — Sherwood Shores
- Score
- 49/100
- State rank
- #1519
- US rank
- #25941
Category grades
Schools grade is shown separately in the Schools card above.
Census & demographics
- Population (ZIP)
- 7,011
Population outlook (Marshall County) Hauer SSP2
- Today (2025)
- 17,405 people
- By 2030
- 18,038 · +3.6%
- By 2040
- 19,513 · +12.1%
- By 2050
- 21,283 · +22.3%
- By 2075
- 27,884 · +60.2%
- By 2100
- 35,435 · +103.6%
Race, ethnicity, and origin ACS 2023
- Neighborhood character
- Predominantly White (75%)
- Race & ethnicity
- White 75% Two or more races 16% Native American 5% Hispanic / Latino 4%
- Common ancestry
- Lithuanian 3% Italian 2% Serbian 1%
- Foreign-born
- 1% · Canada
- Languages at home
- 97% English-only · Spanish 3%
Political lean MEDSL · Marshall
- 2024 margin
- Solid R (+63.4) · D 17.7% · R 81.2% · Other 1.1%
- 2008→2024 swing
- -24.6pp toward R · 2008: -38.8pp · 2024: -63.4pp
- All cycles
- 2024: R+63.4 2020: R+62.5 2016: R+56.6 2012: R+45.7 2008: R+38.8
Not yet ingested
- Civics
- —
Market trends
- HPI YoY
- ▲ 26.96%
- Current HPI
- 246.2253
- Rent YoY
- —
- Metro
- —
- State GDP YoY
- ▲ 3.95%
- F500 in state
- 110
Industry mix (Fortune 500 HQ in TX)
| Industry | F500 HQs | Revenue |
|---|---|---|
| Energy | 16 | $1,198B |
|
||
| Technology | 5 | $198B |
|
||
| Engineering / Construction | 4 | $72B |
|
||
| Energy Services | 3 | $60B |
|
||
| Utilities | 3 | $41B |
|
||
| Healthcare | 2 | $330B |
|
||
Price history
+340.9% since first listed16 events — show timeline
- 2026-04-08 Price Changed $220,000 MLS Technology, Inc.
- 2026-04-03 Price Changed $215,000 MLS Technology, Inc.
- 2026-02-23 Price Changed $220,000 MLS Technology, Inc.
- 2026-01-21 Price Changed $245,000 MLS Technology, Inc.
- 2025-12-12 Listed $250,000 MLS Technology, Inc.
- 2025-12-11 Listing Removed — MLS Technology, Inc.
- 2025-08-26 Price Changed $250,000 MLS Technology, Inc.
- 2025-07-14 Price Changed $265,000 MLS Technology, Inc.
- 2025-06-11 Listed $279,000 MLS Technology, Inc.
- 2025-05-11 Listing Removed — MLS Technology, Inc.
- 2024-11-20 Listed $349,900 MLS Technology, Inc.
- 2024-08-16 Sold (MLS) $49,000 MLS Technology, Inc.
- 2024-07-15 Pending — MLS Technology, Inc.
- 2024-06-25 Price Changed $52,800 MLS Technology, Inc.
- 2024-06-25 Price Changed $52,900 MLS Technology, Inc.
- 2024-06-25 Listed $49,900 MLS Technology, Inc.
Property tax history
+147.3%/yrLatest (2025): $1,361 · +1429.2% YoY. Source: county tax records.
Cash-flow waterfall
monthlySold comps — $/sqft
last 12 mo · ≤1 miLoading sold comps…